Dhampur Bio Organics cmp 95.76 by Daily Chart viewDhampur Bio Organics cmp 95.76 by Daily Chart view
- Support Zone 75 to 85 Price Band
- Resistance Zone 95 to 105 Price Band
- Resistance Zone holding strong since a year from January 2025
- Head & Shoulders around Support Zone and last Rounding Bottom
- Heavy Volumes surge seen last week Friday by demand based buying
- Bullish Rounding Bottoms with good consolidation around Support Zone
- Falling Resistance Trendlines Breakout with Rising Support Trendline been respected
Headandshouldersformation

MIDCAP NIFTY CAN HIT 22-25% Long period Head and Shoulder pattern breakout and retest and upward breakout seen in MIDCAP NIFTY suggest minimum 20-25% upside.

Bajaj Finance cmp 990.45 by Daily Chart viewBajaj Finance cmp 990.45 by Daily Chart view
- Support Zone 955 to 980 Price Band
- Resistance Zone 1005 to 1030 Price Band
- Bearish Head & Shoulders by neckline just above Support Zone
- IF ..... Support Zone brake then basis Bearish H&S downfall expected
- Support Zone tested, hoping it sustains, expect upside reversal by past data

#ADANIENT – Massive Head & Shoulders Breakdown Loading?ADANIENT is completing a major weekly H&S pattern 👤, with price sliding toward the neckline.
It’s now sitting on the critical support zone: 1966–2078 ⚠️
A WCB below this zone can trigger a 50%+ fall, potentially revisiting the previous lows below 1000 📉 💣
Trend stays weak unless it reclaims 2614 on WCB. Stay alert! 👀
#ADANIENT #HeadnShouldersPattern #ChartPattern #PriceAction
📌 #Disclaimer: This analysis is shared for educational purposes only. It is not a buy/sell recommendation. Please do your own research before making any trading decisions.

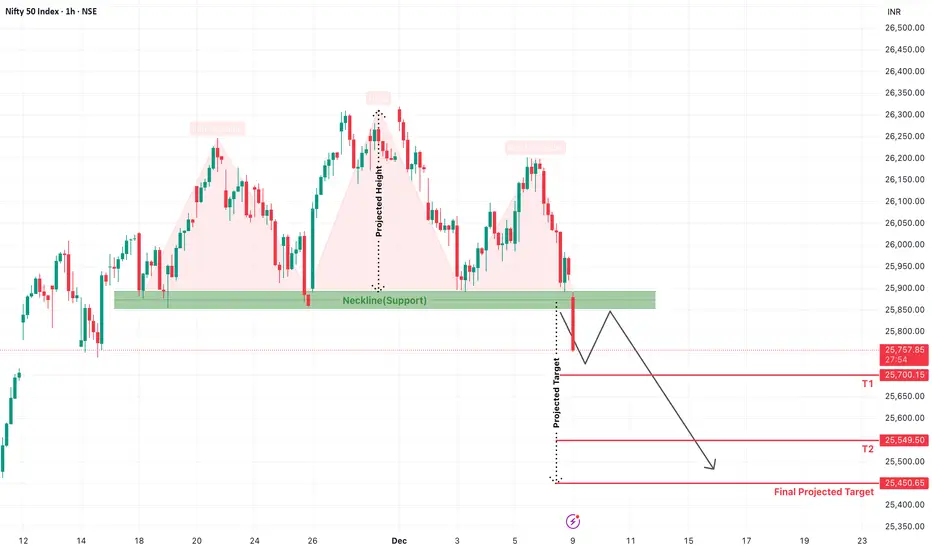
Nifty 50 Forms a Bearish Head & Shoulders PatternThe Nifty 50 index has officially broken below a crucial support zone, completing a classic Head & Shoulders reversal pattern on the 1-hour chart. This bearish structure normally appears at the top of an uptrend and indicates a potential trend reversal — and that’s exactly what the current setup suggests.
Key Technical Highlights
The Left Shoulder, Head, and Right Shoulder are clearly visible.
Nifty attempted multiple bounces from the Neckline support zone (around 25,850–25,900) but failed to sustain.
Today’s clean breakdown below this neckline confirms the reversal pattern.
According to the projected height method, Nifty may extend its decline towards the following levels:
Downside Targets
T1: 25,700
T2: 25,549
Final Projected Target: 25,450
What to Expect Next?
A short pullback or retest of the neckline is possible, which may attract sellers again. As long as Nifty trades below the neckline zone, the bias stays bearish and deeper corrections remain likely.
ICICIBANK - Inverted Head & Shoulder suggests 1450ICICI Bank has completed a clean Inverted Head and Shoulders pattern on the 4H chart, signalling a possible trend reversal after the recent downtrend. The left shoulder formed near 1360 , the head at 1317 , and the right shoulder at 1354 . All three points reflect stronger structure and consistent buying interest on dips. The stock has now crossed the neckline around 1387–1390 , a zone where it faced repeated rejection earlier. This breakout shows that buyers have finally taken control.
If the price continues to hold above the neckline, momentum is likely to push it toward the projected target of 1440–1450 , which matches the “final destination” zone shown on your chart. The breakout would lose strength only if the price falls back below 1387 , but unless that happens, the pattern suggests the move still has room to extend higher.

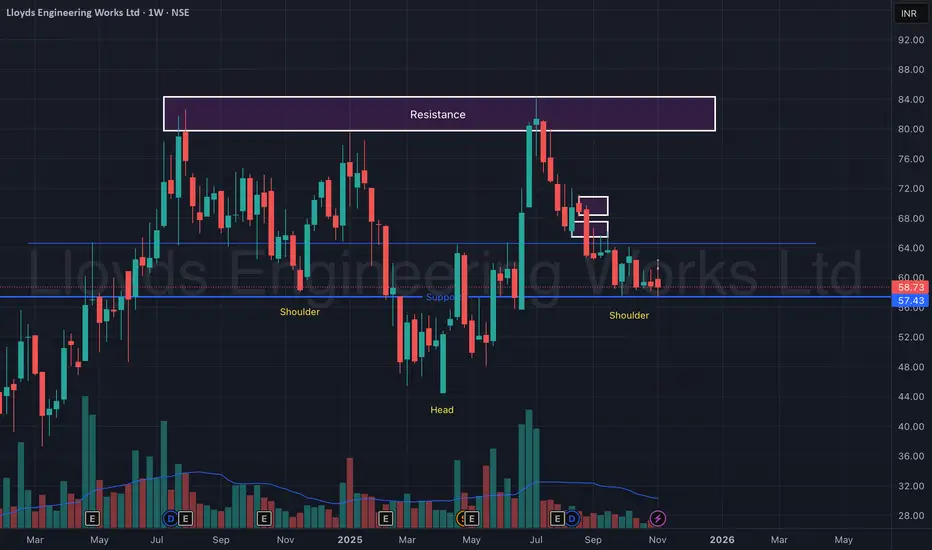
Lloyds Engineering Works Ltd – Ready to Blast from Support Zone!Lloyds Engineering is showing a textbook Inverted Head & Shoulders pattern on the weekly timeframe — a strong reversal formation that often precedes a major uptrend.
The support zone near ₹57–₹58 has held firmly for months, acting as a base for accumulation.
A bullish structure is clearly visible, with both shoulders aligning near the same horizontal support and increasing volumes hinting at smart money participation.
Once the stock decisively breaks above the ₹64 neckline zone, a powerful breakout toward ₹80+ could unfold in the coming weeks.
🎯 Key Levels:
CMP: ₹58.73 (+0.22%)
Pattern: Inverted Head & Shoulders
Support Zone: ₹57 – ₹58 (Strong base)
Neckline / Breakout Zone: ₹64 – ₹66
Target Zone: ₹80 – ₹85
Stop-Loss: ₹54 (Weekly close basis)
📊 Technical View:
Inverted Head & Shoulders forming over a year-long base.
Strong volume spikes near the right shoulder = early accumulation.
EMAs flattening and ready for crossover confirmation.
Sustaining above ₹64 could ignite momentum breakout toward ₹80+.
🧠 View:
Lloyds Engineering looks technically ready for a breakout. With the pattern structure completed and strong volume support, a close above ₹64 can trigger a new uptrend — this one’s “ready to blast.”
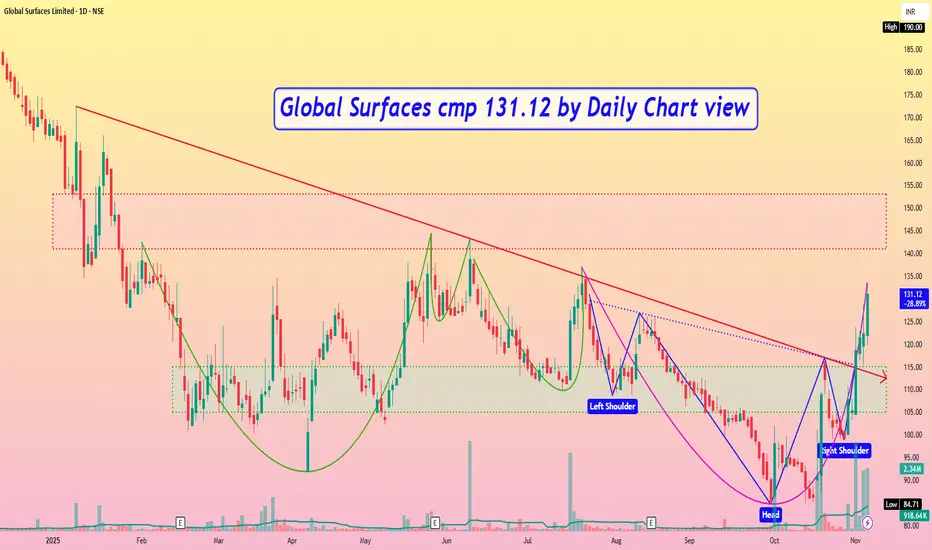
Global Surfaces cmp 131.12 by Daily Chart viewGlobal Surfaces cmp 131.12 by Daily Chart view
- Support Zone 105 to 115 Price Band
- Resistance Zone 141 to 153 Price Band
- Multiple Bullish Technical Chart patterns done
- Falling Resistance Trendline Breakout well sustained
- Majority of Technical Indicators seen trending positively
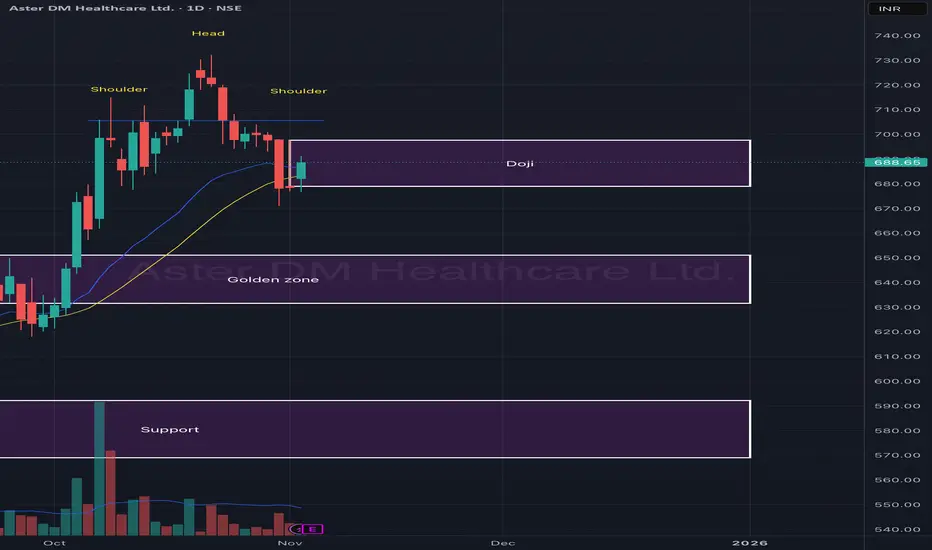
Aster DM Healthcare Ltd – Head & Shoulders Pattern with Doji at Aster DM Healthcare is currently forming a Head & Shoulders pattern, indicating potential short-term distribution after a strong uptrend. The right shoulder has developed with a Doji candle near support — suggesting indecision and possible reversal or continuation depending on the next few sessions.
The stock is hovering around its golden zone (₹640–₹660) — a critical area to watch for either a bounce or a breakdown. Sustaining above this zone can lead to recovery, while failure to hold it could push prices back to the lower support zone.
🎯 Key Levels:
CMP: ₹688.65 (+1.50%)
Pattern: Head & Shoulders
Doji Zone: ₹685 – ₹700
Golden Zone: ₹640 – ₹660 (key retracement area)
Major Support: ₹580 – ₹600
📊 Technical View:
Head & Shoulders structure forming after a sharp rally.
Doji candle shows hesitation near the neckline zone — watch next candle for confirmation.
20 EMA acting as dynamic support; breakdown below it can accelerate selling.
Volume contraction indicates reduced momentum — possible retest ahead.
🧠 View:
Aster DM is at a key decision point. A daily close above ₹700 could invalidate the bearish setup and trigger recovery, while a breakdown below ₹660 may lead to a slide toward ₹600. The Doji formation adds to the significance of the next move.
Head & Shoulder completes in Ultratech Cement Ltd.A head and shoulder pattern is finished in Ultracemco, and on the breach of the neckline, the short trading setup will be triggered.
All the targets are marked on the chart.
Only if this breaches the selling level marked (11876), it will be validated. Otherwise, it will test the height of the right shoulder again, creating a new wedge pattern.

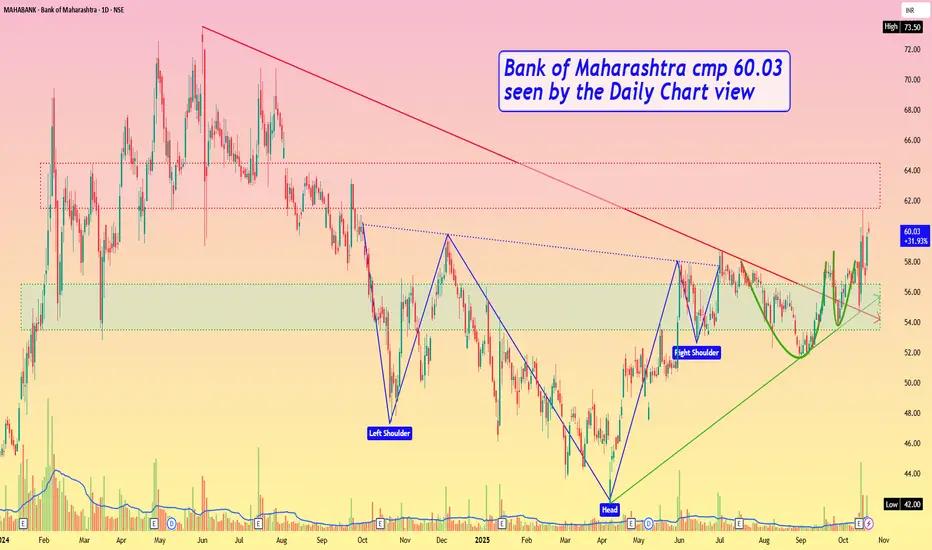
Bank of Maharashtra cmp 60.03 by Daily Chart viewBank of Maharashtra cmp 60.03 by Daily Chart view
- Support Zone 53.50 to 56.50 Price Band
- Resistance Zone 61.50 to 64.50 Price Band
- Bullish Head & Shoulders plus Rounding Bottoms around Support Zone
- Breakout from Falling Resistance Trendline and Rising Support Trendline maintained
- Volume are in close sync with avg traded quantity and spiking heavily over past few days
EURUSD – Head and Shoulders Breakdown in Play!!The chart is showing a clear Head and Shoulders formation, a bearish reversal structure that signals the market may be preparing for a deeper drop if neckline support gives way.
Chart validation:
Left Shoulder, Head, and Right Shoulder are well-defined.
The neckline sits around 1.1646 – this is the critical level to watch.
Current price is hovering above the neckline, but pressure is building on the downside.
Invalidation sits above 1.1850 – if price pushes past this level, the bearish setup is negated.
Targets from the structure:
A clean break below 1.1646 confirms the pattern.
Measured move points towards 1.1430 area as the downside objective.
Along the way, short-term jolts could test 1.1550, but the major momentum favors sellers if neckline breaks.
Trading view:
As long as EURUSD stays below the right shoulder resistance and 1.1850, bias leans bearish. The neckline is the trigger – once broken, the head and shoulders formation comes into full effect, opening space for a sharper correction.Trade safe !!

NiftyITNifty IT | CMP: 33,702
The index made its all-time high (ATH) in December 2024 and has since been in a structural decline. After hitting a low in April 2025, it has been moving within a parallel channel, testing the upper boundary in June 2025.
Support Zone 1 (31,230–30,575):
This level has repeatedly acted as both supply and demand. It provided resistance in Nov 2022 and Feb 2023, later turning into strong support in Oct 2023, June 2024, and Apr 2025 . A retest of this zone cannot be ruled out, but if it fails to hold, the price may drift lower towards the next critical zone.
Support Zone 2 (26,399–25,499):
This is the most significant demand area, created largely during the consolidation phase between Jan–May 2021, and reinforced in Jun/Jul 2022, Sept 2022, and Apr 2023 . Post this accumulation, the index witnessed a sharp rally to its last ATH.
These two zones together formed a broad rectangular base between Jun 2021 – Aug 2023 , which provided strong momentum to the bulls.
The period from Mar 2020 – Jan 2022 was exceptional for the bulls, driving prices far ahead of valuations. While this resulted in the ATH, the subsequent correction was inevitable as disparity levels stretched excessively. The ongoing correction is essentially a healthy cooling-off phase before the next sustainable move.
That said, this entire consolidation and corrective cycle may still take another 1–2 years to fully play out.

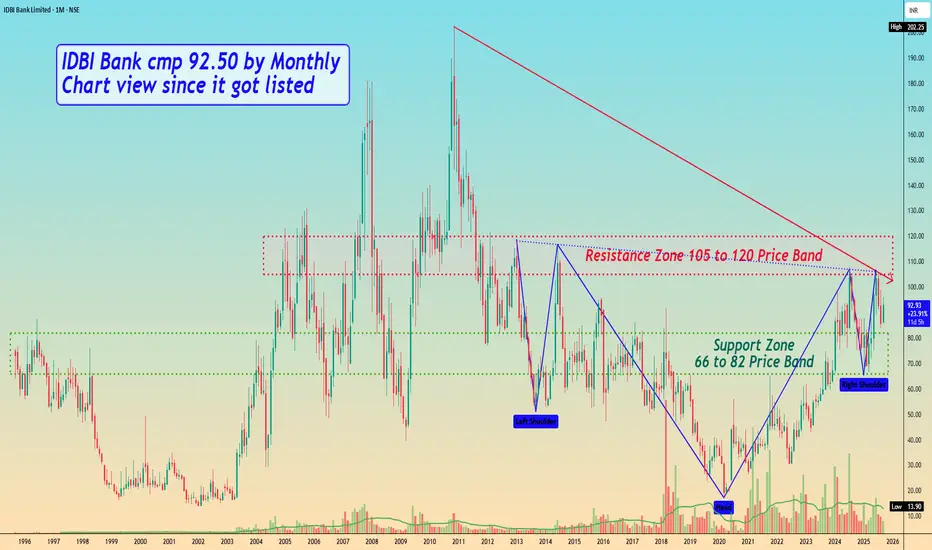
IDBI Bank cmp 92.50 by Monthly Chart view since it got listedIDBI Bank cmp 92.50 by Monthly Chart view since it got listed
- Support Zone 66 to 82 Price Band
- Resistance Zone 105 to 120 Price Band
- Bullish Cup and Handle done indicative of good upside probability
- Resistance Zone acting strongly hence Price move getting rejected since October 2011
- Breakout above Resistance Zone needs heavy traded Volumes increase and needs to sustain above it for few days to foresee and anticipate fresh upside 🤞🏽🤞🏽🤞🏽🤞🏽
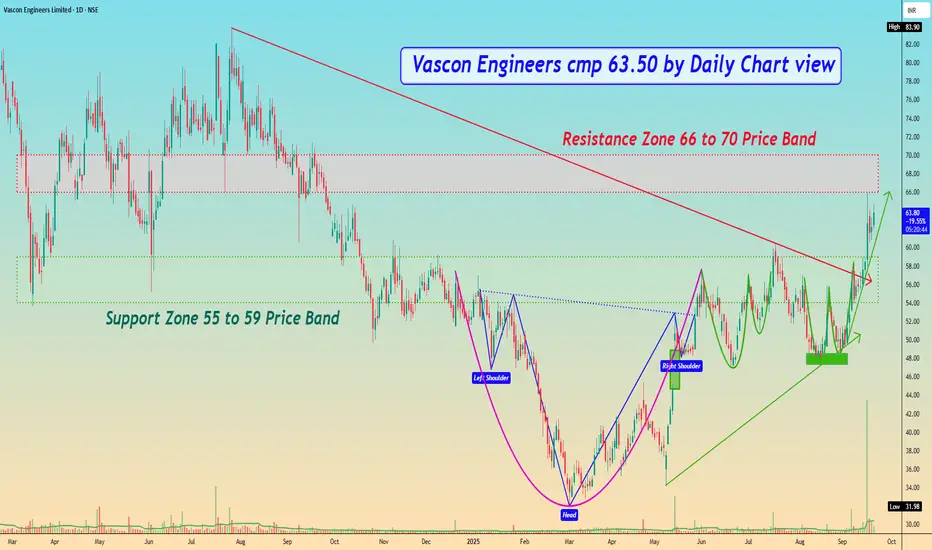
Vascon Engineers cmp 63.50 by Daily Chart viewVascon Engineers cmp 63.50 by Daily Chart view
- Support Zone 55 to 59 Price Band
- Resistance Zone 66 to 70 Price Band
- Heavy Volumes surge based breakout above Support Zone earlier Resistance Zone
- Multiple Bullish Patterns made around Support Zone with Head & Shoulders, Rounding Bottoms, Cup and Handle
bbtc bearishi think can go to below 1000 , already below 200 dma
Disclaimer- Just my view and opinion trade at your own risk not an investment advice these are only for educational purposes

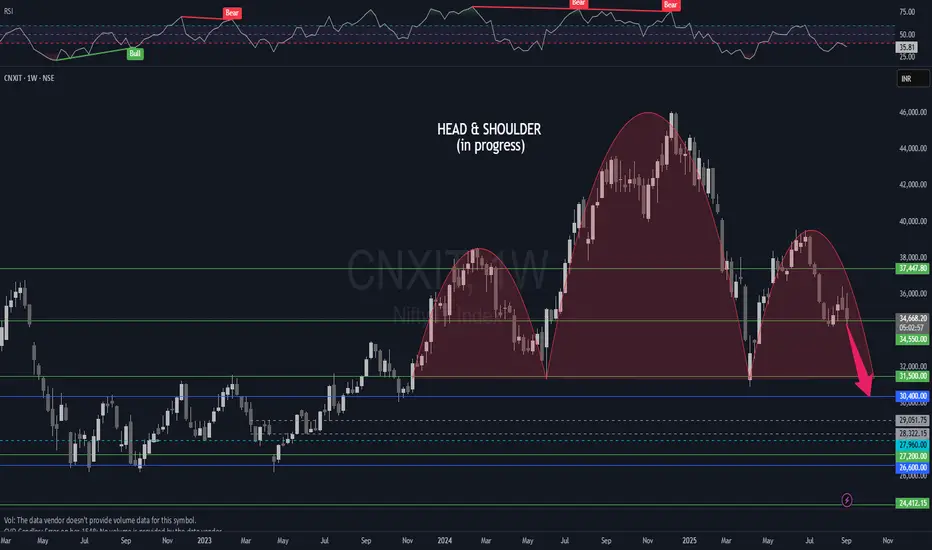
CNXIT - Head & Shoulder in progress on weekly chartsThe Indian IT sector is in a terrible state. The formation of a head and shoulder pattern on a weekly chart is a disastrous indication of worse times ahead. While NSE:TCS fired 15k employees in the recent past, the future seems dimmer. A similar pattern can be observed in almost all IT stocks. Caution is the way forward. All the long positions in IT must be doubly checked and closely monitored.
Disclaimer: The idea is for educational and informational purposes only and must not be construed as advice to buy/sell. Please consult your investment advisor before making a financial decision. Investments are subject to market risks!
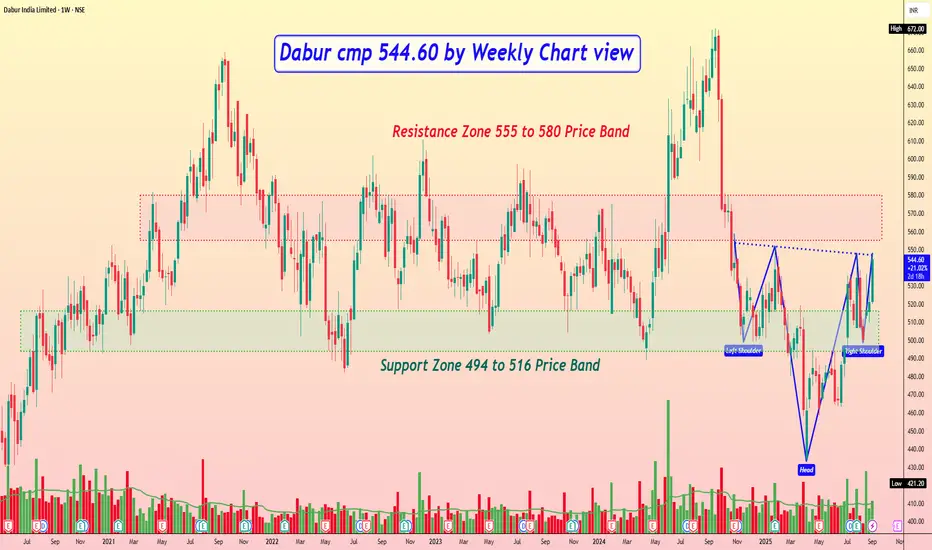
Dabur cmp 544.60 by Weekly Chart viewDabur cmp 544.60 by Weekly Chart view
- Support Zone 494 to 516 Price Band
- Resistance Zone 494 to 516 Price Band
- Breakout probable basis ongoing Support Zone test retest
- Closely considerate Bullish Head & Shoulders with Resistance Zone neckline
- Volumes are seen spiking well above average traded quantity over the past few weeks
- Favorably trending Technical Indicator signals shown by BB, EMA, MACD, RSI, SuperTrend
NIFTY50 - Head & Shoulders Pattern Signals Bearish RiskIn the 30-minute chart of NIFTY 50, a classic Head & Shoulders pattern has clearly emerged, which could act as a potential trend reversal signal. This pattern often appears near the end of a bullish phase and can warn traders of a short-term or medium-term top.
The Left Shoulder formed around 20th August, followed by a sharp rally into the Head near 25,150 levels on 22nd August. The price then retraced to the neckline support zone around 24,850, bounced to create the Right Shoulder, and is now hovering just above this critical support.
Support Zone Becomes a Decider
The support zone between 24,850 and 24,880 has now become the key level to watch. A clean break below this neckline support could activate the pattern, confirming a bearish breakdown with a projected target near 24,600 and possibly extending towards 24,450 if momentum builds.
However, the pattern is not yet confirmed. Price is still within the formation, and a strong bounce from this support level could invalidate the breakdown scenario, potentially triggering a short-covering rally.
What Traders Should Monitor
- Breakdown Confirmation: A 30-min candle closing below 24,850 with increasing volume is necessary to confirm the bearish setup.
- Invalidation Point: If the index breaks above 25,050, the right shoulder fails, and the pattern gets invalidated.
- Target Calculation: The vertical distance from the Head (25,150) to the neckline (24,850) is approx. 300 points, which gives a downside target near 24,550.
Risk Management
- Aggressive Sellers: Can enter short below 24,850 on confirmation, keeping a tight SL above 25,000.
- Conservative Approach: Wait for retest of broken support or enter only if price starts forming lower highs below the neckline.
- No Entry Yet: The structure is not triggered yet. Premature trades can lead to whipsaws.
Conclusion
This Head & Shoulders setup in NIFTY 50 is worth tracking closely. If confirmed, it can offer a high-probability short trade in the coming sessions. However, until the neckline breaks with conviction, traders must maintain caution and avoid early entries. The market is currently at a make-or-break point, and the next move will likely set the tone for the week ahead.

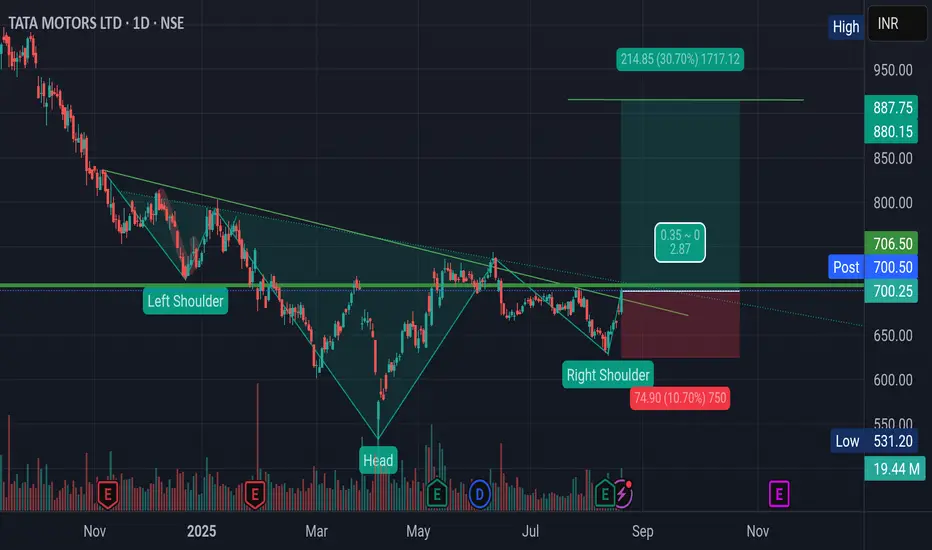
Inverted H&S Breakout in Tata MotorsMotor and electric Vehicle giant Tata Motors has given Breakout from Inverted Head and Shoulder pattern with good volume.
Once the price sustains and closes above Rs. 707. The stock should rally to its target of Rs. 880
One Should remain positive till price breaches and sustains below right Shoulder of the pattern.
The possibility of positive movement is fueled by the recent GST rate Cut possibility announced by PM modi. 👌
Also, there is positive news about fulfillment of Rare Earth Metals (very essential in EV vehicles) from China.😱
Note: This analysis is for Educational Purpose Only. Please invest after consulting a professional financial advisor.
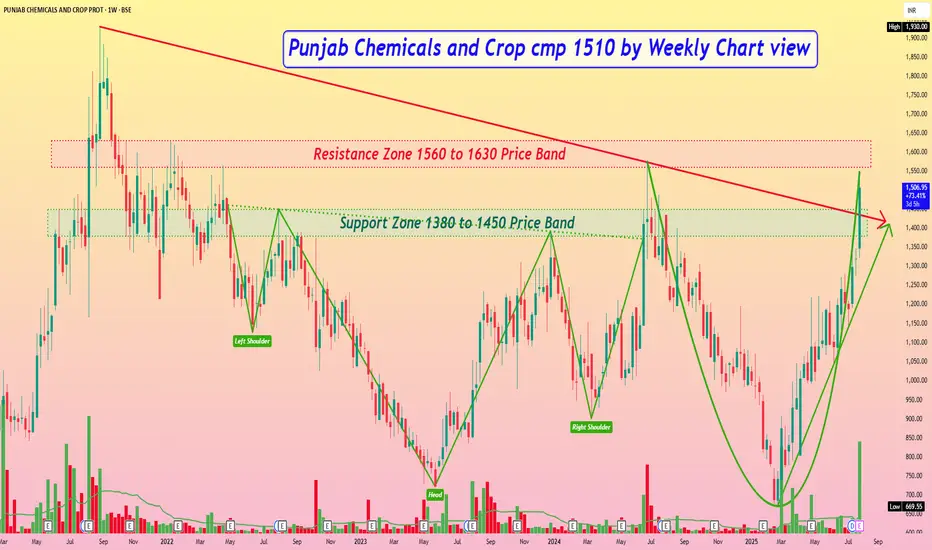
Punjab Chemicals and Crop cmp 1510 by Weekly Chart viewPunjab Chemicals and Crop cmp 1510 by Weekly Chart view
- Support Zone 1380 to 1450 Price Band
- Resistance Zone 1560 to 1630 Price Band
- Volumes spiked heavily today by demand based buying
- Bullish Head & Shoulders followed by Bullish Rounding Bottom patterns
- Resistance Zone neckline hurdle crossing needed for fresh upside breakout momentum
- Falling Resistance Trendline Broken and Rising Support Trendline sustained indicates good bullishness
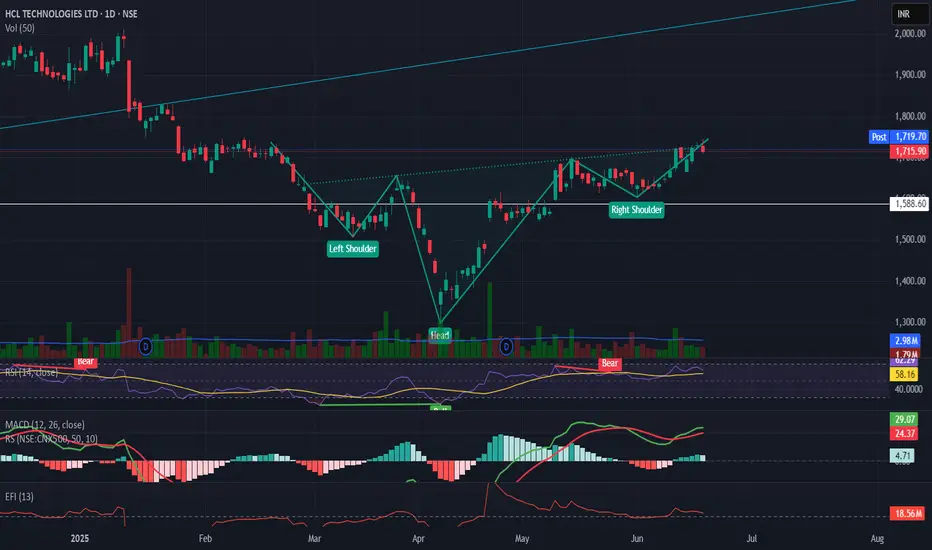
HclTech with inverse head and shoulders patternHclTech is showing six months long inverse head and shoulders pattern with major resistance at 1750.
RSI at 58
MACD is above its signal line and trending higher.
Efi Is above zero and is stable right now
target at 2140-2400 based on the pattern
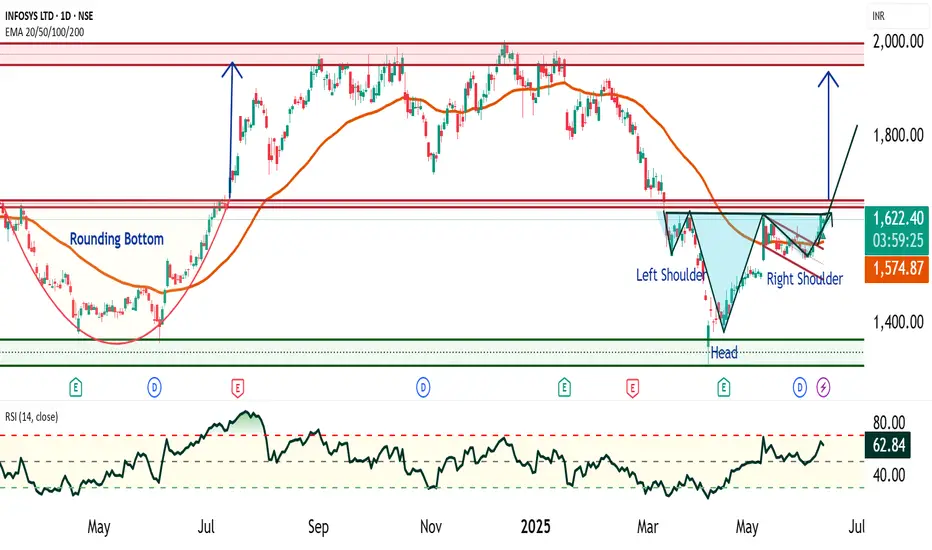
Infosys - Bullish Flag and Head & Shoulder Patterns🔍 1. Infosys Current Price Range and Key Levels
Since January 2021, Infosys has been trading in a broad range between ₹1300 and ₹2000, consolidating for over 4 years. Within this range, there are three key support and resistance levels to watch closely:
Support: ₹1300 (major floor)
Intermediate Resistance/Support Zone: ₹1600 – ₹1650
Strong Resistance: ₹2000 (upper bound)
📈 2. Bullish Flag Pattern: A Bullish Flag is a continuation pattern that forms after a strong upward price move "flagpole", followed by a period of consolidation in a narrow downward or sideways channel "flag". It typically signals a pause before the uptrend resumes.
Infosys recently broke out of a bullish flag pattern and crossed above ₹1580 with a strong closing on higher volume, indicating renewed buying interest.
Price is currently trading above the 50-day Exponential Moving Average (EMA), confirming the continuation of the mid-term uptrend.
However, the zone around ₹1650 remains a strong and key resistance level to monitor closely.
🧩 3. Potential Bullish Head and Shoulders Pattern Above ₹1650
Should Infosys break decisively above ₹1650, it is likely to form another significant bullish pattern known as the Bullish Head and Shoulders.
This pattern signals a trend reversal from bearish to bullish and is considered highly reliable.
Trend: Appears after a downtrend or consolidation, signaling reversal
Touchpoints: Three lows – left shoulder, head (lowest point), and right shoulder, roughly at similar levels
Neckline: The resistance line connecting the highs between shoulders and head
Timeframe: Medium-term, often forming over weeks up to 6 months
Volume: Typically higher volume on left shoulder and head formation, volume dips on right shoulder, and surges on breakout
⚠️ 4. Key Concerns in Infosys Chart Pattern
Price-Volume Divergence: During the head formation, volume increased sharply as price fell — indicating strong selling pressure. However, volume was low when price approached the neckline — suggesting weak buying interest to confirm breakout. This divergence signals potential caution.
Resistance Zone: Price remains below the key resistance at ₹1650, which has acted as a ceiling multiple times. A decisive breakout is required to sustain further upside momentum.
⚠️ Disclaimer
This report is intended solely for educational and training purposes and does not constitute investment advice. Traders and investors should conduct their own research and consult financial advisors before making trading decisions.