BTC Forms Head and Shoulders Pattern Key Levels to WatchBitcoin has formed a head and shoulders pattern, signaling a potential trend reversal. To confirm this pattern, CRYPTOCAP:BTC needs to reclaim the $61,600 level. If successful, the target moves to $66,800, with the potential to reclaim liquidity around the $68,500 to $70,000 area. This setup indicates a possible bullish momentum for Bitcoin in the near term
Headandshouldersformation

Head & Shoulder formation in Bandhan BankNSE:BANDHANBNK is forming Head & Shoulder on daily timeframe.
Possible target will be 245-246.

JUBLINGREA | SWING BUYAnalysis: JUBLINGREA shows strong uptrend potential with good technical
Entry: Can consider current price
Disclaimer: For informational purposes only. Do your research or consult a financial advisor.

AUTOMAKER ABOVE NECKLINE NOW.While all the auto stocks were moving, NSE:ATUL remained silent. Finally it is ready to move now. Trendline breakout strongly done, re-test complete and now heading for inverted H&S breakout. Once it breaks out, 7000+ levels will be there soon. One can expect some strong sales data as a trigger at the beginning of next month.

RATING COMPANY IS RE-RATING CANDIDATE.After reaching highs of 5000, NSE:CRISIL corrected well below 4000 levels but now forming inverted H&S pattern which will breakout at 4500 while another inverted H&S pattern on hourly is expected to take place. Stoploss at 3850.

RAIN is ready for Head & Shoulder breakoutNSE:RAIN is ready for Head & Shoulder breakout.
Possible target 220.

DEEPAKNTR | Multiple Pattern Breakout in Daily & weekly chartChart Analysis
1) Cup formation - weekly chart pattern
2) inverted head and shoulder formation - daily chart
3) Good EMA-20 support taken in daily chart
4) Good volume breakout as well

NITIN SPINNERS STOCKNSE:NITINSPIN Stock is likely to break out of an inverse head & shoulder pattern.
Buy sustain above 355 rupees.
Target 1 is 365 to 369 rupees.
Target 2 is 375 to 385 rupees.
Stoploss below 335 rupees (One Day Candle Closed).

IGL ready to run!Smaller inverted Head and Shoulder breakout done, retested and follow up move came. NSE:IGL is now ready for a bigger breakouts and further upmove in coming weeks.

JAYAGROGN - INVERSE HEAD AND SHOULDER PATTERN WITH STRONG VOL BOHi All,
This idea is related to Jayant Agro Organics Ltd
Fundamentals:
The Company is mainly engaged in manufacturing and trading of castor oil and its derivatives such as oleo chemicals.
Market Cap - 962 Cr
Stock P/E - 18
Book Value - 181
Promoter Holding - 67%
EPS - 17.6
Debt to Equity - 0.29
ROE - 10%
ROCE - 12.2%
Dividend Payout - 23%
Technicals:
This counter has shown all important characteristics of a perfect Inverse Head and Shoulder Pattern. Left Shoulder is deeper than right whereas the head is deepest. Volume price also concurs to the pattern that with every rise volume was low whereas each decline, the volume associated was high
Most importantly, during neckline breakout, the relative volume was very high which is the most important aspect to avoid false breakouts.
The stock price has advanced more than 3% from the neckline, cementing the continuation of the breakout
This is a weekly chart, so before taking the trade it is advisable to let price action be pulled back to nearest Moving average & then take a trade
If you like my analysis please comment and let me know your thoughts,
Happy Trading!
Thanks,
Stock-n-Shine

"Skyrocketing Success: The Rise of Shreecement"?Wait for the daily candle to close and retest.
A beautiful head and shoulder pattern with and increase in volume.
Plan of action -
Entry after retest - 26890-27000
Target 1- 28100
Target 2- 29000.
Disclaimer - education purpose.

TURNAROUND STOCK BREAKING OUT.Coupling news had hit this monopoly stock really bad but finally a head & shoulder breaking out after base formation. NSE:IEX is that beaten down stock whose price is hit badly but the finances are not that bad. Was overvalued earlier and still trading at 45+ P/E but that'sthe premium it deserves for being a monopoly stock.

LALPATHLAB [Head and Shoulders Pattern]A trendline has been drawn showing the expected bullish trend (green solid line), with an alternate path shown (blue dotted line) indicating potential short-term fluctuations before reaching the target.
1)Head and Shoulders Pattern:
Left Shoulder: Formed around June 2022.
Head: Formed around October 2022.
Right Shoulder: Formed around February 2024.
Neckline: The horizontal resistance line around the 2,800 level, which is crucial for confirming the pattern.
The stock has recently broken above the neckline (around 2,800), indicating a potential bullish reversal.
The target price is calculated by measuring the distance from the head to the neckline and projecting it upward from the breakout point.
The approximate target price, considering the height from the head (1,800) to the neckline (2,800), would be 2,800 + 1,000 = 3,800.
for MORE check in my TradingView ID
If You LIKE👌👌 MY Idea ..Boost.its please🔥🔥🔥.
"Disclosure : I am not Sebi-registered ." This channel is for only educational purpose. Any profit/loss, I am not responsible.
Before taking any trade on our charts / calls, please consult your financial advisors. Thanks

Andhra Petrochemicals - Inverted Head and Shoulder PatternAndhra Petrochemicals is a Monopolistic business, There is no plant like their, in Q4FY24 they gave a bumper results as well, along with Rs 2 Dividend (200% Dividend).
A nice inverted H&S has been created and breakout is round the corner above 106 levels.
Target is 170++
you can keep SL as 84 for the same.

pfc head and shoulderstock : pfc
trade : (cash and option)
buy@ 499 above
sl @ 466
target @ 600
note :
this information is for education only

TATACONSUM - Head and shoulders Pattern NSE:TATACONSUM Good #HNS Pattern Plan only Below Neckline Break and Closing Below the Support Trendline, This Pattern is a Rare Head and Shoulder Pattern Near ATH and Resistance Trendline

newgen stock : newgen
trade : long (cash segment)
buy @ 896 above
sl @ 797
target @ 1110
note :
this information is for education only

Vedant Breakout | Swing TradeHead and sholder pattern Breakout
Buy above 250
Sl 238
Note - Only for education purpose

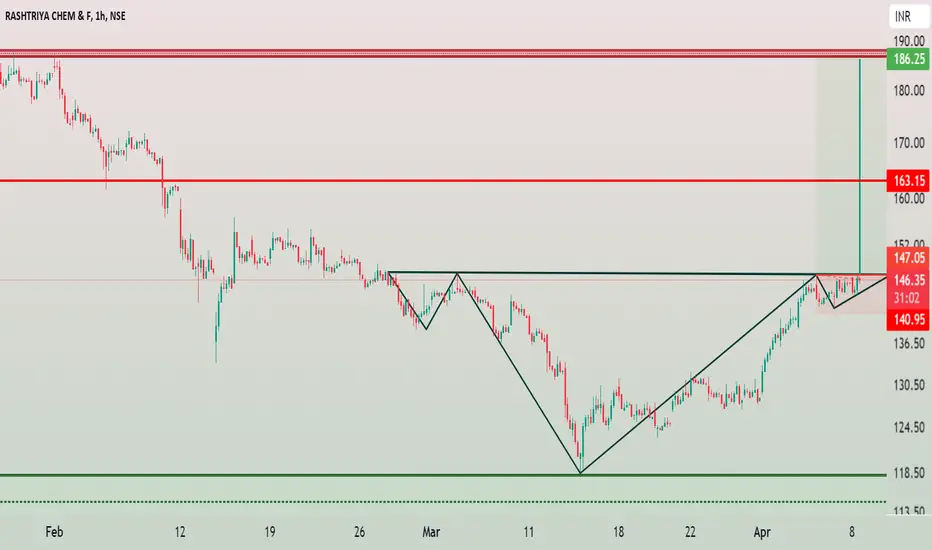
RCF - Head and Shoulder Chart PatternRashtriya Chemicals and Fertilizers Limited (RCF) has formed a bullish chart pattern called Head and Shoulder. Chart structure is bullish in every point of views like in a daily chart pattern you found RSI above 60 and also above 200 EMA is a very positive signal of uptrend.
Head is formed at very important zone which act as a resistance for than a decade almost (14 years). After successfully breakout of important resistance now price retest that level and formed strongest support zone with bullish piercing candlestick in daily timeframe. Change of Polarity, Prior resistance become support.
RCF buy above 148
Stop Loss below 142
Target 163 and 186
BITCOIN at Bullish & Bearish bumpy RidesAs per hourly pattern,
#BITCOIN still moving as in proper #HeadAndShoulders Pattern, and it completed almost 80-85% and if CRYPTOCAP:BTC will be completing this pattern properly then it will break out $75k-77k this time for next #NewATH around $80k approx.
Lets see,
where this Bumpy rides goes this time...
anyway, always #DYOR and Trade wisely by Using #StopLoss
and,
SHARE LIKE COMMENTS on every analysis always....

HEAD AND SHOULDERS PATTERN NECKLINE BREAKED IN HINDUSTAN PETROLHEAD AND SHOULDERS PATTERN BREAKED IN HINDUSTAN PETROL
You can see in the DAY chat Clearly showing a head and shoulders pattern
And it's entry point the neckline is also breaked
Meaning it's a goood opportunity for selling
For download side there is a good breakout occurred
It's clearly fall a lot in long-term
The target are also mentioned here
Tp 1 -382
Tp2- 320
Tp3- 264
And the entry point is. 480
Enjoy the opportunity
Stay connected

Tata Motors head and shoulder breakoutTata Motors inverse head and shoulder breakout on monthly tf
closing above 650 can lead to 830 and final 950+
risk reward ration will be 4.1
dc : only for educational and learning purpose

HDFCBANKI am not sure to work this chart pattern on 4H time frame .
first time i am share that type stock in my idea , that's reason i am not confidently say to buying stock to study purpose .
hdfc is one of the best stock of my banking list which give huge profit in short term or swing trading .
i share other time frame screen shot with us in below .
for MORE check in my TradingView ID
If You LIKE👌👌 MY Idea ......Boost.🔥🔥🔥.. its.
"Disclosure : I am not Sebi-registered." This channel is for only educational purpose. Any profit/loss, I am not responsible.
Before taking any trade on our charts / calls, please consult your financial advisors. Thanks🙏
