ATUL Trading Near Fresh Weekly Demand ZoneATUL is currently trading at ₹7175.1, positioned within its weekly demand zone between ₹7180 and ₹6773.75, identified on 26th July 2024. This fresh zone has not been tested, indicating potential buying interest at these levels. Investors might watch for support within this range, which could lead to
Next report date
—
Report period
—
EPS estimate
—
Revenue estimate
—
128.25 INR
3.23 B INR
46.83 B INR
14.61 M
About ATUL LTD
Sector
Headquarters
Valsad
Founded
1947
Website
ISIN
INE100A01010
FIGI
BBG000CNQ1X8
Atul Ltd. engages in the manufacture and marketing of chemical products. It operates through the following segments: Life Science Chemicals, Performance and Other Chemicals, and Others. The Life Science Chemicals segment consists of active pharmaceutical ingredients (API), API intermediates, fungicides, and herbicides. The Performance and Other Chemicals segment includes adhesion promoters, bulk chemicals, epoxy resins and hardeners, intermediates, perfumery, and textile dyes. The Others segment offers agribiotech, food products, and services. The company was founded by Kasturbhai Lalbhai on September 5, 1947 and is headquartered in Valsad, India.

ATUL .. liquidity sweepATUL made high near 8180..
Took the liquidity in 5 impulse wave 1-2-3-4-5
now doing abc correction expecting it to move below 7800
Disclaimer : I am not SEBI registered

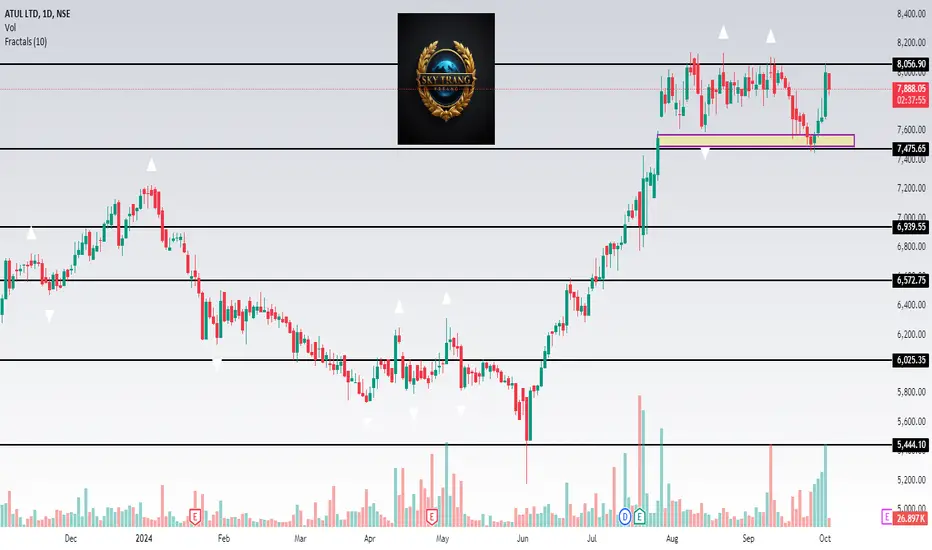
ATUL Stock is at resistance zone in daily and #ATUL
Stock is at resistance zone in daily and TF.Can see a good upmove above
the level. Keep on Radar.
Disclaimer :- All views are my personal and only for educational purpose.
#StockMarketindia
#LetsLearnTogether
ATUL Is Breaking Channel With Strong Candle Atul is attempting to break out of a long-term descending channel pattern. After showing a strong recovery from the lower trendline, the stock is now approaching the upper boundary of the channel around 8000 levels. A successful breakout above this level could lead to a significant uptrend with pote

SWING OPPORTUNITY IN ATUL AUTO"ATUL AUTO" is changing it's overall market structure on weekly timeframe and is getting ready to move upwards. The good thing about the stock is that price is consolidating within a range above the recent support level of 7590, which means buyers are accumulating the stock.
For entry, one must wai

Atul Consolidation after Breakout Now Ready to BreakoutNSE:ATUL Consolidating after Previous Breakout Now Ready to Breakout again if closed above 8136. Consistently Rising Volumes in the Past Few Days. Keep in Radar.
Check out my other stock ideas below until this trade gets activated, I would love your feedback.
Disclaimer: This analysis is inte

ATUL seems that it is going to see new high!!ATUL has shown strong bullish momentum, initially breaking above its resistance level. Despite a brief pullback, the stock has demonstrated resilience, suggesting that larger investors are accumulating shares. This positive price action indicates a high probability of ATUL reaching new all-time high

it will be in a range for some daysfinally it will fall up to marked line, so be careful before call future, try to take PUT trade

Atul Ltd Date 09.08.2024
Stock : Atul Ltd
Timeframe : Weekly
Remarks :
Definitely approaching strong resistance.
A combination of RSI & Resistance channel trendline.
Regards,
Ankur


See all ideas
An aggregate view of professional's ratings.
Displays a symbol's price movements over previous years to identify recurring trends.
Frequently Asked Questions
The current price of ATUL is 7,211.30 INR — it has decreased by −0.69% in the past 24 hours. Watch ATUL LTD stock price performance more closely on the chart.
Depending on the exchange, the stock ticker may vary. For instance, on NSE exchange ATUL LTD stocks are traded under the ticker ATUL.
ATUL stock has fallen by −2.48% compared to the previous week, the month change is a −2.55% fall, over the last year ATUL LTD has showed a 5.35% increase.
We've gathered analysts' opinions on ATUL LTD future price: according to them, ATUL price has a max estimate of 9,995.00 INR and a min estimate of 4,971.00 INR. Watch ATUL chart and read a more detailed ATUL LTD stock forecast: see what analysts think of ATUL LTD and suggest that you do with its stocks.
ATUL reached its all-time high on Oct 11, 2021 with the price of 10,969.00 INR, and its all-time low was 31.05 INR and was reached on Oct 27, 2008. View more price dynamics on ATUL chart.
See other stocks reaching their highest and lowest prices.
See other stocks reaching their highest and lowest prices.
ATUL stock is 3.30% volatile and has beta coefficient of 0.76. Track ATUL LTD stock price on the chart and check out the list of the most volatile stocks — is ATUL LTD there?
Today ATUL LTD has the market capitalization of 212.32 B, it has decreased by −1.56% over the last week.
Yes, you can track ATUL LTD financials in yearly and quarterly reports right on TradingView.
ATUL LTD is going to release the next earnings report on Jan 17, 2025. Keep track of upcoming events with our Earnings Calendar.
ATUL LTD revenue for the last quarter amounts to 13.93 B INR, despite the estimated figure of 13.89 B INR. In the next quarter, revenue is expected to reach 13.64 B INR.
ATUL net income for the last quarter is 1.37 B INR, while the quarter before that showed 1.12 B INR of net income which accounts for 22.28% change. Track more ATUL LTD financial stats to get the full picture.
Yes, ATUL dividends are paid annually. The last dividend per share was 20.00 INR. As of today, Dividend Yield (TTM)% is 0.28%. Tracking ATUL LTD dividends might help you take more informed decisions.
ATUL LTD dividend yield was 0.35% in 2023, and payout ratio reached 18.26%. The year before the numbers were 0.36% and 14.36% correspondingly. See high-dividend stocks and find more opportunities for your portfolio.
As of Dec 15, 2024, the company has 5.86 K employees. See our rating of the largest employees — is ATUL LTD on this list?
EBITDA measures a company's operating performance, its growth signifies an improvement in the efficiency of a company. ATUL LTD EBITDA is 7.65 B INR, and current EBITDA margin is 13.07%. See more stats in ATUL LTD financial statements.
Like other stocks, ATUL shares are traded on stock exchanges, e.g. Nasdaq, Nyse, Euronext, and the easiest way to buy them is through an online stock broker. To do this, you need to open an account and follow a broker's procedures, then start trading. You can trade ATUL LTD stock right from TradingView charts — choose your broker and connect to your account.
Investing in stocks requires a comprehensive research: you should carefully study all the available data, e.g. company's financials, related news, and its technical analysis. So ATUL LTD technincal analysis shows the sell today, and its 1 week rating is sell. Since market conditions are prone to changes, it's worth looking a bit further into the future — according to the 1 month rating ATUL LTD stock shows the buy signal. See more of ATUL LTD technicals for a more comprehensive analysis.
If you're still not sure, try looking for inspiration in our curated watchlists.
If you're still not sure, try looking for inspiration in our curated watchlists.