Secret Observations That Made Me a Better TraderDiscover the hidden market manipulation techniques institutional traders use to control price action, plus my observations, these secret patterns helps make you a better trader and get more observant using trading view tools and charts
Data used is 3 months old . This content is for educational and entertainment purposes only.
Higherlow

Potential Mega Breakout from Multi-Month ConsolidationTimeframe: Daily Chart | Analysis Type: Pure Price Action
🎯 Idea Summary
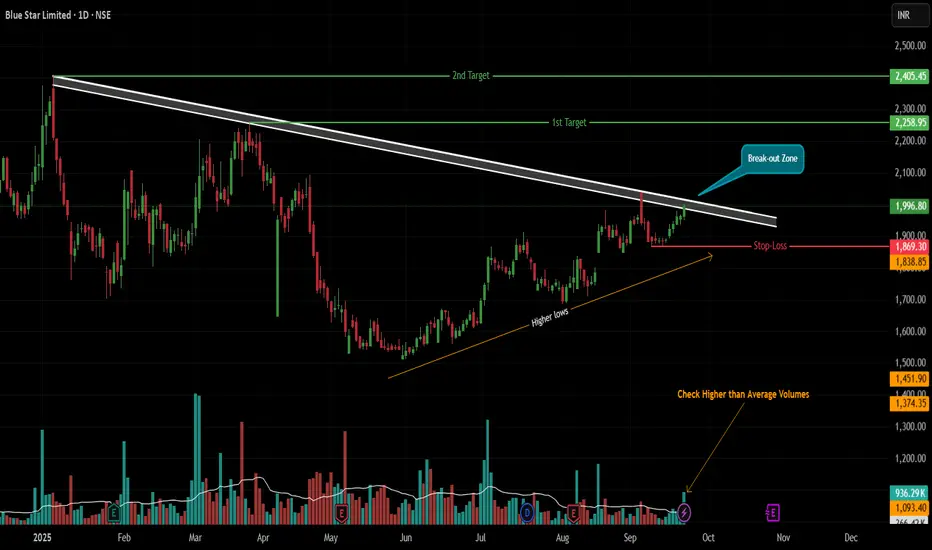
BLUESTAR is showcasing a textbook-perfect technical setup! A multi-month Descending Trendline resistance is converging with a bullish series of Higher Lows, forming a tight Volume Contraction Pattern (VCP). The stock is now squeezing at the apex, suggesting a powerful explosive move is on the horizon. A confirmed breakout could signal the start of a major bullish wave!
📊 Technical Rationale (Pure Price Action)
⚡ Major Descending Trendline (Resistance):
This key trendline originates from the swing high on 6th January 2025 📅.
It has been tested and respected as strong resistance on 25th March, 4th September, and 22nd September 2025. Each touch confirms the selling pressure. A breakout signifies a major trend reversal.
💪 Bullish Higher Lows & VCP (Strength):
Since 2nd June 2025, the stock has crafted a beautiful series of Higher Lows (HL) ↗️.
This shows buyers are aggressively defending higher levels, building a solid base for the next leg up. The contraction in price swings forms a Volume Contraction Pattern (VCP), indicating energy compression before a big expansion.
🧨 The Convergence (The Trigger):
Price is now knocking at the trendline resistance again. The coiling action is ultra-tight, suggesting a high-potential breakout is imminent!
⚖️ Trade Strategy
✅ Trigger for Entry: A BUY is triggered ONLY on a strong daily candle CLOSE ABOVE the descending trendline.
🔍 Confirmation Criteria (CRITICAL):
1) Volume: The breakout must be on VERY HIGH volume 📈. This is non-negotiable to confirm real buying interest and avoid fakeouts.
2) Candle Strength: The perfect signal is a thick, green Marubozu candle 🟢 (strong buying from open to close).
🛡️ Stop Loss (SL):
Aggressive: Low of the breakout candle.
Positional/Conservative: 1869 (The anchor of the HL structure).
🎯 Price Targets:
Target 1: 2258
Target 2: 2405
📌 Management: After T1, trail your stop loss to lock in profits on the way to T2.
⚠️ Key Considerations
⏳ Patience is a Virtue: Wait for the daily candle to CLOSE above the trendline. No premature entries!
🚫 False Breakout Risk: A weak close or low volume is a red flag. Stick to the rules.
✨ Pure Price Action: No lagging indicators. Just clean supply/demand analysis.
Disclaimer: This is an educational idea and not financial advice. Trading carries risk. Always do your own research and manage risk appropriately.
✨ Let me know if you spot the setup! Good luck and trade safe! ✨
Buy, Sell, or Skip? Multi Timeframe Support ZonesUncover how support levels across multiple timeframes help clarify key buy/sell decisions—purely for technical education.
Chart used is 3 months old for educational purposes only.

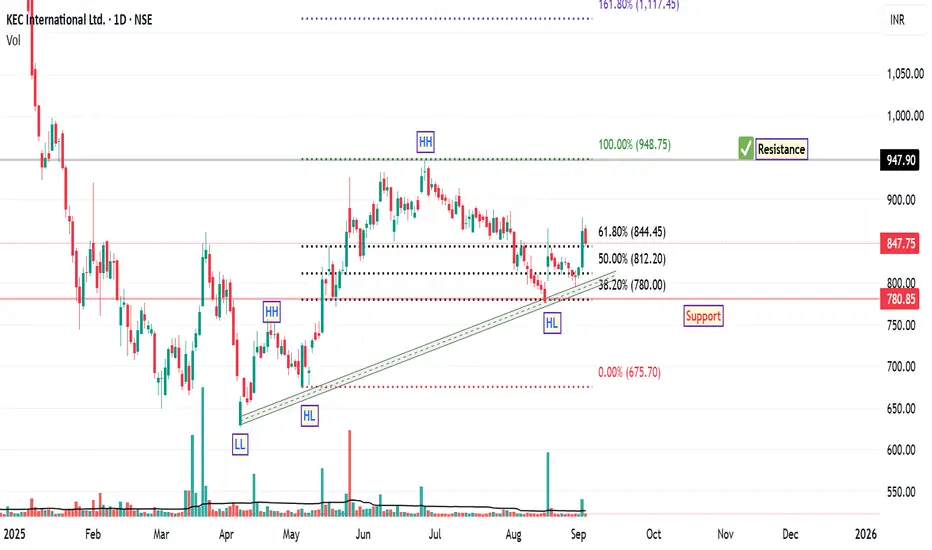
KEC International: Bullish Structure with StrengthSince April 7th, the price structure of KEC International has demonstrated a notable bullish trend reversal, characterized by the formation of higher highs and higher lows along an ascending trendline. This pattern is often interpreted by technical analysts as a sign of strengthening upward momentum.
A recent Fibonacci retracement, drawn from the swing low to the swing high of the current rally, revealed a pullback to the 38.2% level—a zone commonly viewed as a potential support area within a prevailing uptrend. The stock responded positively to this level, rebounding and subsequently closing above the 61.8% retracement level, which is another key technical threshold.
Interestingly, the price has retested the 61.8% level and held firm, suggesting that this area may be acting as a support base. Additionally, the stock has managed to close above its 200-day EMA, a long-term trend indicator that many market participants use to assess broader directional bias. A sustained position above the 200 EMA is generally considered constructive from a trend-following perspective.
From a structural standpoint, based on current chart dynamics, the next potential resistance zone appears to be near ₹948, while the suggested support level is around ₹780 . These levels are derived from historical price action and technical confluence zones, and may serve as reference points for monitoring future price behaviour.
Disclaimer: This analysis is intended solely for educational and informational purposes. It does not constitute investment advice or a recommendation to buy, sell, or hold any financial instrument. Market conditions are subject to change, and trading decisions should be made based on individual research, risk assessment, and consultation with a licensed financial advisor.
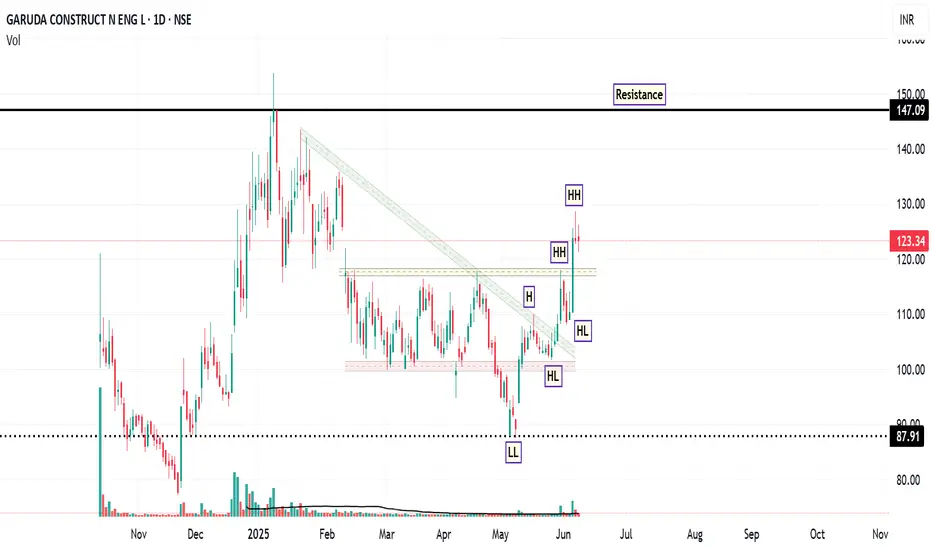
Garuda: Riding the Momentum WaveFrom February to late May 2025, the stock of GARUDA was trading in a sideways consolidation range, roughly between ₹100 (support) and ₹115-₹120 (resistance). The recent powerful green candles have shattered the upper boundary of this range. Also, the most significant event on the daily chart is the decisive breakout from a descending trendline that had capped prices. Also, LL and HH formation observed on daily chart.
The breakout was accompanied by a significant spike in volume ( 862.88K shares ), which is substantially higher than the average volume during the consolidation period. High volume on a breakout lends strong credibility to the move.
The RSI is at a strong 69.20 . It is in bullish territory and rising, indicating strong buying momentum. It is approaching the overbought region (>70), but is not there yet, leaving room for further upside before becoming extended.
If the stock consolidates above the ₹120-₹121 support level. Buyers step in on any minor dip till ₹118 , and the price then continues its upward trajectory towards the resistance targets of ₹129 and subsequently ₹149 .
Disclaimer: This technical analysis is for informational purposes only and should not be considered as financial advice. Trading in the stock market involves risk. Always conduct your own research and consult with a qualified financial advisor before making any investment decisions.
PEL: Perfect Cup & Handle Breakout That Could Double Your MoneyNSE:PEL : The Perfect Cup & Handle Breakout That Could Double Your Money? Let's Analyse
Price Action Analysis:
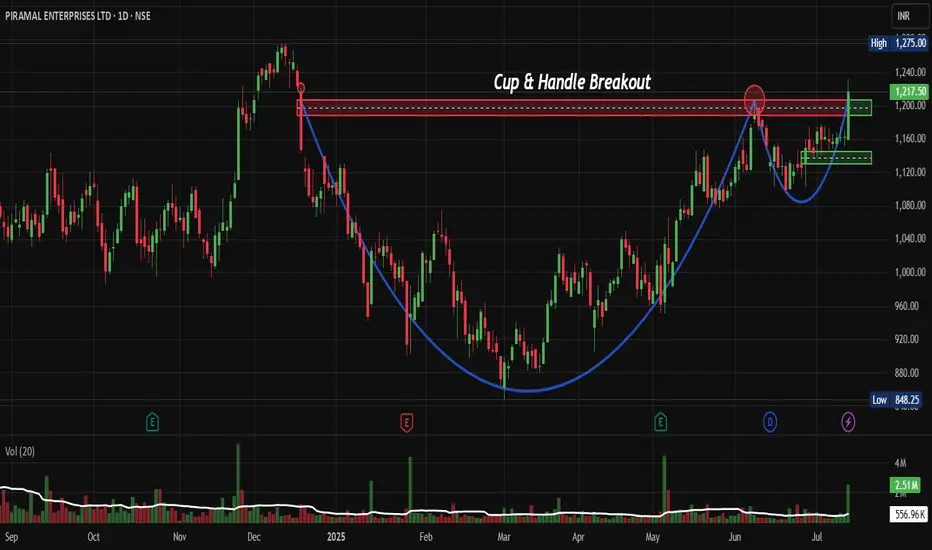
• Stock has formed a classic Cup & Handle pattern over approximately 8 months (Dec 2024 to July 2025)
• The "cup" formation shows a rounded bottom with the low around ₹850-900 levels in March 2025
• Current breakout above the handle resistance at ₹1,200 levels with strong momentum
• Price has surged from ₹1,158.70 to ₹1,217.50 with a healthy 4.69% gain on breakout day
• The handle formation shows controlled consolidation with lower volumes, indicating accumulation
Volume Spread Analysis:
• Volume spike of 2.51M shares on breakout day, significantly higher than the 20-day average
• During the cup formation, volume was relatively subdued, showing smart money accumulation
• The breakout volume of 556.96K is substantial, confirming the validity of the pattern
• Volume profile shows institutional participation during the base-building phase
Key Support and Resistance Levels:
• Primary Support: ₹1,150-1,160 (previous handle resistance now acting as support)
• Secondary Support: ₹1,100-1,120 (handle low)
• Major Support: ₹1,000-1,020 (cup rim level)
• Immediate Resistance: ₹1,240-1,250
• Major Resistance: ₹1,275 (all-time high)
• Target Resistance: ₹1,400-1,450 (measured move from cup depth)
Base Formation:
• 8-month base formation from Dec 2024 to July 2025
• Base depth: Approximately 35-40% from highs to lows
• Constructive base with multiple retests of support levels
• Base shows characteristics of institutional accumulation with controlled selling pressure
Technical Patterns:
Cup & Handle Pattern:
• Perfect textbook Cup & Handle formation with 8-month duration
• Cup depth of approximately ₹400 (from ₹1,240 to ₹850)
• Handle formed over 6-8 weeks with declining volume
• Breakout above ₹1,200 with expanding volume confirms pattern completion
• Measured target: ₹1,600+ (adding cup depth to breakout level)
Additional Patterns:
• Ascending triangle formation within the handle
• Multiple higher lows during the recovery phase
• Bullish flag pattern preceding the final breakout
• Volume price confirmation throughout the pattern development
Trade Setup:
Entry Strategy:
• Aggressive Entry: ₹1,210-1,220 (on breakout confirmation)
• Conservative Entry: ₹1,180-1,190 (on pullback to breakout level)
• Scale-in Entry: 50% at ₹1,210, 50% at ₹1,190 if pullback occurs
• Entry should be accompanied by volume expansion above 1.5x average
Exit Strategy:
• Target 1: ₹1,320-1,340 (8-10% upside)
• Target 2: ₹1,450-1,480 (20-25% upside)
• Target 3: ₹1,600-1,650 (pattern target, 35-40% upside)
• Partial profit booking at each target level (33% each)
Stop-Loss Management:
• Initial Stop-Loss: ₹1,150 (below handle support)
• Trailing Stop-Loss: Move to breakeven once Target 1 is achieved
• Progressive Stop-Loss: ₹1,250 after Target 1, ₹1,350 after Target 2
• Risk-Reward Ratio: 1:2.5 minimum for the trade setup
Risk Management:
Position Sizing:
• Maximum allocation: 3-5% of the portfolio for this single position
• Scale-in approach recommended for average entry price
• Avoid concentrating more than 10% in the financial services sector
• Consider correlation with other financial holdings
Risk Mitigation:
• Set alerts at key support and resistance levels
• Monitor volume patterns for any divergence signals
• Keep track of broader market sentiment and financial sector performance
• Regular review of stop-loss levels and profit booking strategy
• Avoid averaging down if the stop-loss is triggered
Sectoral Analysis:
Financial Services Sector Overview:
• NBFC sector showing signs of recovery post-COVID consolidation
• Regulatory environment becoming more favourable for established players
• Credit growth revival benefiting well-capitalized NBFCs
• Sector rotation from growth to value creates opportunities in the financial space
Sector Positioning:
• NSE:PEL is positioned in the diversified financial services space
• Benefits from real estate cycle recovery and pharma business stability
• Regulatory changes favouring larger, well-capitalized players
• Sector P/B multiples are still reasonable compared to historical averages
Fundamental Backdrop:
Company Overview:
• Diversified conglomerate with presence in financial services, pharmaceuticals, and real estate
• Strong balance sheet with improved asset quality metrics
• Management focuses on deleveraging and core business strengthening
• Strategic divestments are improving cash flows and reducing the debt burden
Past/Recent Developments:
• Successful completion of major asset sales improves the liquidity position
• Pharma business showing steady growth with new product launches
• Real estate segment benefiting from sector recovery
• Financial services arm gaining market share in target segments
Valuation Metrics:
• Trading at reasonable valuations compared to sector peers
• Improved return ratios and asset quality metrics
• Strong cash generation from core operations
• Debt reduction improving financial flexibility and credit ratings
Growth Catalysts:
• Real estate sector recovery driving housing finance growth
• Pharma business expansion in domestic and international markets
• Potential for higher ROE as leverage normalizes
• Market share gains in target financial services segments
My Take:
This technical setup in NSE:PEL presents a compelling risk-reward opportunity with the stock breaking out from a well-formed base pattern, supported by improving fundamentals and favourable sector dynamics.
Keep in the Watchlist.
NO RECO. For Buy/Sell.
📌Thank you for exploring my idea! I hope you found it valuable.
🙏FOLLOW for more
👍BOOST if you found it useful.
✍️COMMENT below with your views.
Meanwhile, check out my other stock ideas on the right side until this trade is activated. I would love your feedback.
Disclaimer: "I am not a SEBI REGISTERED RESEARCH ANALYST AND INVESTMENT ADVISER."
This analysis is intended solely for informational and educational purposes and should not be interpreted as financial advice. It is advisable to consult a qualified financial advisor or conduct thorough research before making investment decisions.
PLong
CANFINHOME - Higher Highs & Higher LowsCANFINHOME is making HH-HL formation.
Now giving breakout of resistance, moving above 20ema, RSI is also looking strong.
There is probability of an upside move, looks good above 759.
✅ If you like my analysis, please follow me as a token of appreciation :)
in.tradingview.com/u/SatpalS/
📌 For learning and educational purposes only, not a recommendation. Please consult your financial advisor before investing.

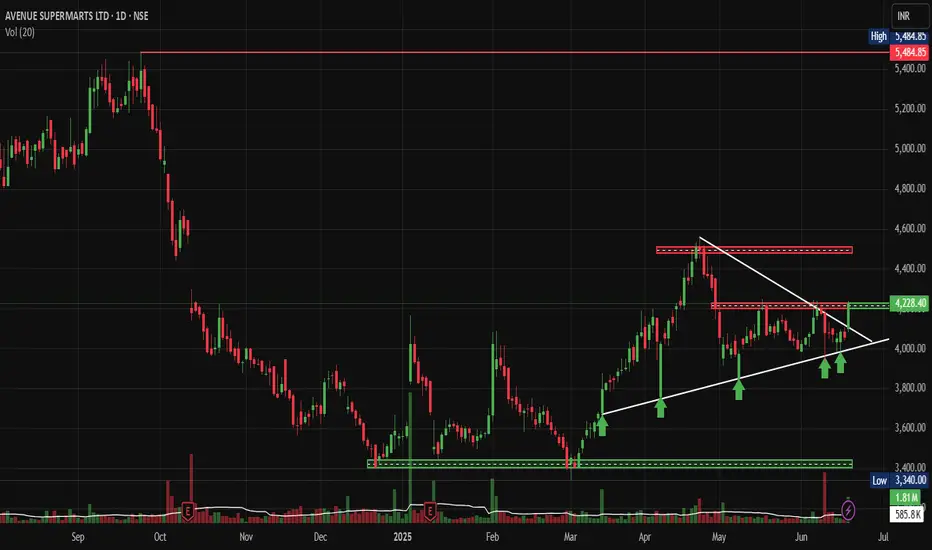
DMART: Technical Breakout Signals Major Rally AheadNSE:DMART Technical Breakout Signals Major Rally Ahead after news of its Entry in Uttar Pradesh as the First Store Opened in Agra.
Price Action:
• Current Price: ₹4,228.40 (up 4.17% or ₹169.30)
• 52-Week Range: ₹3,340 (Low) to ₹5,484.85 (High)
• Stock is trading in the upper half of its annual range, showing strong momentum
• Recent price action indicates a successful breakout from the consolidation phase
Volume Spread Analysis:
• Volume spike visible during recent breakout sessions
• Above-average volume of 585.8K shares traded, confirming institutional participation
• Volume pattern supports the bullish price movement
• Higher volume on green candles indicates genuine buying interest
Key Technical Levels:
Support Levels:
• Primary Support: ₹4,100-4,150 (recent breakout level)
• Secondary Support: ₹3,900-3,950 (previous resistance turned support)
• Major Support: ₹3,600-3,700 (demand zone from March-April consolidation)
• Critical Support: ₹3,400-3,450 (psychological level and volume-based support)
Resistance Levels:
• Immediate Resistance: ₹4,400-4,450 (supply zone marked on chart)
• Major Resistance: ₹4,600-4,700 (previous swing high area)
• Target Resistance: ₹5,200-5,300 (approaching 52-week high zone)
• Ultimate Target: ₹5,484 (52-week high)
Base Formation:
• Stock formed a strong accumulation base between December 2024 and April 2025
• Base depth: Approximately 25-30% from peak to trough
• Duration: A 5-month consolidation period indicates institutional accumulation
• Base breakout occurred with strong volume confirmation in May 2025
Technical Patterns:
• Cup and Handle formation visible from October 2024 to May 2025
• Ascending triangle pattern during the consolidation phase
• Higher lows formation indicating strong underlying demand
• Breakout from falling wedge pattern in early May 2025
Trend Analysis:
• Primary Trend: Bullish (upward sloping trendline from December lows)
• Intermediate Trend: Bullish breakout from consolidation
• Short-term Trend: Strong upward momentum with minor pullback potential
Trade Setup:
Bull Case Scenario:
• Entry Strategy: Buy on dips approach recommended
• Momentum continues toward ₹4,600-4,800 levels
• Volume expansion supports further upside
• Sector rotation favouring retail stocks
Entry Levels:
• Aggressive Entry: ₹4,200-4,250 (current market price area)
• Conservative Entry: ₹4,050-4,100 (on pullback to support)
• Ideal Entry: ₹4,000-4,050 (strong support retest)
Exit Levels:
• Partial Profit Booking: ₹4,500-4,600 (book 30-40% position)
• Second Target: ₹4,800-4,900 (book another 30-40%)
• Final Target: ₹5,200-5,300 (ride remaining 20-30% position)
Stop-Loss Strategy:
• Initial Stop-Loss: ₹3,950 (below recent support)
• Trailing Stop-Loss: Trail stops by ₹150-200 as price advances
• Final Stop-Loss: ₹3,800 (if major support breaks)
Risk Management:
Position Sizing:
• Conservative Allocation: 2-3% of total portfolio
• Moderate Allocation: 3-5% of total portfolio
• Aggressive Allocation: 5-7% of total portfolio (only for high-conviction traders)
Risk Factors:
• Market volatility during the quarterly results season
• Retail sector sensitivity to economic cycles
• High valuations may limit upside potential
• Profit booking pressure near previous highs
Risk Mitigation:
• Diversify across multiple retail stocks
• Use a staggered entry approach
• Maintain strict stop-loss discipline
• Monitor sector rotation trends
Sectoral Backdrop:
Retail Sector Overview:
• The Indian retail sector is following the "Everyday Low Cost - Everyday Low Price" strategy
• Strong, organised retail penetration growth expected
• Consumer spending recovery supporting sector growth
• E-commerce competition intensifying, but offline retail remains resilient
Sector Catalysts:
• Festival season approaching (positive for retail)
• Rural consumption recovery expected
• Urban consumption remains steady
• Government policies supporting organised retail
Fundamental Backdrop:
Company Overview:
• Avenue Supermarts follows a competitive procurement, operational efficiency, and cost-effective distribution strategy
• Market Cap: ₹2,75,237 Crores with almost debt-free status
• Leading hypermarket chain with strong brand presence
Financial Performance:
• Q4 FY25: Sales of ₹14,872 crore (16.9% YoY growth)
• Revenue projected to grow 15% to ₹68,000 to ₹70,000 crore
Business Strengths:
• Strong operational efficiency and supply chain management
• Consistent store expansion strategy
• High customer loyalty and repeat business
• Strong cash generation and a debt-free balance sheet
Growth Drivers:
• New store openings in Tier-2 and Tier-3 cities
• Same-store sales growth improvement
• Category expansion and private label growth
• Digital initiatives and omnichannel presence
My Take:
NSE:DMART presents a compelling technical setup with strong fundamental backing. The stock has successfully broken out from a 5-month consolidation base with volume confirmation. Risk-reward ratio favours bulls with proper position sizing and stop-loss management. Traders should consider entering on minor pullbacks, while investors can accumulate on any meaningful corrections toward support levels.
Keep in the Watchlist.
NO RECO. For Buy/Sell.
📌Thank you for exploring my idea! I hope you found it valuable.
🙏FOLLOW for more
👍BOOST if you found it useful.
✍️COMMENT below with your views.
Meanwhile, check out my other stock ideas on the right side until this trade is activated. I would love your feedback.
Disclaimer: "I am not a SEBI REGISTERED RESEARCH ANALYST AND INVESTMENT ADVISER."
This analysis is intended solely for informational and educational purposes and should not be interpreted as financial advice. It is advisable to consult a qualified financial advisor or conduct thorough research before making investment decisions.
Higher Highs Higher Lows - EICHERMOT📊 Script: EICHERMOT
📊 Sector: Automobile
📊 Industry: Automobiles - Motorcycles / Mopeds
Key highlights: 💡⚡
📈 Script is trading in Upward moving channel and forming Higher Highs Higher Lows on daily chart.
📈 One can go for Swing Trade.
⏱️ C.M.P 📑💰- 4941
🟢 Target 🎯🏆 - 5073
⚠️ Stoploss ☠️🚫 - 4808
⚠️ Important: Always maintain your Risk & Reward Ratio.
✅Like and follow to never miss a new idea!✅
Disclaimer: I am not SEBI Registered Advisor. My posts are purely for training and educational purposes.
Eat🍜 Sleep😴 TradingView📈 Repeat 🔁
Happy learning with trading. Cheers!🥂

BLACKROCK has entered this stock.World's largest asset management company, BLACKROCK has entered this stock. NSE:SWANENERGY is a player in shipbuilding sector. Stock has been forming higher lows and now getting ready for a breakout. Target - 1000+ should be there soon.

Higher Highs Higher Lows - Short Sell - VTL📊 Script: VTL
📊 Sector: Textiles
📊 Industry: Textiles - Cotton/Blended
Key highlights: 💡⚡
📈 Script is forming Higher Highs Higher Lows patterns on daily chart.
📈 We may see stock price at 422 on downwards.
📈 One can go for Short Swing Trade.
⏱️ C.M.P 📑💰- 438
🟢 Target 🎯🏆 - 422
⚠️ Important: Always maintain your Risk & Reward Ratio.
✅Like and follow to never miss a new idea!✅
Disclaimer: I am not SEBI Registered Advisor. My posts are purely for training and educational purposes.
Eat🍜 Sleep😴 TradingView📈 Repeat 🔁
Happy learning with trading. Cheers!🥂

NIFTY DAILY - 19/3/2024Nifty open with huge gap down and bear took control of it and made low of the day that is 21793 level.
Index has broke consolidation line and higher high higher low pattern.
Nifty has formed a big red body candle with upper and lower shadows.
Nifty has given closing below 22831 level which was its support level so, 21667 level will work as next support level and 21906 will work as resistance level.
Today’s Advance Decline ratio of NIFTY50
Advance - 9
Decline - 41
FII Buy + 1421.48 crore
DII Buy + 7449.48 crore.
⚠️ Important: Always maintain your Risk & Reward Ratio.
✅Like and follow to never miss a new idea!✅
Disclaimer: I am not SEBI Registered Advisor. My posts are purely for training and educational purposes.
Eat🍜 Sleep😴 TradingView📈 Repeat 🔁
Happy learning with trading. Cheers!🥂

Higher High Higher Lows - VARDHMAN ACRYLICS📊 Script: VARDHACRLC
📊 Sector: Textiles
📊 Industry: Textiles - Manmade
Key highlights: 💡⚡
📈 Script is trading at upper band of BB and giving breakout of it.
📈 MACD is giving crossover .
📈 Double Moving Averages giving crossover.
📈 Right now RSI is around 67.
📈 Script is making Higher High Higher Lows as shown in chart.
📈 One can go for Swing Trade.
⏱️ C.M.P 📑💰- 72
🟢 Target 🎯🏆 - 80
⚠️ Stoploss ☠️🚫 - 68
⚠️ Important: Always maintain your Risk & Reward Ratio.
✅Like and follow to never miss a new idea!✅
Disclaimer: I am not SEBI Registered Advisor. My posts are purely for training and educational purposes.
Eat🍜 Sleep😴 TradingView📈 Repeat 🔁
Happy learning with trading. Cheers!🥂

BLS - Bullish Swing ReversalNSE: BLS is closing with a bullish swing reversal candle supported with volumes.
Today's volumes and candlestick formation indicates strong demand and stock should move to previous swing highs in the coming days.
The stock has been moving along the horizontal support for the past few days which is indicating demand.
One can look for a 8% to 13% gain on deployed capital in this swing trade.
The view is to be discarded in the event of the stock breaking previous swing low.
#NSEindia #Trading #StockMarketindia #Tradingview #SwingTrade

SPARC | SWING TRADE | BULLISH MOMENTUMSPARC | SWING TRADE | BULLISH MOMENTUM
Below are the indicators of bullish momentum
1) Market Structure Breakout
2) Stock taking support of 20 EMA for past 2 weeks
3) Triangle Pattern Breakout
Note: This Analysis is only for educational purpose

Titagarh Wagons Ltd swing tradeTitagarh Wagons Ltd is close to breakout level on daily timeframe, candle closing above 358.20 can be considered as an opportunity for swing trade. Wait for daily candle closing above 358.20 and Stoploss will be the swing low (320).
ENTRY:AFTER BREAKOUT (358.20)
STOP LOSS:320
TARGET=1:2 OR 1:3

Be cautious in Nifty!Nifty has shown a steep upmove in the last one month breaking all the strong resistance without any major retracement.
Today, nifty crossed 18000 with a strong volume candle and has closed near a strong supply zone of 18100-18120 levels. Even Bank nifty has given a strong closing above 43000.
This breakout can be a signal for strong bullish uptrend to a new high or it can also be a strong bull trap.
Monday is a holiday for Indian market but not global market which is why I feel this breakout to be quite suspicious. Hopefully, we see a continuation of trend on Tuesday and not a gap down opening! Next Support for nifty is at 17780 levels

Is this down or not ?Hello everyone, Today i am back with a new stock Cera Sanitaryware as you can see here it is showing us a lower low and higher low, Friends as you can see it is also shifting down along with candlestick Targets near 5600, Thank you

Nifty - Weekly AnalysisNifty is still in Lower High Lower Low Formation on 1D Time Frame. 18200 is the Change in Polarity Area. Currently nifty is in tight range of 300 points.

BHEL ANALYSISBHEL is in good uptrend.
it is forming an ascending triangle pattern with higher lows which is good sign of an uptrend!
Long opportunities can be seen at the levels of 84-85 if this level breaks further upside can be seen in the stock!
do keep this stock in your watchlist
if the ascending triangle is broken on the downside trend is assumed to be reversed.

NVIDIA GREAT BUYING OPPORTUNITY!!Great chance for accumulating stakes in nvidia corp!!
as you can see from the chart the script is forming higher lows in 1hr time frame
it has also formed a bullish hammer today which is supported by strong volumes and RSI

ATUL AUTO, Will it be one of the best stock in coming rally ?Hello Everyone!
You may or may not have heard of this company but one thing I am sure of is that, if you you are not superrich you must have used its product (Google it🙂). Well anyway we only consider technicals here, and on chart it is looking quite strong, let's analyze it.
1. 7 year trendline breakout with volume(refer chart).
2. Higher low and higher high formation. If we look in monthly chart it has made bottom at 120 during Mar'20 crash, after that it moves up slowly
to test its last high but failed in doing so and fall down. One thing we can notice here is that during this fall it doesn't break its bottom and
consolidated which was giving some initial hints of strength (i.e., institutional buy), it consolidated at that place for some time and last month
it has given breakout with a huge gap up forming higher lows and higher highs.
3. Stock is at the area where it got rejected in mar'20, and is holding this level from last 21days w/o any sign of weakness.
4. Volume of the stock is considerably high after mar'20 crash but price has not moved anywhere giving indication of accumulation.
5. W- pattern with strong 2nd leg(refer chart).
6. Last point is the high RR ratio. Since with current entry SL will be below the strong candle of 24thOct'22 which is 8% and we are expecting
price to move to 700.
If you have any point in addition or against above points, do mention in comments.
Thanks!

How did I time my entry in SAIL?Well, many traders spotted the head and shoulder pattern, but it can be seen that stock didn't move much after the breakout but consolidated in a rising wedge for some days(which is generally a good sign).
Now, in the morning I was looking for an entry so after looking at the 1-hour time frame, I found a perfect triangle rising wedge pattern, so I was waiting for a 1-hour candle to close above the trend line. I took entry at 79 with half quantity and on the retest, I added my other half.
Entry, Target, and Stoploss are mentioned in the chart.
Thank you!
