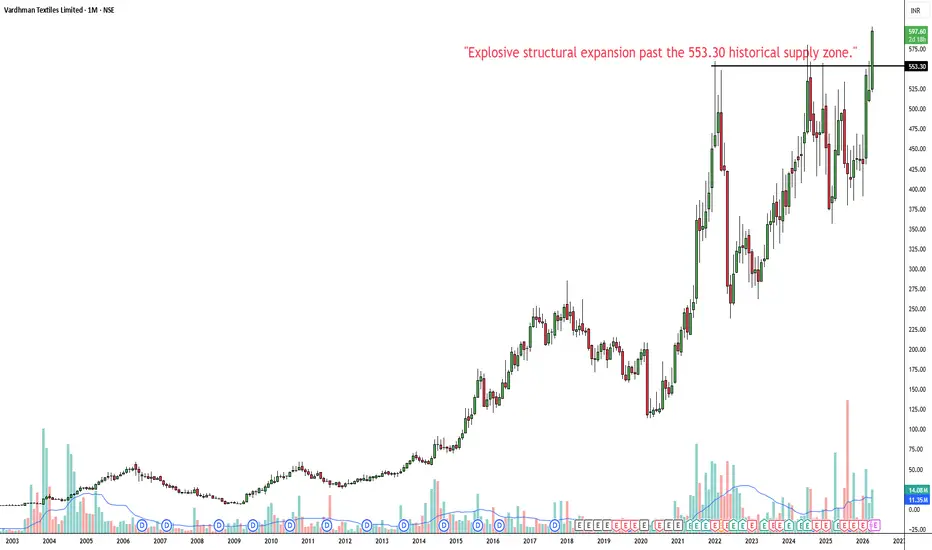
VTL: Explosive Macro Breakout From Multi-Year BaseThe Setup (Bias): I am taking a LONG bias on Vardhman Textiles Limited (VTL) on the macro monthly (1M) timeframe.
The "Why" (Technical Reasons): 1. Historic Structural Breakout: The price has forcefully broken out of a massive, multi-year consolidation phase (resembling a large cup and handle patte
Vardhman Textiles Limited
No trades
No trades
Compare with Vardhman Textiles Limited
29.50 INR
7.45 B INR
97.16 B INR
101.76 M
Next report date
—
Report period
—
EPS estimate
—
Revenue estimate
—
Company info
Sector
Industry
Website
Headquarters
Ludhiana
Founded
1965
IPO date
Jan 19, 1995
ISIN
INE825A01020
FIGI
BBG000CW10M9
Identifiers
ISIN INE825A01020
Vardhman Textiles Ltd. engages in the manufacture, purchase, and sale of textiles. Its products includes cotton yarn, synthetic yarn, woven fabric, sewing thread and acrylic fiber. The company was founded by Lala Rattan Chand Oswal in 1965 and is headquartered in Ludhiana, India.
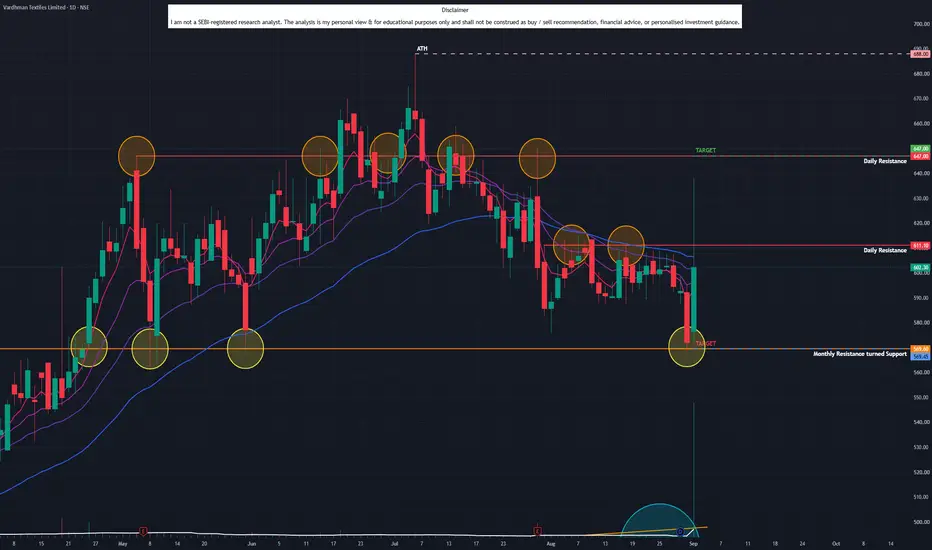
Vardhman Textiles (D): TREND REVERSAL ALERTTimeframe: Daily | Scale: Linear
Huge volume spike of 26.38M today, driving a +5.29% surge and challenging the recent downtrend! 🔥
Technical Highlights:
⚠️ Resistance Test: Pushed intraday above short-term horizontal resistance (active since Jul 31). Close pending.
✅ Trend Shift: Early
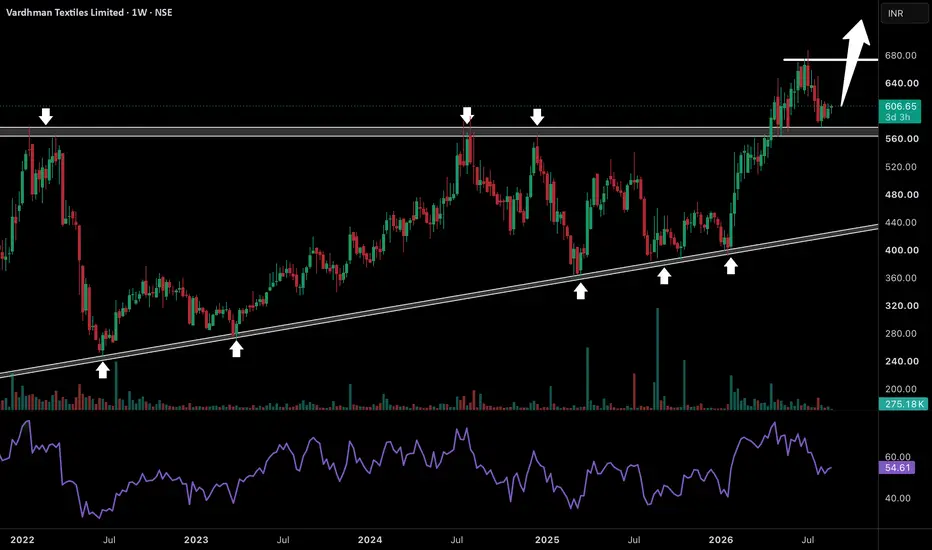
VARDHMAN TEXTILES — Bullish Compression Near Key BreakoutPrice is forming a strong ascending structure with consistent higher lows, showing that buyers are stepping in aggressively at every dip. The repeated tests of the 560–570 zone indicate that supply is getting absorbed, not defended — this is a classic sign of accumulation under resistance.
Momentum
Old Resistance Has Flipped — Buyers Are Defending It NowVardhman Textiles has finally broken above the 560–575 zone that rejected price multiple times since 2022. What makes this structure interesting is the series of higher lows from the rising trendline every major dip has been absorbed and buyers kept coming back stronger. After breaking this multi-ye
VTL Weekly BreakoutSubject: VTL Weekly Breakout 🚀 | Strong Momentum Above Key Resistance
Chart View: Weekly (NSE: VTL)
Vardhman Textiles has given a strong breakout above the crucial ₹590–₹600 resistance zone on the weekly timeframe. The stock has witnessed a sharp upward move and is sustaining above the breakout le
VTL: Stage 2 Continuation from 20-EMA SupportThe Core Thesis: Resilience Following All-Time Highs
Vardhman Textiles is exhibiting powerful Stage 2 momentum. After hitting its recent high, the stock underwent a healthy, shallow retracement to test the 20-day EMA. The immediate rejection of lower prices and the subsequent bounce confirm that in
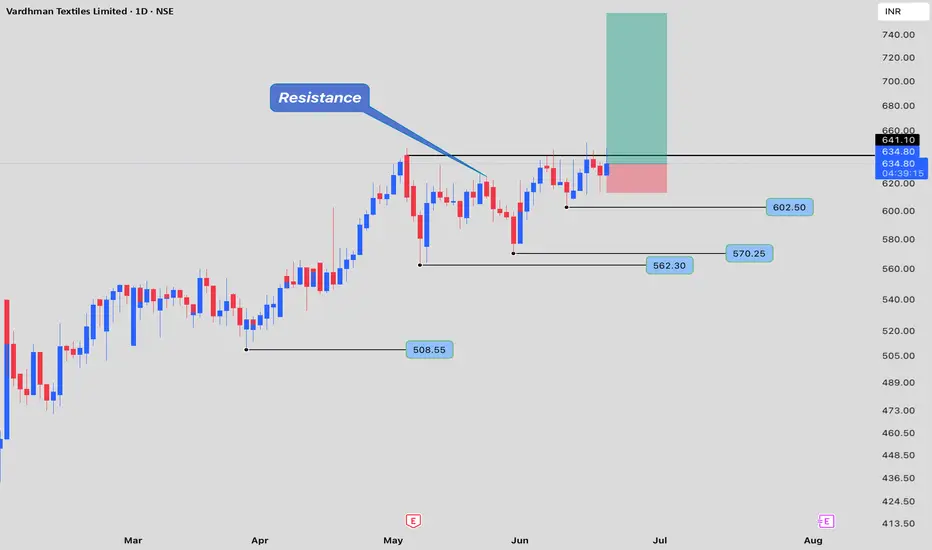
Game of Probability, nothing is certain...wanna play ?A solid closing above 600 is what is needed to confirm the price action and the probability of reaching 800 levels.
The consolidation (red circle) makes the case stronger for a good BO possibility.
The Stop loss has to be a strict closing basis one, below the Red (dash) line.
Remember, it can alway
See all ideas
Summarizing what the indicators are suggesting.
Neutral
Neutral
Neutral
An aggregate view of professional's ratings.
Neutral
Neutral
Neutral
Displays a symbol's price movements over previous years to identify recurring trends.
Frequently asked questions
The current price of VTL is 528.20 INR — it has increased by 0.16% in the past 24 hours. Watch Vardhman Textiles Limited stock price performance more closely on the chart.
Depending on the exchange, the stock ticker may vary. For instance, on NSE exchange Vardhman Textiles Limited stocks are traded under the ticker VTL.
VTL stock has fallen by −1.20% compared to the previous week, the month change is a −10.16% fall, over the last year Vardhman Textiles Limited has showed a 32.05% increase.
We've gathered analysts' opinions on Vardhman Textiles Limited future price: according to them, VTL price has a max estimate of 682.00 INR and a min estimate of 431.00 INR. Watch VTL chart and read a more detailed Vardhman Textiles Limited stock forecast: see what analysts think of Vardhman Textiles Limited and suggest that you do with its stocks.
VTL stock is 2.46% volatile and has beta coefficient of 0.52. Track Vardhman Textiles Limited stock price on the chart and check out the list of the most volatile stocks — is Vardhman Textiles Limited there?
Today Vardhman Textiles Limited has the market capitalization of 152.97 B, it has increased by 2.48% over the last week.
Yes, you can track Vardhman Textiles Limited financials in yearly and quarterly reports right on TradingView.
Vardhman Textiles Limited is going to release the next earnings report on Oct 23, 2026. Keep track of upcoming events with our Earnings Calendar.
VTL earnings for the last quarter are 10.90 INR per share, whereas the estimation was 14.30 INR resulting in a −23.78% surprise. The estimated earnings for the next quarter are 10.15 INR per share. See more details about Vardhman Textiles Limited earnings.
Vardhman Textiles Limited revenue for the last quarter amounts to 27.03 B INR, despite the estimated figure of 27.45 B INR. In the next quarter, revenue is expected to reach 28.12 B INR.
VTL net income for the last quarter is 3.10 B INR, while the quarter before that showed 1.85 B INR of net income which accounts for 0.00% change. Track more Vardhman Textiles Limited financial stats to get the full picture.
Yes, VTL dividends are paid annually. The last dividend per share was 5.00 INR. As of today, Dividend Yield (TTM)% is 0.95%. Tracking Vardhman Textiles Limited dividends might help you take more informed decisions.
Vardhman Textiles Limited dividend yield was 0.95% in 2025, and payout ratio reached 19.10%. The year before the numbers were 1.27% and 16.11% correspondingly. See high-dividend stocks and find more opportunities for your portfolio.
As of Oct 11, 2026, the company has 24.1 K employees. See our rating of the largest employees — is Vardhman Textiles Limited on this list?
EBITDA measures a company's operating performance, its growth signifies an improvement in the efficiency of a company. Vardhman Textiles Limited EBITDA is 13.87 B INR, and current EBITDA margin is 12.24%. See more stats in Vardhman Textiles Limited financial statements.
Like other stocks, VTL shares are traded on stock exchanges, e.g. Nasdaq, Nyse, Euronext, and the easiest way to buy them is through an online stock broker. To do this, you need to open an account and follow a broker's procedures, then start trading. You can trade Vardhman Textiles Limited stock right from TradingView charts — choose your broker and connect to your account.
Investing in stocks requires a comprehensive research: you should carefully study all the available data, e.g. company's financials, related news, and its technical analysis. So Vardhman Textiles Limited technincal analysis shows the strong sell today, and its 1 week rating is sell. Since market conditions are prone to changes, it's worth looking a bit further into the future — according to the 1 month rating Vardhman Textiles Limited stock shows the buy signal. See more of Vardhman Textiles Limited technicals for a more comprehensive analysis.