PGIL: Dual Flags and Asce. Triangle Breakout, Chart of the MonthFrom Dual Flags to Triangle Breakouts: How NSE:PGIL Spun a 10x Return Story While Tackling Global Tariff Headwinds and Posting Strong Q2 FY26 Numbers. Lets Analyse in Chart of the Month.
As per the Latest SEBI Mandate, this isn't a Trading/Investment RECOMMENDATION nor for Educational Purposes; it is just for Informational purposes only. The chart data used is 3 Months old, as Showing Live Chart Data is not allowed according to the New SEBI Mandate.
Disclaimer: "I am not a SEBI REGISTERED RESEARCH ANALYST AND INVESTMENT ADVISER."
This analysis is intended solely for informational purposes and should not be interpreted as financial advice. It is advisable to consult a qualified financial advisor or conduct thorough research before making investment decisions.
Price Action Analysis:
Long-Term Trend Structure (2022-2025):
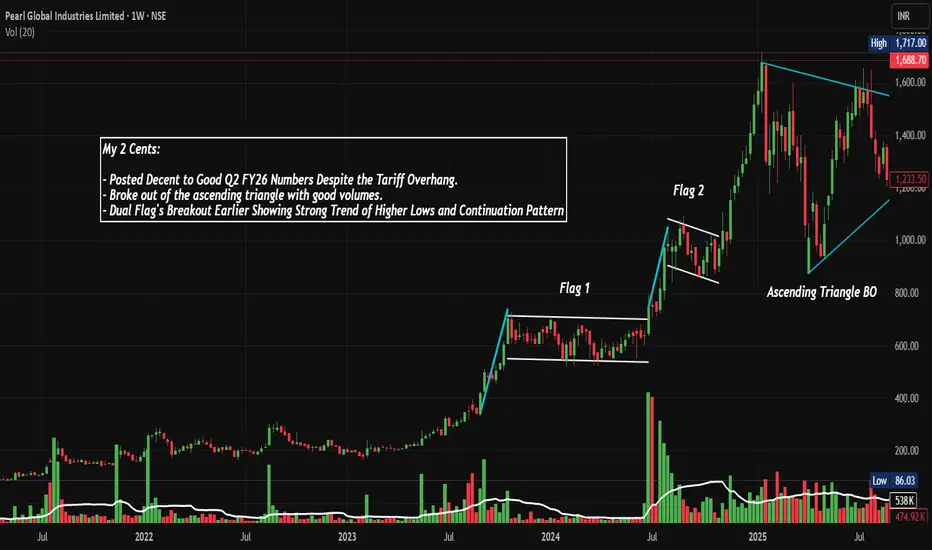
- The stock has demonstrated a phenomenal structural uptrend from its base near Rs 142 in early 2022, currently trading at Rs 1,688.70 (as of Nov 29, 2025)
- This represents an impressive gain of approximately 1,090% from its low, showcasing one of the most powerful trends in the apparel sector
- The weekly chart shows a consistent pattern of higher highs and higher lows, indicating strong bullish conviction and accumulation throughout the multi-year uptrend
Base Formation & Consolidation Zones:
- Primary Base (2022-2023): Stock formed a strong accumulation base between Rs 142-200 for nearly 12 months, which provided the launching pad for the subsequent rally
- First Consolidation Zone (Mid-2024): After the initial rally to around Rs 800, the stock consolidated between Rs 600-800 for approximately 5-6 months, forming Flag Pattern 1
- Second Consolidation Zone (2025): Following the breakout above Rs 1,000, another consolidation formed between Rs 1,200-1,600, creating Flag Pattern 2
Key Technical Patterns Identified:
Ascending Triangle Breakout (Current):
- The most recent pattern visible on the weekly chart is a well-defined ascending triangle with a flat resistance at Rs 1,600 and rising support trendline
- The breakout occurred with substantial volume above Rs 1,600, confirming the pattern's validity
- The breakout candle shows strong momentum with a nearly 20% move to Rs 1,688.70
Dual Bull Flag Patterns:
- Flag 1 (Mid-2024): The first consolidation after the initial rally formed a classic bull flag, which broke out strongly with volumes
- Flag 2 (Early-Mid 2025): Second flag pattern formed after another leg up, again breaking out with conviction
- Both flags demonstrated textbook continuation patterns, indicating strong underlying trend
Higher Lows Pattern:
- Throughout the entire uptrend from 2022, the stock has maintained a pristine pattern of higher swing lows
- Each pullback has been bought aggressively, indicating strong institutional accumulation
- The ascending trendline connecting these lows (cyan line on chart) has acted as dynamic support multiple times
Current Price Action Characteristics:
- Stock closed at Rs 1,688.70 on Nov 29, 2025, down Rs 53.30 (-3.06%) but still near its 52-week high of Rs 1,993.30
- The recent correction from the high represents a healthy pullback of approximately 15%, which is normal after such a massive rally
- Price is currently testing the upper boundary of the ascending triangle, which could now act as support
- The stock has shown tendency to gap up on positive news, indicating strong institutional interest
Volume Spread Analysis:
Volume Characteristics During Key Phases:
Accumulation Phase (2022-Early 2023):
- Average volumes during base formation were around 100K-200K shares
- Volume picked up noticeably during breakout attempts, showing institutional interest
Breakout Phases:
- Flag 1 Breakout: Volume spiked to approximately 300K+ during the breakout
- Flag 2 Breakout: Even higher volume expansion to 400K+ confirmed the breakout
- Ascending Triangle Breakout: Massive volume spike to 870.68K (current volume), the highest seen on the chart
Volume-Price Relationship:
- Classic volume expansion on price advances and contraction during pullbacks, confirming healthy trend
- The recent volume spike of 870.68K represents approximately 4-5x the average daily volume, indicating strong institutional participation
- Volume spikes have consistently occurred at breakout points, validating the technical patterns
- Current volume profile suggests continued institutional accumulation at higher levels
Volume Analysis of Recent Rally:
- The breakout above Rs 1,600 came with exceptional volume (870.68K), suggesting conviction behind the move
- Even during minor pullbacks, volume has remained above average, indicating that dips are being bought
- The volume signature suggests this is not a retail-driven rally but has strong institutional backing
Key Support and Resistance Levels:
Historical Support Zones:
- Primary Base Support: Rs 142-200 (2022 lows) - This is the ultimate support if the entire uptrend were to reverse
- First Major Support: Rs 600-700 zone - This was the previous consolidation area and breakout base
- Second Major Support: Rs 1,000-1,200 - Previous resistance turned support after Flag 2 breakout
- Immediate Support: Rs 1,400-1,500 - Lower boundary of the ascending triangle and recent consolidation
Dynamic Support:
- Ascending Trendline Support (Cyan Line): Currently around Rs 1,200-1,300 level
- This trendline has been respected multiple times since 2022 and represents the spine of the uptrend
Resistance Levels:
- Immediate Resistance: Rs 1,700-1,750 - Recent high zone before pullback
- Major Resistance: Rs 1,993.30 - 52-week high and all-time high
- Psychological Resistance: Rs 2,000 - Round number resistance
Key Price Zones to Watch:
Critical Zone Rs 1,400-1,600:
- This is the most critical support zone as it represents the breakout level from the ascending triangle
- A sustained break below Rs 1,400 would negate the current bullish setup
- As long as the stock holds above Rs 1,500, the structure remains intact
Breakout Zone Rs 1,600-1,700:
- This was the apex of the ascending triangle
- Now acts as a pivot zone - support on the way up, resistance on any further dips
Technical Pattern Analysis:
Ascending Triangle Pattern (Most Recent):
Pattern Characteristics:
- Formed over 6-7 months from mid-2024 to late 2025
- Flat top at Rs 1,600 and ascending bottom trendline
- Minimum of 3 touches on the flat resistance and 2 touches on the ascending support
- Breakout confirmed with massive volume spike
Bull Flag Patterns:
Flag 1 (Mid-2024):
- Pole: Vertical rally from Rs 400 to Rs 800 (100% gain)
- Flag: Consolidation between Rs 600-800 for 4-5 months
- Breakout: Strong move above Rs 800 with volume
- Target achievement: Target of Rs 1,000+ was achieved
Flag 2 (Early 2025):
- Pole: Rally from Rs 800 to Rs 1,200 (50% gain)
- Flag: Tight consolidation between Rs 1,100-1,300
- Breakout: Decisive move above Rs 1,300
- Target achievement: Target of Rs 1,500-1,600 was achieved
Higher Lows Progression:
- Each swing low since 2022 has been progressively higher, indicating sustained demand
- The lows have occurred at: ~Rs 150 (2022), ~Rs 400 (2023), ~Rs 650 (2024), ~Rs 1,200 (2025)
- This creates a powerful ascending trendline that has defined the entire bull market
- The consistency of this pattern suggests strong hands are accumulating on every dip
Continuation Pattern Sequence:
- The chart displays a textbook example of a trending market with continuation patterns
- Pattern sequence: Base → Rally → Flag 1 → Rally → Flag 2 → Rally → Triangle → Breakout
- Each consolidation has been briefer than the previous one, indicating acceleration of the trend
- The pattern suggests the stock is in a mature but still healthy uptrend
Technical Indicators & Market Context:
Trend Strength Assessment:
- The multi-year trend structure is exceptionally strong with clean, well-defined patterns
- The stock has demonstrated the ability to digest gains through healthy consolidations rather than sharp corrections
- The ascending trendline has not been violated once in nearly 3 years, showing remarkable consistency
- Momentum appears to be building rather than waning, as evidenced by the most recent volume spike
Stage of Trend Analysis:
Based on the Stan Weinstein Stage Analysis:
- The stock appears to be in Stage 2 (Advancing Phase) of the market cycle
- It has completed approximately 3-4 years of Stage 2, which can last 5-7 years in strong bull markets
- The pattern of consolidation and continuation suggests the trend is mature but not exhausted
- No signs of Stage 3 (Top Formation) yet, as there are no lower highs or distribution patterns
Sectoral Backdrop:
Indian Textile & Apparel Industry Overview:
Market Size and Growth:
- The domestic textile and apparel market is valued at $225 billion in 2025 and is growing at 10-12% CAGR
- The Indian textile and apparel market reached $222.08 billion in 2024 and is expected to reach $646.96 billion with a CAGR of 11.98% during 2025-2033
- The textile industry employs over 45 million people and produces approximately 22,000 million pieces of garments annually
Export Strength:
- India's textile exports currently stand at $35.14 billion with a target of reaching $100 billion by 2030
- In FY26 (April-June 2025), total exports of textiles and apparels stood at $9.40 billion, with Ready Made Garments having the largest share at 45%
- India ranks among the top five global exporters in several textile categories
Government Support & Policy Framework:
Key Initiatives:
- The government launched the PM MITRA Park Scheme with an outlay of Rs 4,445 crore to create integrated textiles value chain from spinning to manufacturing at a single location
- Union Budget 2025-26 increased allocation to the Textile Ministry from Rs 4,417.03 crore in 2024-25 to Rs 5,272 crore, registering a 19% increase
- Production-Linked Incentive (PLI) Scheme for promoting MMF fabrics and technical textiles
- A five-year Cotton Mission launched with an allocation of Rs 600 crore aimed at revitalizing India's cotton sector
Infrastructure Development:
- Government plans to set up 12 new industrial parks and 5-6 mega textile parks
- 276 operational Special Economic Zones (SEZs) across various textile sectors as of March 2025
- Technology Upgradation Fund Scheme (TUFS) providing financial assistance for modernization
Industry Trends & Opportunities:
Technological Advancement:
- Manufacturers are turning to automation, AI and IoT-connected machinery, and digital fabric printing to increase production
- Digital textile printing is growing over 10% annually, driven by e-commerce and fast fashion
- Smart textiles and technical textiles emerging as high-growth segments
E-commerce Boom:
- The e-commerce industry in India is estimated to reach close to $160 billion in 2025, with apparel/textiles constituting a large part
- Online platforms have opened market access for traditional textile players and D2C brands
- E-commerce has backed unique segments like athleisure, fusion wear, and sustainable fashion
Sustainability Focus:
- Growing demand for eco-friendly and sustainable textiles
- Adoption of organic cotton, recycled materials, and eco-friendly manufacturing processes
- Consumers increasingly conscious of environmental impact of textile production
Global Supply Chain Dynamics:
China+1 Strategy:
- Buyers are seeking alternatives to China and Bangladesh through changes in global supply chains
- Trade agreements like India-UK FTA opening new opportunities
- India positioned to capture increased global apparel sourcing demand
Market Diversification:
- Reduced dependence on single markets
- Growing demand from US, UK, Europe, Japan, and Australia
- Expansion opportunities in emerging markets
Fundamental Backdrop:
Business Overview:
Core Business:
- Pearl Global Industries is engaged in manufacturing, sourcing, distribution, and export of ready-to-wear apparel through domestic and global facilities
- The company provides end-to-end supply chain solutions to brands across the globe
- Product range includes tops, shirts, dresses, sleepwear, hoodies, activewear, athleisure, children's wear, workwear, and denim apparels
Global Manufacturing Footprint:
- Geographical segments include Bangladesh, Hong Kong, India, Vietnam, and Others
- The company is one of India's largest listed garment exporters, manufacturing from multiple sourcing regions: South Asia (India, Bangladesh), South-East Asia (Vietnam, Indonesia) and Central America (Guatemala)
- 25 manufacturing units with total annual production capacity of 93.2 million pieces
Key Clientele:
- Global clientele includes Chicos, Kohls, Muji, Old Navy, Poligono, Primark, PVH, Ralph Lauren, Target and other marquee names
- Serving global brands such as Gap, Zara, Muji and Ralph Lauren
Recent Financial Performance (Q2 FY26):
Revenue Growth:
- In Q2 FY26, the company reported revenue of Rs 1,313 crore, up 9.2% YoY
- In H1 FY26, revenue reached Rs 2,541 crore, marking a 12.7% YoY growth
- Revenue growth driven by high value-added product sales in Vietnam and Indonesia
Profitability Metrics:
- Adjusted EBITDA (excluding ESOP expenses) stood at Rs 122 crore, a 23.6% YoY rise in Q2 FY26
- EBITDA margin increased by 108 bps to 9.3%
- Excluding tariff costs/losses at Guatemala and Bihar, the EBITDA margin was 10.1%
- PAT increased 29.4% YoY to Rs 72 crore in Q2 FY26
Half-Year Performance:
- Adjusted EBITDA rose 18.4% YoY to Rs 236 crore in H1 FY26
- Profit After Tax grew 17% YoY to Rs 138 crore in H1 FY26
Operational Highlights:
Production Volumes:
- The company shipped 19.9 million pieces in Q2 FY26, its highest-ever Q2 shipment volume, up from 19.3 million pieces in Q2 FY25
- Current capacity at 93.6 million pieces annually with plans to exceed 100 million pieces by mid-FY27
Financial Strength:
- Cash and bank balance (excluding cash earmarked for LC payments) stood at Rs 416 crore, with an additional Rs 128 crore in mutual funds, totaling Rs 544 crore as on September 30, 2025
- Networth as on September 30, 2025 stood at Rs 1,271 crore compared to Rs 1,146 crore as on March 31, 2025
- Working capital days at 33 days, indicating efficient operations
- ROCE improved by 375 bps to 29% in H1 FY26
Shareholder Returns:
- Board declared first interim dividend of Rs 6 per equity share with a face value of Rs 5 each for FY26, representing a 20% payout ratio
Strategic Initiatives & Growth Drivers:
Geographical Diversification:
- The US now contributes approximately 50% of group revenue, down from 86% in FY21, reflecting a successful geographical diversification strategy
- The company has ramped up investments in India and Bangladesh and is executing a Rs 250-crore capex plan
- Investing Rs 250 crore in capacity expansion and sustainability initiatives across India and Bangladesh
Capacity Expansion:
- Plans include addition of up to 6 million pieces in Bangladesh and 3 million pieces in India
- Targeting additional capacity of 5-6 million pieces to drive efficiency improvements
Sustainability Leadership:
- The adoption of eFlow Nanobubble technology in Bangladesh has enabled a 32% reduction in water use, a 9% decrease in power consumption, and a 20% improvement in production time efficiency
- Focus on eco-friendly manufacturing and sustainable practices
Challenges & Risk Factors:
US Tariff Impact:
- The company is navigating trade complexities, including 50% US tariff on India
- US customers are asking for a 14-15% discount to mitigate the 25% penalty tariff
- Management stated they negotiate based on services provided and for some large customers are not giving any discounts
Volume Growth Moderation:
- Volume growth was moderate at 3% for H1 FY26, compared to 30% last year, partly due to macroeconomic factors and tariff impacts
New Facility Ramp-up:
- Tariff costs and losses from new facilities in Guatemala and Bihar impacting margins
- These are expected to normalize as facilities reach full capacity
Management Outlook & Guidance:
Management Commentary:
- Management expects normalization in US tariff situation in coming quarters and remains confident in ability to adapt swiftly to changing requirements
- With diversified customer base across US, UK, Japan and Australia, and ongoing discussions on new FTAs, company remains well positioned to capture increased demand
Growth Strategy:
- The company aims to diversify market base and is targeting Rs 6,000 crores revenue by 2028
- Focus on markets like Australia, Japan, and Europe
- Continuing to push where sustainable opportunities are seen
Operational Excellence:
- Growth led by sustained momentum in Vietnam and Indonesia, which delivered double-digit volume expansion
- Multi-hub production capabilities balancing scale with agility
Institutional Interest:
- Institutional holdings stand at 20.52%, reflecting confidence from investors with substantial analytical resources
- Stake has seen a slight increase, suggesting favorable outlook on company's fundamentals
Competitive Positioning:
Industry Standing:
- One of India's largest listed garment exporters
- Return on Capital Employed (ROCE) of 15.87% in recent quarters, indicating effective utilization of capital
- Strong relationships with marquee global brands providing stability
Differentiators:
- Multi-country manufacturing model providing flexibility
- End-to-end supply chain solutions
- Focus on value-added products and higher realizations
- Strong emphasis on sustainability and innovation
My 2 Cents:
Overall Technical Assessment:
Trend Status: BULLISH
- All major trend indicators point to a sustained uptrend
- Higher highs and higher lows pattern intact
- Multiple continuation patterns successfully completed
- No signs of trend exhaustion or distribution
Pattern Reliability: HIGH
- Clean, textbook patterns with volume confirmation
- Each pattern target achieved before next formation
- Consistency in pattern execution over 3 years
Current Phase: POST-BREAKOUT CONSOLIDATION
- Stock has broken out from ascending triangle
- Currently consolidating gains near all-time highs
Risk Factors to Monitor:
Technical Risks:
- Break below Rs 1,400 would signal trend weakening
- Sustained trading below ascending trendline (Rs 1,200-1,300) would be concerning
- Formation of lower high below Rs 1,900 would indicate potential trend change
- Excessive volume on down days compared to up days
Fundamental Risks:
- Escalation of US-India tariff tensions
- Significant margin compression due to competitive pressures
- Loss of major clients or market share
- Adverse changes in global trade policies
- Sharp appreciation of Indian Rupee affecting export competitiveness
Sector Risks:
- Global economic slowdown reducing apparel demand
- Competition from Bangladesh, Vietnam intensifying
- Raw material cost inflation impacting margins
- Disruptions in global supply chains
Rationale:
- Strong technical structure with multiple confirmed patterns
- Robust fundamental performance with consistent growth
- Well-positioned to benefit from sector tailwinds
- Successful geographical diversification strategy
- Strong balance sheet and cash generation
Avoid:
- Panic selling on minor dips if fundamentals remain intact
- Over-leverage given the stock's volatility
- Ignoring stop losses in case of trend reversal
- Chasing the stock at all-time highs without confirmation
Full Coverage on my Newsletter this Week
Keep in the Watchlist and DOYR.
NO RECO. For Buy/Sell.
📌Thank you for exploring my idea! I hope you found it valuable.
🙏FOLLOW for more
👍BOOST if you found it useful.
✍️COMMENT below with your views.
Meanwhile, check out my other stock ideas on the right side until this trade is activated. I would love your feedback.
As per the Latest SEBI Mandate, this isn't a Trading/Investment RECOMMENDATION nor for Educational Purposes; it is just for Informational purposes only. The chart data used is 3 Months old, as Showing Live Chart Data is not allowed according to the New SEBI Mandate.
Disclaimer: "I am not a SEBI REGISTERED RESEARCH ANALYST AND INVESTMENT ADVISER."
This analysis is intended solely for informational purposes and should not be interpreted as financial advice. It is advisable to consult a qualified financial advisor or conduct thorough research before making investment decisions.
Higherlows
AVANTIFEED: Breaking out of Sym. Triangle, Chart of the WeekNSE:AVANTIFEED Breaking the Triangle: How Avanti Feeds is Positioned to Ride the Shrimp Export Wave Despite US Tariff Headwinds after Posting Strong Q2 FY26 Numbers. Lets Analyse in Chart of the Week.
As per the Latest SEBI Mandate, this isn't a Trading/Investment RECOMMENDATION nor for Educational Purposes; it is just for Informational purposes only. The chart data used is 3 Months old, as Showing Live Chart Data is not allowed according to the New SEBI Mandate.
Disclaimer: "I am not a SEBI REGISTERED RESEARCH ANALYST AND INVESTMENT ADVISER."
This analysis is intended solely for informational purposes and should not be interpreted as financial advice. It is advisable to consult a qualified financial advisor or conduct thorough research before making investment decisions.
Price Action Analysis:
Historical Price Journey:
- 2021-2022: Strong rally from 360 levels to 750 zone
- 2023: Consolidation and correction to 350-400 range
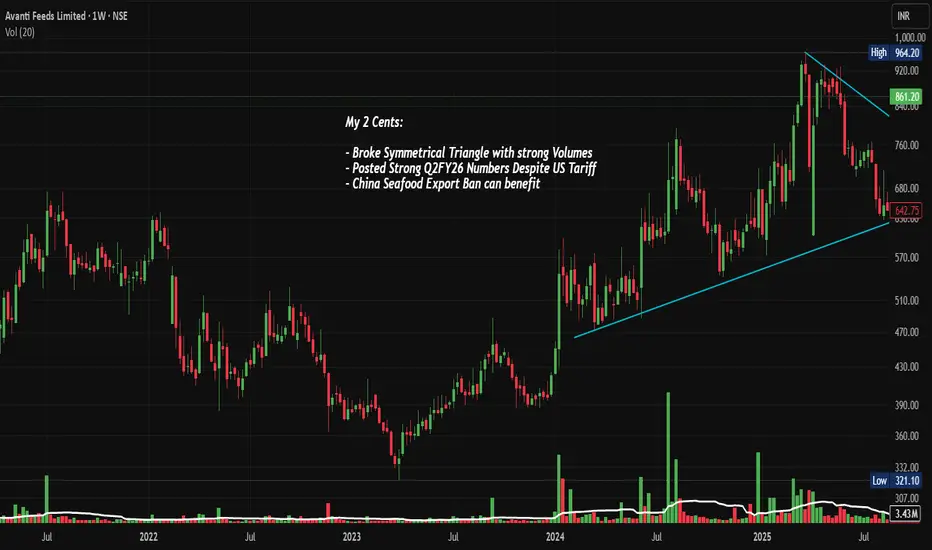
- 2024: Strong recovery rally pushing to new all-time highs near 964.20
- 2025: Symmetrical triangle consolidation followed by recent breakout
Current Price Behavior:
- Recent breakout candle shows strong buying with minimal upper wick
- Trading at 861.20 with +14.51% gain indicates momentum strength
- Price approaching previous resistance zones that could act as supply
Volume Spread Analysis:
Volume Characteristics:
- Recent breakout accompanied by 9x surge in volumes (19.86M vs average)
- Volume expansion during rally phases from 2023-2024 shows institutional accumulation
- Volume spikes at key support levels during consolidation indicate buying interest
- Current volume profile suggests smart money participation
Volume-Price Correlation:
- Strong positive correlation during uptrends (2023-2024 rally)
- Declining volume during consolidation phase typical of healthy correction
- Recent volume breakout confirms bullish sentiment reversal
Symmetrical Triangle Formation (2024-2025):
- The stock has been consolidating in a clear symmetrical triangle pattern since reaching its 52 Week high of 964.20 in early 2025
- Lower highs connecting from 964.20 level and higher lows forming from 630.00 support zone
- Triangle apex converging near current price levels, indicating an imminent breakout
- Pattern duration: approximately 12 months, suggesting significance of upcoming move
- Recent price action shows a breakout attempt with strong volume support
Broke Symmetrical Triangle with Strong Volumes:
- Current price at 861.20 (as of November 21, 2025) shows +14.51% gain with volume surge to 3.9M shares
- Volume expansion at 19.86M significantly exceeds average, validating breakout
- The breakout has occurred with conviction, supported by high trading activity
Key Technical Levels:
Support Zones:
- Primary Support: 680.00 - 700.00 (recent consolidation base)
- Secondary Support: 630.00 (lower triangle trendline)
- Critical Support: 570.00 (psychological and structural level)
- Ultimate Support: 470.00-510.00 (2024 demand zone)
Resistance Levels:
- Immediate Resistance: 860.00 (swing high zone)
- Major Resistance: 920.00 - 964.20 (all-time high region)
- If ATH breaks, next targets: 1,000.00 and 1,100.00
Base Formation:
- A strong base has been established between 630.00 to 760.00 through 2025
- Multiple retests of lower support levels throughout the year have strengthened the base
- Base duration of 10-12 months provides solid foundation for next leg up
Trend Analysis:
Long-term Trend (Weekly/Monthly):
- Primary uptrend intact despite year-long consolidation
- Price remains well above rising 200-week moving average
- Higher lows pattern from 2022 onwards indicates bullish structure
Medium-term Trend (Daily):
- Breaking out of consolidation range with strong momentum
- Upper triangle trendline resistance conquered
- Price action suggesting potential trend reversal from sideways to bullish
Short-term Momentum:
- Sharp upward move with strong candles indicating buying pressure
- Current momentum favors bulls with potential for continuation
Fundamental & Sectoral Backdrop:
Company Overview & Business Segments:
Core Business Operations:
- India's leading shrimp feed manufacturer with integrated operations
- Two primary divisions: Shrimp Feed Division and Shrimp Processing & Export Division
- Market capitalization: Rs 9,633 crores (approximately $1.15 billion)
- Strategic partnership with Thai Union Group (Thailand) - minority stake holder
Production Capacity & Scale:
- Annual shrimp feed manufacturing capacity: 775,000 metric tons (largest in India)
- Shrimp processing capacity: Producing 28,000 metric tons annually
- Multiple manufacturing facilities across coastal states
- Hatchery division with capacity of 600 million post-larvae
Recent Financial Performance:
Q2 FY26 Results (Quarter Ended September 2025):
- Consolidated Net Profit: Rs 153.29 crores (up 34.88% YoY, down 14.02% QoQ)
- Net Sales: Rs 1,609.69 crores (up 18.79% YoY, flat 0.21% QoQ)
- Operating Performance shows mixed signals with YoY growth but QoQ softness
- EPS: Rs 11.25 (vs Rs 8.34 in Q2 FY25)
H1 FY26 Performance (Six Months Ended September 2025):
- Total Income: Rs 3,316.11 crores (up 13.11% YoY)
- Net Profit: Rs 331.57 crores (up 37.09% YoY)
- EPS: Rs 24.34 (vs Rs 17.75 in H1 FY25)
- Strong first-half performance despite challenging conditions
Segment Performance Highlights:
- Shrimp Feed Division: Facing margin pressure from rising raw material costs (fishmeal, soybean meal)
- Shrimp Processing Division: 62% YoY growth in gross income for Q2 FY26, driven by diversification and favorable forex rates
- Profit Before Tax (PBT): Rs 227 crores in Q2, down 8.83% QoQ indicating margin compression
Key Financial Metrics & Valuation:
Profitability Ratios:
- Return on Equity (ROE): 18.88% - well above industry average
- Return on Capital Employed (ROCE): 65.44% - exceptional capital efficiency
- Operating Margin: Declining by 126 basis points QoQ in Q2 FY26
- Net Profit Margin: 10.5% (Q2 FY26)
Balance Sheet Strength:
- Debt-to-Equity Ratio: Negative -0.69 (debt-free, net cash position)
- Fortress balance sheet with zero debt burden
- Strong working capital position despite rising debtor turnover pressures
Valuation Metrics:
- Current P/E Ratio: 19x
- Price-to-Book Value: 3.90x (reasonable given high ROE)
- Dividend Yield: 1.05%
- Latest Dividend: Rs 9.00 per share (August 2025), payout ratio of 23.19%
Quality Indicators:
- Consistent dividend payer with conservative payout ratios
- High ROCE indicates superior capital allocation
- Zero leverage provides financial flexibility and risk cushion
Sectoral Landscape - Indian Aquaculture & Shrimp Industry:
Market Size & Growth Trajectory:
- Indian Shrimp Market: Valued at $9.2 billion in 2024, projected to reach $22.7 billion by 2033 (CAGR: 10.1%)
- Indian Shrimp Feed Market: $2.0 billion in 2024, expected to grow to $7.4 billion by 2033 (CAGR: 15.7%)
- India Aquafeed Market: $3.51 billion in 2024, projected at $6.40 billion by 2032 (CAGR: 7.8%)
- India ranks as second-largest shrimp producer and exporter globally after Ecuador
Production & Export Statistics:
- FY24 Seafood Exports: Rs 60,523.89 crores (1.78 million metric tons), up 2.67% in volume
- Frozen shrimp accounts for 66.12% of export earnings and 40.19% of export volume
- India shipped seafood worth approximately $7.4 billion last fiscal year
- Production volumes show resilience despite global headwinds
Key Export Markets (Traditional):
- United States: Largest market, historically accounting for 40-50% of exports
- China: Second-largest market with 451,000 MT ($1.38 billion)
- Japan: Third major destination
- Other significant markets: Vietnam, Thailand, EU (Belgium, Spain), Canada, UAE, Italy
Domestic Market Dynamics:
- 72.1% of Indian population (967 million individuals) include fish in their diet
- Growing domestic consumption driven by health awareness and rising incomes
- Shift toward value-added products (ready-to-cook, processed seafood)
Major Industry Challenges & Headwinds:
US Tariff Crisis:
- August 27, 2025: US imposed 50% reciprocal tariff on Indian shrimp imports (25% base + 25% penalty)
- Combined with existing duties: Anti-dumping (3.96%), Countervailing duty (5.77%)
- Total effective duty burden: 58.26% on Indian shrimp exports to US
- August 2025 impact: Indian shrimp exports to US collapsed 43% YoY to 16,495 MT
- Total Indian export volumes fell 9% YoY in August 2025
Cost Pressures:
- Rising raw material costs for feed production (fishmeal, soybean meal)
- Increasing labor and energy costs impacting margins
- Competition from Ecuador in US market, especially in headless shell-on segment
- Global oversupply situation causing price depression
Disease & Environmental Risks:
- Disease outbreaks remain persistent risk in aquaculture
- Climate change and water quality challenges
- Regulatory compliance and sustainability certification requirements
Emerging Opportunities & Positive Catalysts:
Posted Strong Q2FY26 Numbers Despite US Tariff:
- Despite 50% US tariff headwinds, company posted 34.88% YoY profit growth
- Revenue growth of 18.79% YoY demonstrates resilience
- Shrimp processing division grew 62% YoY, offsetting feed segment pressures
- Management successfully diversifying away from US market dependence
China Seafood Export Ban Can Benefit Indian Exporters:
- China banned all Japanese seafood imports (November 2025) amid diplomatic tensions
- This creates substantial market opportunity for Indian seafood exporters
- Indian companies can fill supply gap in massive Chinese market
- China already importing 12,190 MT from India in August 2025, up 33% YoY
- Market diversification reducing US dependency from 48% toward 30-35%
Government Support & Policy Initiatives:
- Union Budget 2025: Proposed 5% Basic Customs Duty on key feed production inputs (down from higher rates)
- Rs 4.5 lakh crore support package for export sectors including seafood
- Pradhan Mantri Matsya Sampada Yojana (PMMSY): Rs 2,352 crores allocated (56% increase)
- Department of Fisheries budget: Rs 2,616.44 crores (54% increase YoY)
- Government targeting $14 billion+ seafood exports by 2025
- Fishery Infrastructure Development Fund (FIDF) for modernization
Market Diversification Strategy:
- Companies actively expanding presence in EU, Middle East, Southeast Asia, Japan, South Korea
- Vietnam, Thailand, Canada becoming key alternative markets
- Development of value-added products commanding higher margins
- China emerging as third-largest market for Indian shrimp after US and Europe
Technology & Innovation Adoption:
- Advanced breeding techniques producing disease-resistant varieties
- Biofloc technology and Recirculating Aquaculture Systems (RAS) improving efficiency
- Precision feeding technologies enhancing feed conversion ratios
- Integration of probiotics and functional ingredients in feed formulations
- Cold chain infrastructure growing 15-30% annually
Product Portfolio Expansion:
- Avanti Feeds launched new pet food products receiving positive market acceptance
- Shift toward value-added products: cooked, breaded, marinated offerings
- Value-added exports up 27% year-to-date despite overall volume pressure
- Premium products targeting European and Asian markets
Structural Competitive Advantages:
- Zero-debt balance sheet provides flexibility during market disruptions
- Highest feed manufacturing capacity (775,000 MT) among Indian players
- Integrated operations from hatchery to processing create vertical synergies
- Strong R&D capabilities and partnerships (Thai Union Group)
- Established distribution networks and brand recognition
Ecuador Supply Disruptions:
- Ecuador facing energy rationing issues disrupting shrimp production
- May redirect global buyers toward Indian suppliers
- Potential to strengthen pricing power and market share gains
- Ecuador's challenges provide tactical advantage for Indian exporters
Sustainability Certifications & Premium Markets:
- Growing demand for certified sustainable seafood (BAP, ASC standards)
- Indian producers investing in traceability and quality systems
- Access to premium European markets requiring strict compliance
- Competitive advantage in environmentally-conscious consumer segments
Competitive Positioning:
Market Leadership:
- Avanti Feeds ranked #1 in Indian shrimp sector by production and revenue
- Feed manufacturing: 775,000 MT capacity (largest)
- Shrimp production: 28,000 MT annually
- Revenue: EUR 615 million (Rs 5,500+ crores) for FY 2022-23
Key Competitors:
- Devi Sea Foods: #2 ranked, EUR 391 million revenue, 52,000 MT shrimp production, 300,000 MT feed capacity
- Waterbase Limited: Major player with diversified operations
- Coastal Corporation: Expanding China presence, up 5% recently on China opportunity
- Apex Frozen Foods: Strong Q2 with positive earnings surprise
Industry Consolidation Trends:
- Top 19 players dominating production and processing
- Increasing entry of multinational companies through JVs
- Consolidation driven by scale requirements and technology investments
Risk Factors & Concerns:
Short-term Challenges:
- US tariff situation remains fluid; potential for escalation to full 50% or negotiation down to 15%
- Sequential margin compression (Q2 vs Q1) indicates near-term profitability pressure
- Raw material cost inflation continuing into FY26
- Working capital pressures with rising debtor turnover ratio
Medium-term Uncertainties:
- Global shrimp prices at lowest inflation-adjusted levels since 2020
- Industry growth stagnation: India's peak exports in 2021 (704,160 MT) not yet regained
- Competitive intensity from Ecuador, Vietnam, Thailand, Indonesia
- EU and other markets may also impose trade restrictions
Operational Risks:
- Disease outbreaks can rapidly impact production
- Water quality and environmental compliance requirements
- Climate-related risks (extreme weather, temperature variations)
- Forex volatility impacting export realizations
Strategic Concerns:
- Slower than expected market diversification progress
- Dependence on commodity shrimp prices
- Shift to Black Tiger (Monodon) from Vannamei faces adoption challenges
- Pet food venture in highly competitive market against established players like Mars
Bull Case Scenario:
Technical Setup:
- Clean breakout from year-long symmetrical triangle with high volume
- If momentum sustains, targets of 860, 920, and new highs above 1,000 are achievable
- Strong base formation provides downside support
Fundamental Strengths:
- China-Japan seafood ban creates immediate export opportunity
- Government support package and duty cuts improve cost structure
- Debt-free balance sheet provides safety margin
- Exceptional ROCE (65.44%) and ROE (18.88%) demonstrate operational excellence
- Valuation attractive at 16.26x P/E with 9.7% discount to industry
Growth Drivers:
- Shrimp feed market growing at 15.7% CAGR through 2033
- Market diversification reducing US exposure from 48% to 30-35%
- Value-added product strategy improving margins
- Capacity leadership position (775,000 MT feed) creates moat
Bear Case Scenario:
Technical Risks:
- Failure to hold above 700 support could trigger return to triangle
- Overhead resistance at 860-920 zone may cap upside
- Volume sustainability crucial; fading volumes could signal false breakout
Fundamental Concerns:
- Sequential profit decline (Q2 vs Q1) signals margin pressure
- US tariffs may worsen if no trade deal materialized
- Global shrimp prices at multi-year lows (inflation-adjusted)
- Raw material cost inflation squeezing feed margins
- Industry growth stagnation since 2021 peak
Structural Headwinds:
- Mature business with 5-year sales CAGR of only 7.5%
- Intense competition from Ecuador in key US market
- Working capital pressures building (deteriorating debtor turnover)
Key Monitorables:
Quarterly Metrics:
- Feed sales volumes and pricing trends
- Shrimp processing margins and export realizations
- Geographic revenue mix (US vs other markets)
- Raw material cost trends (fishmeal, soybean meal)
Market Developments:
- Progress on US-India trade negotiations (tariff reduction to 15%?)
- China market penetration success metrics
- Ecuador supply situation and competitive dynamics
- Government policy implementation and subsidy flows
Technical Levels:
- Sustenance above 700 crucial for bullish structure
- Volume patterns on approach to 860-920 resistance
- Any breakdown below 630 would be major warning sign
My 2 Cents:
The technical breakout from the symmetrical triangle, combined with the China-Japan seafood ban opportunity, creates an interesting risk-reward setup. The company has demonstrated resilience by posting strong YoY numbers despite the US tariff shock. However, the sequential margin compression and global shrimp price weakness remain concerns.
The debt-free balance sheet and exceptional capital efficiency metrics (65% ROCE) provide a strong safety cushion. Market diversification efforts are progressing, though slower than ideal. The 15.7% CAGR expected in the shrimp feed market through 2033 provides secular tailwinds.
From a technical perspective, the stock needs to sustain above 700 and break through 860 with volume to confirm the bullish breakout. The year-long consolidation provides a solid base, but overhead supply at 860-920 could test conviction.
So Avanti Feeds presents a compelling case of a fundamentally strong company navigating through short-term headwinds while benefiting from emerging opportunities. The technical breakout aligns with positive fundamental catalysts (China ban on Japan, government support), though execution challenges and margin pressures remain. The company's market leadership, zero-debt status, and superior returns metrics make it a quality play on India's growing aquaculture story.
Investors should monitor the sustainability of the technical breakout, progress on market diversification, and margin trajectory in coming quarters. The current setup offers an asymmetric opportunity with defined risk.
Full Coverage on my Newsletter this Week
Keep in the Watchlist and DOYR.
NO RECO. For Buy/Sell.
📌Thank you for exploring my idea! I hope you found it valuable.
🙏FOLLOW for more
👍BOOST if you found it useful.
✍️COMMENT below with your views.
Meanwhile, check out my other stock ideas on the right side until this trade is activated. I would love your feedback.
As per the Latest SEBI Mandate, this isn't a Trading/Investment RECOMMENDATION nor for Educational Purposes; it is just for Informational purposes only. The chart data used is 3 Months old, as Showing Live Chart Data is not allowed according to the New SEBI Mandate.
Disclaimer: "I am not a SEBI REGISTERED RESEARCH ANALYST AND INVESTMENT ADVISER."
This analysis is intended solely for informational purposes and should not be interpreted as financial advice. It is advisable to consult a qualified financial advisor or conduct thorough research before making investment decisions.
INDIGOPNTS: Trendline Breakout Post Q2FY26, Chart of the WeekWhy NSE:INDIGOPNTS Could Be Your Next Multi-Bagger: Breaking Out After a Brutal 60% Correction Post Good Q2 FY26 Numbers: Let's Analyze in Chart of The Week
As per the Latest SEBI Mandate, this isn't a Trading/Investment RECOMMENDATION nor for Educational Purposes; it is just for Informational purposes only. The chart data used is 3 Months old, as Showing Live Chart Data is not allowed according to the New SEBI Mandate.
Disclaimer: "I am not a SEBI REGISTERED RESEARCH ANALYST AND INVESTMENT ADVISER."
This analysis is intended solely for informational purposes and should not be interpreted as financial advice. It is advisable to consult a qualified financial advisor or conduct thorough research before making investment decisions.
Price Action Analysis:
Historical Price Movement:
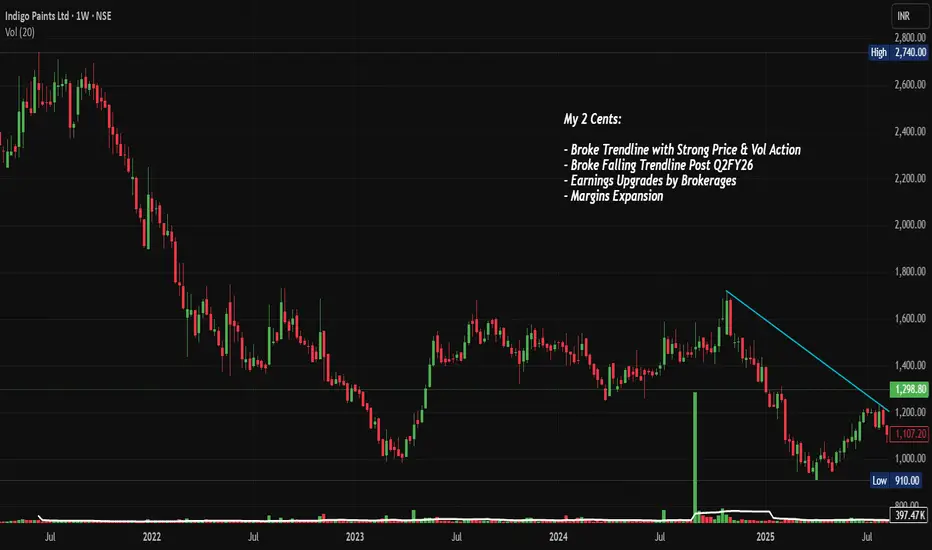
- The stock experienced a steep downtrend from its all-time high of approximately ₹2,695 in early 2022, declining over 60% to a low of ₹910 by mid-2024
- A prolonged bear market spanning nearly two years created a massive consolidation zone between ₹1,000 and ₹1,600 during 2023-2024
- Recent price action shows a strong bullish candle in November 2024, breaking above the downward trendline with significant momentum
- The current price of ₹1,298.80 represents a sharp recovery from the lows, gaining approximately ₹294.70, or 29.35%, in the recent move
Trendline Analysis:
- A clear falling trendline (marked in cyan on the chart) connected the lower highs from the 2022 peak through mid-2024
- This trendline acted as dynamic resistance, rejecting multiple rally attempts throughout 2023 and early 2024
- The recent breakout above this multi-year trendline occurred with strong price and volume confirmation, suggesting a potential trend reversal
- The breakout candle shows conviction with a decisive close above the trendline resistance
Price Structure:
- The stock formed a descending triangle pattern from 2022 to 2024, with lower highs and relatively flat lows around ₹900-₹1,000
- Post-Q2FY26 results (released in early November 2024), the stock has shown explosive upside momentum
- The recent surge created a bullish engulfing pattern on the weekly timeframe, signaling strong buyer interest
Volume Spread Analysis:
Volume Trends:
- Volume during the downtrend was relatively subdued, indicating lack of aggressive selling pressure
- The recent breakout candle shows significantly elevated volume at 7.67 million shares, representing 587.73 thousand volume units
- This volume spike confirms genuine buying interest and institutional participation in the breakout
- Volume expansion during the rally validates the authenticity of the price move
Volume-Price Relationship:
- The correlation between rising prices and expanding volume suggests healthy accumulation
- Previous attempts to break the trendline failed due to insufficient volume support
- Current volume levels are approximately 3-4x the average, indicating strong conviction among market participants
Key Technical Levels:
Support Levels:
- Primary Support (S1): ₹1,200—This represents the previous resistance zone that should now act as support
- Secondary Support (S2): ₹1,100 - The breakout point from the falling trendline
- Major Support (S3): ₹1,000-₹1,006 - Strong psychological level and previous consolidation base
- Ultimate Support (S4): ₹910 - The 52-week low acts as the ultimate floor
Resistance Levels:
- Immediate Resistance (R1): ₹1,400 - Near-term psychological barrier
- Intermediate Resistance (R2): ₹1,600 - Previous consolidation zone highs from 2023-2024
- Major Resistance (R3): ₹1,800 - Key supply zone from the downtrend phase
- Long-term Resistance (R4): ₹2,200-₹2,400 - Retracement levels toward the all-time high
Base Formation:
- A solid base has been established between ₹900 and ₹900-₹1,100 over an extended 18-month period
- This accumulation zone represents significant institutional buying at lower levels
- The base demonstrates strong hands holding the stock, reducing downside volatility
- Multiple tests of the ₹900-₹1,000 zone without breaking down confirms strong demand
Technical Patterns:
Reversal Patterns:
- A falling wedge/descending triangle pattern formed from 2022 to 2024, which is typically a bullish reversal pattern
- The pattern shows lower highs with relatively consistent lows, indicating selling exhaustion
- A breakout from this multi-year pattern suggests a major trend change is underway
Candlestick Patterns:
- The recent weekly candle shows strong bullish characteristics with a large body and minimal upper shadow
- The candle closed near its high, indicating buyer dominance throughout the period
- Previous candles show a transition from consolidation to expansion phase
Fundamental Backdrop:
Company Overview:
- Indigo Paints is India's fourth-largest decorative paints company with strong brand recognition
- The company operates three manufacturing facilities located in Jodhpur, Kochi, and Pudukkottai
- Headquartered in Pune, Maharashtra, the company was founded in 2000 and listed on stock exchanges in 2021
- Known for innovative product launches and being first-to-market with several differentiated paint solutions
Recent Financial Performance:
- Q2FY26 revenue grew 3.45% year-on-year to ₹298 Cr., though net income grew 5.85% to ₹26 Cr, due to competitive pressures
- Gross margins expanded to 45.1% from 44.1% in the previous year, driven by softening raw material costs and premium product focus
- EBITDA margin improved to 15.3% from 14.8%, reflecting operational efficiency gains
- The company has expanded its dealer network to over 18,900 active dealers and more than 11,650 tinting machines
Growth Catalysts:
- Management expects double-digit volume growth by Q4FY25, supported by strong leading indicators like dealer fund inflows and painter token scanning
- Extended monsoon impacted August sales, but July and September showed robust growth momentum
- The company is focusing on premium product mix to defend margins against aggressive competition from new entrants
- Expansion into project sales and construction chemicals segments provides new revenue streams
Sectoral Outlook:
Indian Paint Industry Overview:
- The Indian paints and coatings market is estimated at USD 10.46 billion in 2025 and expected to reach USD 16.38 billion by 2030, growing at 9.38% CAGR
- Architectural applications account for 77.56% of market demand in 2024, driven by India's construction boom
- The decorative segment accounts for nearly 75% of total demand, with 80% coming from repainting activity
- Repainting cycles have shortened from 7-8 years to just 4-5 years, accelerating demand growth
Competitive Landscape:
- New players like Birla Opus, JSW Paints, and Pidilite have entered with aggressive strategies and significant capital expenditure
- Birla Opus alone plans to increase industry capacity by 40% over the next three years, aiming to become the second-largest manufacturer by 2025
- Revenue growth slowed to 4% in FY24 after 14-15% CAGR between FY19 and FY23 due to price cuts and competitive pressures
- Despite margin pressure, established players like Indigo maintain advantage through distribution networks and brand loyalty
Industry Drivers:
- Residential unit sales surged 30% year-on-year to 474,000 units in 2024, supported by PM Awas Yojana affordable housing scheme
- The government plans to construct 30 million affordable houses over the next five years through PM Awas Yojana
- Rising disposable incomes, urbanization, and lifestyle changes are compressing repaint intervals in major cities
- Infrastructure projects under Bharatmala and Sagarmala are driving demand for industrial and protective coatings
Bull Case:
- A technical breakout from multi-year falling trendline with strong volume confirmation suggests major trend reversal
- Established player with differentiated product portfolio and strong gross margins outperforming peers
- Sector tailwinds from government infrastructure push and housing demand provide multi-year growth runway
- Valuation correction of 60% from peak creates attractive entry point for long-term wealth creation
- Management's focus on premium products and margin expansion positions company well against competition
Bear Case:
- Intense competition from well-capitalized new entrants (JSW, Birla Opus) could pressure market share
- Slower-than-expected volume growth in Q2FY26 raises concerns about demand momentum
- Margins vulnerable to aggressive pricing by competitors offering trade discounts
- An elongated monsoon and macroeconomic uncertainties could impact near-term performance
- Stock has rallied sharply in short period, creating potential for profit-booking
Key Monitoring Points:
- Track quarterly volume growth trajectory to confirm management's guidance of double-digit growth by Q4
- Monitor gross margin trends to ensure premium strategy is working despite competitive intensity
- Watch dealer expansion metrics and market share data versus new entrants
- Observe raw material price trends, particularly crude-linked derivatives impacting costs
- Follow infrastructure spending and housing sales data as leading indicators for industry demand
My 2 Cents:
- The stock has decisively broken out from a multi-Week falling trendline resistance with exceptional volume support
- Multiple technical factors align favorably: pattern breakout, volume confirmation, base formation, and momentum shift
- Risk-reward ratio remains attractive even after the recent rally, particularly on any pullback to ₹1,200 levels
- The base formation between ₹900 and ₹900-₹1,100 provides strong downside support for long-term holders
- While near-term earnings growth is muted due to competition, the long-term sector outlook remains robust
- The company's focus on operational efficiency and margin expansion is yielding results despite challenges
NSE:INDIGOPNTS presents a compelling asymmetric risk-reward opportunity where the technical setup, fundamental improvement trajectory, and sectoral tailwinds are aligning after a prolonged correction. The breakout from a multi-year base with strong volume support provides a high-conviction entry point for wealth creation over the next 12-24 months.
Full Coverage on my Newsletter this Week
Keep in the Watchlist and DOYR.
NO RECO. For Buy/Sell.
📌Thank you for exploring my idea! I hope you found it valuable.
🙏FOLLOW for more
👍BOOST if you found it useful.
✍️COMMENT below with your views.
Meanwhile, check out my other stock ideas on the right side until this trade is activated. I would love your feedback.
As per the Latest SEBI Mandate, this isn't a Trading/Investment RECOMMENDATION nor for Educational Purposes; it is just for Informational purposes only. The chart data used is 3 Months old, as Showing Live Chart Data is not allowed according to the New SEBI Mandate.
Disclaimer: "I am not a SEBI REGISTERED RESEARCH ANALYST AND INVESTMENT ADVISER."
This analysis is intended solely for informational purposes and should not be interpreted as financial advice. It is advisable to consult a qualified financial advisor or conduct thorough research before making investment decisions.
HINDUNILVR: Attempting Rising Wedge Breakout Post Q1 FY 26NSE:HINDUNILVR Attempting Rising Wedge Breakout: A Technical Revival Story Worth Watching Post Decent above Estimate Volume Growth and Q1 FY26 Results.
Price Action:
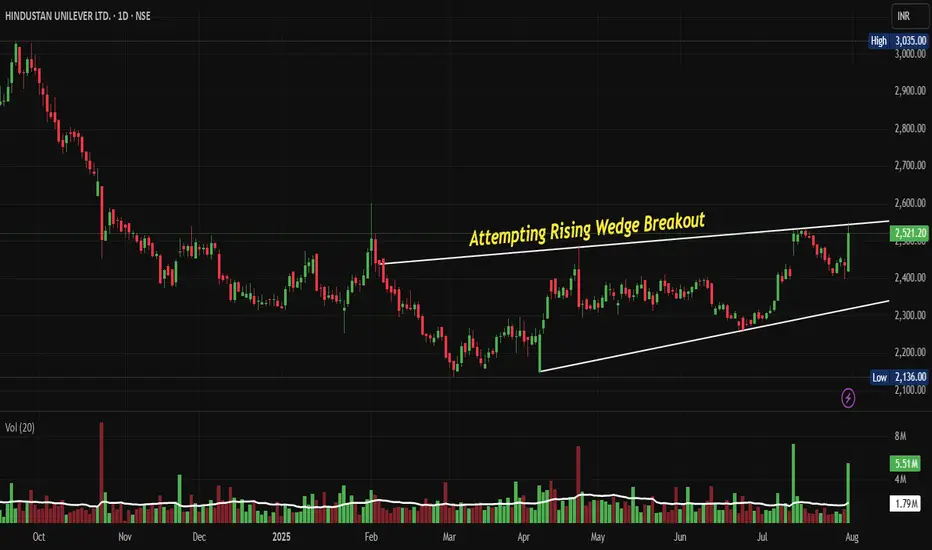
• Trading within a well-defined rising wedge pattern from February 2025 to July 2025
• The stock experienced a significant decline from its peak around ₹3,035 in September 2024 to a low of ₹2,136 in March 2025
• Currently trading at ₹2,521.20 with a gain of ₹83.80 (+3.44%)
• The stock appears to be attempting a breakout from the upper trendline of the rising wedge
Volume Spread Analysis:
• Volume has been relatively subdued during the consolidation phase within the wedge
• Recent sessions show increased volume activity with 5.51M shares traded, indicating renewed interest
• The volume pattern suggests accumulation during the lower levels of the wedge formation
• Volume spike accompanies the current breakout attempt, confirming the move
Key Technical Levels:
Key Support Levels:
• Immediate support: ₹2,420-₹2,450 (recent consolidation zone)
• Strong support: ₹2,300-₹2,350 (lower trendline of the rising wedge)
• Critical support: ₹2,136 (52-week low established in March 2025)
Resistance Levels:
• Immediate resistance: ₹2,550-₹2,580 (upper trendline breakout zone)
• Next resistance: ₹2,700-₹2,750 (previous swing highs)
• Major resistance: ₹3,035 (52-week high from September 2024)
Technical Patterns:
• Rising Wedge Pattern: A bearish reversal pattern that has been forming since Feb 2025
• Breakout Attempt: The stock is testing the upper boundary of the rising wedge with increased volume
• Higher Lows Formation: Despite the wedge pattern, the stock has been making higher lows since March 2025
Trade Setup:
Entry Strategy:
• Primary Entry: On sustained breakout above ₹2,550 with volume confirmation
• Secondary Entry: On pullback to ₹2,480-₹2,500 after successful breakout
• Aggressive Entry: Current levels around ₹2,520 for short-term traders
Exit Levels:
• Target 1: ₹2,680-₹2,700 (8-10% upside potential)
• Target 2: ₹2,850-₹2,900 (15-18% upside potential)
• Target 3: ₹3,000-₹3,050 (20-25% upside potential)
Stop-Loss Strategy:
• Conservative: ₹2,350 (below the rising wedge support)
• Moderate: ₹2,420 (below immediate support zone)
• Tight: ₹2,480 (for breakout trades)
Position Sizing:
• Conservative investors: 2-3% of portfolio allocation
• Moderate risk appetite: 4-5% of portfolio allocation
• Aggressive traders: 6-8% of portfolio allocation
Risk Management:
• Risk-Reward Ratio: Maintain a minimum 1:2 ratio for all entries
• Trailing Stop: Implement a 5-7% trailing stop after 10% gains
• Partial Profit Booking: Book 30% profits at Target 1, 40% at Target 2, and hold 30% for Target 3
Sectoral and Fundamental Backdrop:
FMCG Sector Overview:
• BSE FMCG index was up 1 per cent, as compared to a 0.5 per cent decline in the BSE Sensex
• The FMCG sector is showing resilience amid broader market volatility
• Rural demand recovery is expected to support sector growth in the coming quarters
Financial Performance:
• TTM Revenue: 63,928 Cr, TTM Profit: 10,827 Cr
• The company has delivered a poor sales growth of 10% over the past five years
• Annual revenue for March 2025 reached Rs 63,121 Crore, up 2%. Net profit rose 3.8% to Rs 10,671 Crore
Valuation Metrics:
• HUL's stock trades at a Price-to-Earnings (P/E) ratio around 55.70x, slightly below its historical averages (~61x over 5 years)
• Stock is trading at 12 times its book value
• Market Cap: 5,92,476 Crore (down -6.82% in 1 year)
Business Fundamentals:
• Promoter Holding: 61.9%
• Strong brand portfolio across multiple FMCG categories
• Extensive distribution network covering both urban and rural markets
• Urban markets contribute 60 per cent to HUL's sales, while rural markets comprise the rest
Recent Developments:
• Motilal Oswal analysts believe that volume growth for HUL has reached its lowest point and foresee a gradual recovery in volumes during FY25
• Brokerages tracked by Business Standard estimate HUL's net profit to decline 1.2 per cent year-on-year (Y-o-Y) on average, to ₹2,540.6 crore
• The company is expected to benefit from improving rural demand and premiumization trends
My Take:
• HUL remains a defensive play in the FMCG space with strong market positioning
• The technical breakout attempt coincides with expectations of volume recovery
• Long-term investors can consider accumulating on dips while traders can play the breakout momentum
Keep in the Watchlist and DOYR.
NO RECO. For Buy/Sell.
📌Thank you for exploring my idea! I hope you found it valuable.
🙏FOLLOW for more
👍BOOST if you found it useful.
✍️COMMENT below with your views.
Meanwhile, check out my other stock ideas on the right side until this trade is activated. I would love your feedback.
Disclaimer: "I am not a SEBI REGISTERED RESEARCH ANALYST AND INVESTMENT ADVISER."
This analysis is intended solely for informational and educational purposes and should not be interpreted as financial advice. It is advisable to consult a qualified financial advisor or conduct thorough research before making investment decisions.
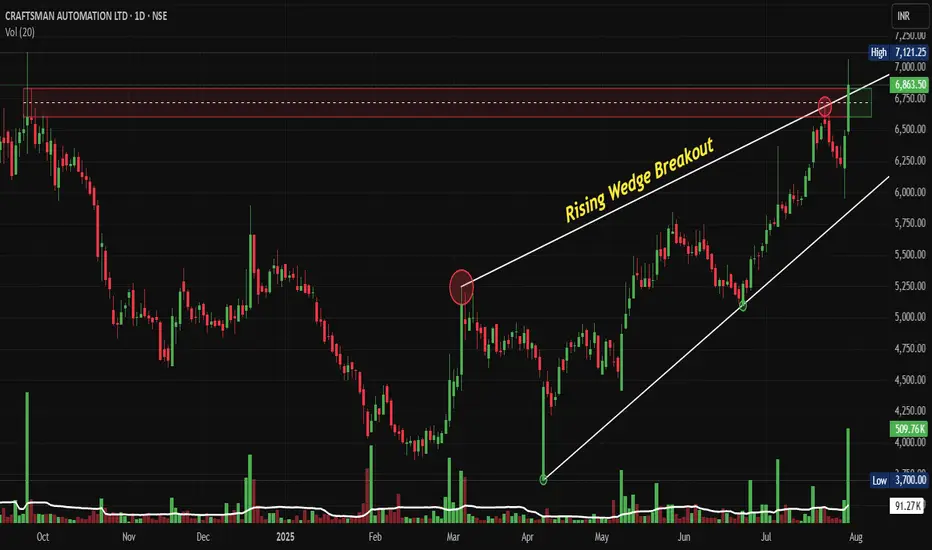
CRAFTSMAN: Rising Wedge Breakout Post Q1 FY26NSE:CRAFTSMAN Breaks Above Rising Wedge: A Bullish Technical Play Worth Watching Post Decent Q1 FY26 Results
Price Action Analysis:
Current Price Movement:
• Current Price: ₹6,863.50 (as of July 30, 2025)
• Day's Performance: +₹415.50 (+6.44%)
• Volume: 91.27K shares
• 52-Week Range: ₹3,700 - ₹7,121.25
Price Structure Analysis:
• Trend: Strong uptrend from March 2025 lows
• Higher Highs: Consistent formation since March 2025
• Higher Lows: Well-defined support levels during pullbacks
• Momentum: Acceleration post-breakout with gap-up opening
Volume Spread Analysis:
• Volume Patterns: Decreasing volume during the consolidation phase
• Breakout Volume: Significant surge indicating institutional participation
• Volume Profile: Above-average participation at key resistance levels
Key Price Levels:
• All-Time High: ₹7,121.25 (immediate target zone)
• Breakout Level: ₹6,500 (now acting as support)
• Previous Resistance: ₹6,200-6,300 (now support zone)
• Major Support: ₹5,800-6,000 (rising trendline confluence)
Base Formation:
• Primary Base: Extended consolidation between ₹4,800-6,500 from March to July 2025
• Duration: Approximately 4 months
• Depth: Shallow correction of 15-20% from previous highs
• Character: Healthy sideways movement with diminishing volatility
Key Support and Resistance Levels:
• Major Resistance: ₹7,121.25 (all-time high)
• Immediate Resistance: ₹6,900-7,000 zone
• Strong Support: ₹6,500 (breakout level)
• Major Support: ₹5,800-6,000 (rising wedge upper trendline)
• Critical Support: ₹5,200-5,300 (previous consolidation zone)
Technical Pattern:
Rising Wedge Breakout:
• Pattern: Bullish breakout from a rising wedge formation
• Formation Period: March 2025 to July 2025
• Breakout Level: ₹6,500 approximately
• Volume Confirmation: Strong volume spike on breakout day
Trade Setup:
Entry Strategy:
• Primary Entry: ₹6,850-6,900 (current levels on any minor dip)
• Aggressive Entry: ₹6,800-6,850 (immediate entry)
• Conservative Entry: ₹6,650-6,700 (on pullback to breakout level)
Target Levels:
• Target 1: ₹7,200-7,300 (immediate resistance zone)
• Target 2: ₹7,800-8,000 (measured move target)
• Target 3: ₹8,500-9,000 (cup and handle projection)
Stop-Loss Levels:
• Aggressive Stop: ₹6,400 (below breakout level)
• Conservative Stop: ₹6,200 (below rising wedge support)
• Trailing Stop: Move to breakeven once Target 1 is achieved
Position Sizing:
• Risk per trade: Maximum 2% of portfolio
• Position size calculation based on stop-loss distance
• For ₹6,850 entry with ₹6,400 stop: Risk = ₹450 per share
• Recommended allocation: 1-2% of equity portfolio
Risk Management:
Risk Factors:
• Market-wide correction could drag the stock down
• Sector rotation out of engineering/auto components
• Profit booking at all-time high levels
• Global economic headwinds affecting the auto sector
Risk Mitigation:
• Strict stop-loss adherence
• Partial profit booking at each target level
• Position size limiting to manage portfolio risk
• Monitoring broader market sentiment
Exit Strategy:
• Book 30% profits at Target 1
• Book another 40% at Target 2
• Trail remaining 30% with rising stop-loss
Sectoral and Fundamental Backdrop:
Business Overview:
• Diversified engineering company with vertically integrated manufacturing
• Three main segments: Automotive Powertrain (51%), Aluminium Products (21%), Industrial & Engineering (28%)
• Market capitalization: ₹16,357 crores
• Revenue: ₹6,323 crores with profit of ₹211 crores (TTM)
Recent Financial Performance(Q1 FY26):
• Q1 FY26 results: Revenue of ₹1,784 crores, profit of ₹70 crores
• PAT growth: 31% YoY in Q1 FY26
• Segment performance: Aluminium Products revenue up 102.82% YoY
• Powertrain revenue: ₹496.41 crores (up 19.23% YoY)
Sector Dynamics:
• Automotive sector recovery post-pandemic
• Increasing adoption of aluminium components for weight reduction
• Growing demand for powertrain components in commercial vehicles
• Beneficiary of the Make in India initiative
Key Clients and Market Position:
• Supplies to tier 1 OEMs including Tata Motors, Cummins, M&M, Royal Enfield
• Strong presence in commercial vehicles, two-wheelers, and tractor segments
• Established player in aluminium die-casting and machining
Growth Drivers:
• Capacity utilization improvements
• Focus on higher-margin aluminium products
• Expansion in industrial and engineering segments
• Increasing content per vehicle trends
Analyst Outlook after Q1 FY26:
• Average 1-year price target: ₹5,754 (though this appears conservative given current price)
• Price target range: ₹4,318 to ₹8,085
• Positive sentiment on aluminium business growth
• Capex guidance of ₹100-120 crores annually for maintenance and debottlenecking
My Take:
The technical setup for NSE:CRAFTSMAN presents a compelling bullish case with the successful breakout from a rising wedge pattern, supported by strong volume and a healthy fundamental backdrop. The stock is well-positioned to test new highs, though traders should remain disciplined with risk management given the proximity to all-time high levels. The diversified business model and strong sectoral tailwinds provide fundamental support to the technical breakout.
Keep in the Watchlist and DOYR.
NO RECO. For Buy/Sell.
📌Thank you for exploring my idea! I hope you found it valuable.
🙏FOLLOW for more
👍BOOST if you found it useful.
✍️COMMENT below with your views.
Meanwhile, check out my other stock ideas on the right side until this trade is activated. I would love your feedback.
Disclaimer: "I am not a SEBI REGISTERED RESEARCH ANALYST AND INVESTMENT ADVISER."
This analysis is intended solely for informational and educational purposes and should not be interpreted as financial advice. It is advisable to consult a qualified financial advisor or conduct thorough research before making investment decisions.
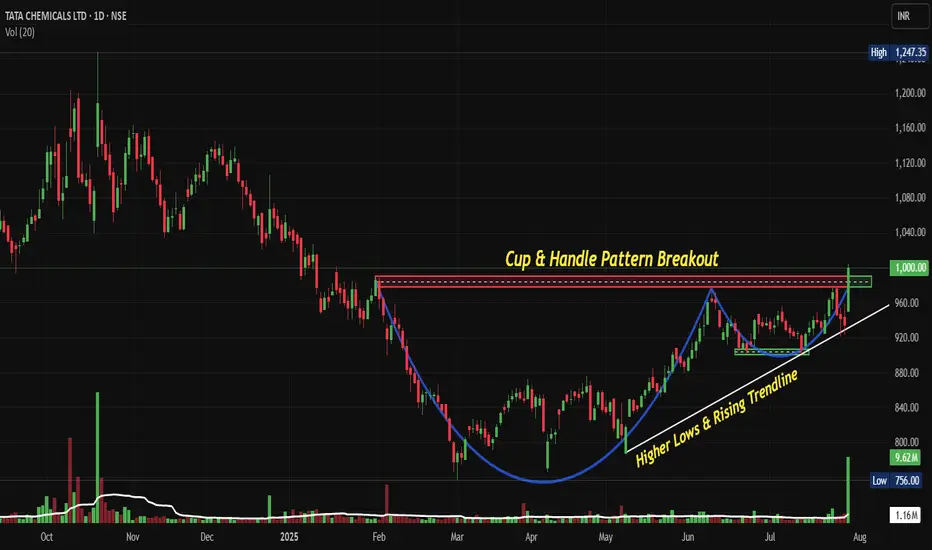
TATACHEM: Breaks out of Cup & Handle Breakout Post Q1 FY 26NSE:TATACHEM Breaks Out: The Cup and Handle Formation That Could Signal New Highs Post Good Q1 FY 26 with Margin Expansion.
Price Action:
Trend Structure
• Long-term uptrend intact with a higher lows pattern since March 2025
• Strong momentum breakout above key resistance at 1,000 levels
• Price action showing bullish continuation after brief consolidation
• Current trading above all major moving averages (20, 50, 200 EMA)
Breakout Characteristics
• Clean breakout above resistance
• Volume expansion confirming institutional participation
• No immediate rejection at breakout level, suggesting strength
• Momentum favouring further upside continuation
Volume Spread Analysis:
Volume Pattern:
• Significant volume spike during the breakout phase in July 2025
• Volume contraction during handle formation (typical healthy pattern)
• Above-average volumes during cup formation, indicating accumulation
• Recent volume expansion suggests institutional buying interest
Volume Confirmation:
• Breakout supported by 2-3x average daily volume
• Previous resistance turning into support with volume backing
• Accumulation-distribution pattern favourable for continued upside
Chart Pattern:
• The chart displays a classic Cup and Handle pattern formation spanning from Jan 2025 to July 2025
• The "Cup" formation shows a rounded bottom with the low around 750-780 levels during March 2025
• The "Handle" represents the consolidation phase between June-July 2025, around 920-960 levels
• Clear breakout above the 1,000 resistance level with strong volume confirmation
Key Technical Levels
• Primary Support: 920-950 (handle low and recent consolidation)
• Secondary Support: 850-880 (mid-cup level)
• Major Support: 750-780 (cup bottom)
• Immediate Resistance: 1,050-1,080 (psychological levels)
• Target Resistance: 1,200-1,250 (measured move from cup depth)
Trade Setup and Strategy:
Entry Levels:
• Aggressive Entry: 1,000-1,020 (on breakout confirmation)
• Conservative Entry: 950-980 (on pullback to handle support)
• Scale-in Entry: 920-950 (major support retest)
Exit Levels:
• Target 1: 1,100-1,120 (initial resistance cluster)
• Target 2: 1,200-1,250 (measured move target)
• Target 3: 1,300-1,350 (extension target based on cup depth)
Stop-Loss Strategy:
• Initial Stop-Loss: 920 (below handle low)
• Trailing Stop: 950 after Target 1 achievement
• Risk-Reward Ratio: 1:3 to 1:4 on conservative entry
Position Sizing and Risk Management:
Position Sizing:
• Allocate 2-3% of portfolio for this trade
• Calculate position size based on stop-loss distance
• Consider scaling in approach for better average entry
Risk Management:
• Maximum risk per trade: 1-2% of total capital
• Use position sizing formula: Risk Amount ÷ (Entry - Stop Loss)
• Maintain diversification across sectors and market caps
Risk Factors:
• Broader market correction could impact individual stock performance
• Sector-specific headwinds in the chemicals industry
• Global economic slowdown affecting demand
Fundamental and Sectoral Backdrop:
Recent Financial Performance:
• Q1 FY26 results showed consolidated revenue of ₹3,719 Cr with EBITDA of ₹649 Cr and PAT of ₹316 Cr
• Standalone revenue at ₹1,169 Cr, up 11.65% compared to Q1FY25, with PAT of ₹307 Cr, up 20%
• Stock gained 16.66% over the last three months
• Strong operational performance supporting technical breakout
Sectoral Outlook:
• The Chemicals market in India is projected to grow by 3.46% (2025-2029), resulting in a market volume of US$35.4bn in 2029
• India's speciality chemicals market is expected to increase at a CAGR of 12% to US$64 billion by 2025
• The chemical industry, currently valued at around US$250 billion, aims to grow to US$300 billion by 2025
• The sector is projected to grow by 11 to 12 per cent during 2021–27, tripling its global market share by 2040
Investment Thesis:
• Strong sectoral tailwinds supporting long-term growth
• Company's positioning in the speciality chemicals segment
• Potential beneficiary of India's manufacturing growth story
• Technical breakout aligning with fundamental strength
Key Monitoring Points:
Technical Triggers:
• Sustain above 1,000 levels for breakout confirmation
• Volume patterns on any pullbacks
• Price action at target levels for profit booking decisions
Fundamental Catalysts:
• Quarterly earnings performance and guidance
• New project announcements or capacity expansions
• Sectoral policy developments and government initiatives
• Global chemical prices and demand trends
Risk Monitoring:
• A break below 920 levels would invalidate the bullish setup
• Broader market sentiment and global risk-off scenarios
• Sector rotation away from chemicals and industrials
• Company-specific news flow and management commentary
My Take:
The combination of technical breakout, strong fundamentals, and positive sector outlook makes NSE:TATACHEM an attractive investment proposition at current levels, with the cup and handle pattern suggesting potential for significant upside over the next 6-12 months.
Keep in the Watchlist and DOYR.
NO RECO. For Buy/Sell.
📌Thank you for exploring my idea! I hope you found it valuable.
🙏FOLLOW for more
👍BOOST if you found it useful.
✍️COMMENT below with your views.
Meanwhile, check out my other stock ideas on the right side until this trade is activated. I would love your feedback.
Disclaimer: "I am not a SEBI REGISTERED RESEARCH ANALYST AND INVESTMENT ADVISER."
This analysis is intended solely for informational and educational purposes and should not be interpreted as financial advice. It is advisable to consult a qualified financial advisor or conduct thorough research before making investment decisions.
RAIN: Breaks Out of Rising Wedge Pattern Signals Fresh UptrendNSE:RAIN Breaks Out: Rising Wedge Pattern Signals Potential Bullish Run to 180+ Levels
Signals Fresh Uptrend After Months of Consolidation
Price Action:
- NSE:RAIN has been trading within a well-defined rising wedge pattern since March 2025
- The stock has recently broken out above the upper trendline of the wedge at approximately 160 levels
- Current price of 160.74 represents a significant move above the key resistance zone
- The breakout is accompanied by increased volume, suggesting genuine buying interest
Volume Spread Analysis:
• Volume breakout accompanied the wedge pattern breakout
• Higher volumes during up moves compared to down moves indicate bullish participation
• Volume spike visible during the recent breakout at 160+ levels
• Average volume of 972K around today, 3.59M shares with recent surge to higher levels
Base Formation and Accumulation Zone:
• The stock established a strong base between 117-125 levels from March to July 2025
• Multiple retests of the 117 support level showed strong buying interest
• Base formation lasted approximately 4 months, indicating thorough accumulation
• Volume during base formation remained relatively stable with occasional spikes
Key Support and Resistance Levels:
• Primary Support: 117.06 (marked as swing low and base support)
• Secondary Support: 140-145 zone (previous resistance turned support)
• Immediate Resistance: 165-170 zone (next major hurdle)
• Target Resistance: 180-185 zone (measured move target)
• 52-week High: 197.00 (ultimate resistance level)
Technical Patterns:
Rising Wedge Breakout Pattern:
• Clear rising wedge pattern formed over 4-5 months
• Lower highs and higher lows converged into a wedge formation
• Breakout occurred at 160+ levels with strong volume confirmation
• Pattern suggests continuation of the broader uptrend
Trend Analysis:
• Long-term trend: Bullish (higher highs and higher lows since March 2025)
• Medium-term trend: Bullish breakout from consolidation
• Short-term trend: Strong bullish momentum post-breakout
• Moving averages alignment suggests sustained upward momentum
Chart Patterns and Indicators:
• Cup and handle formation visible in the broader timeframe
• Multiple flag patterns during the consolidation phase
• Price above all key moving averages, indicating bullish sentiment
Trade Setup and Strategy:
Entry Levels:
• Aggressive Entry: 155-160 levels (on any minor pullback)
• Conservative Entry: 145-150 levels (on deeper retracement to support)
• Breakout Entry: Above 165 levels with volume confirmation
• averaging between 150-160 for position building
Exit Levels and Targets:
• Target 1: 180-185 levels (initial profit booking - 15-20% upside)
• Target 2: 195-200 levels (testing previous highs - 25-30% upside)
• Target 3: 220-230 levels (extended target - 40-45% upside)
• Swing high exit: Trail stops below key support levels
Stop-Loss Strategy:
• Initial Stop-Loss: Below 140 levels (10-12% risk from current levels)
• Trailing Stop-Loss: Below 150 levels once 180 is achieved
• Pattern Stop-Loss: Below the wedge support around 145 levels
• Time-based stop: Exit if no progress in 2-3 months
Position Sizing and Risk Management:
• Maximum position size: 2-3% of total portfolio
• Risk per trade: Not more than 1% of portfolio value
• Scale in approach: 50% at entry, 30% on dip, 20% on breakout confirmation
• Maintain a risk-reward ratio of a minimum of 1:3
Sectoral and Fundamental Backdrop:
Company Overview:
• NSE:RAIN is one of the world's largest producers of calcined petroleum coke, coal tar pitch and other high-quality basic and speciality chemicals
• Market Cap: 5,405 Crore with Revenue: 15,472 Cr
• Promoter Holding: 41.2% indicating stable management control
Financial Health Assessment:
• The company has a low interest coverage ratio, which poses some financial risk
• Net Profit: ₹-115.10Cr as on March 2025 (Q4 FY25) showing current losses
• The company has delivered a poor sales growth of 4.46% over the past five years
• Recent debt reduction efforts as management focuses on prepaying obligations
Business Segments Performance:
• Carbon Business: Environment-friendly and energy-efficient practices have made RAIN's carbon business highly profitable and sustainable
• The carbon business co-generates energy at six calcined petroleum coke plants with a combined power-generation capacity of approximately 135 MW
• The speciality chemicals segment is showing resilience despite market challenges
Sector Outlook and Industry Trends:
• In 2025, the industry is expected to continue its recovery, adjusting to new market drivers while balancing short- and long-term goals
• Chemical industry focusing on decarbonization and innovation initiatives
• India Ratings affirms Rain Industries' credit rating at IND A/Stable with stable outlook and improved operational outlook
Key Risk Factors:
• Cyclical nature of the chemical industry affecting margins
• High debt levels and interest coverage concerns
• Global economic slowdown has an impact on demand
• Raw material price volatility
• Environmental regulations affecting operations
Positive Catalysts
• Debt reduction strategy showing management commitment
• Stable credit rating with improved operational outlook
• Strong technical breakout indicating renewed investor interest
• Global chemical industry recovery supporting sector sentiment
• Energy co-generation capabilities providing cost advantages
Risk Assessment and Monitoring:
Key Levels to Watch:
• Break below 145: Bearish signal, consider exit
• Sustain above 165: Bullish confirmation for higher targets
• Volume patterns: Declining volume on up moves would be concerning
• Sector rotation: Monitor chemical sector performance relative to the broader market
Regular Review Parameters:
• Weekly closing above key moving averages
• Monthly volume trends and institutional participation
• Quarterly earnings performance and guidance
• Industry developments and regulatory changes
• Management commentary on debt reduction progress
Exit Triggers:
• Fundamental deterioration in business metrics
• Break of key technical support levels
• Adverse sector developments
• Better opportunities in other stocks/sectors
• Achievement of target levels with profit booking
My Take:
NSE:RAIN presents a technically attractive setup with the rising wedge breakout, but investors should be cautious about the fundamental challenges. The trade setup offers good risk-reward ratios for short to medium-term positions, while long-term investors should wait for clearer signs of fundamental improvement.
Keep in the Watchlist and DOYR.
NO RECO. For Buy/Sell.
📌Thank you for exploring my idea! I hope you found it valuable.
🙏FOLLOW for more
👍BOOST if you found it useful.
✍️COMMENT below with your views.
Meanwhile, check out my other stock ideas on the right side until this trade is activated. I would love your feedback.
Disclaimer: "I am not a SEBI REGISTERED RESEARCH ANALYST AND INVESTMENT ADVISER."
This analysis is intended solely for informational and educational purposes and should not be interpreted as financial advice. It is advisable to consult a qualified financial advisor or conduct thorough research before making investment decisions.
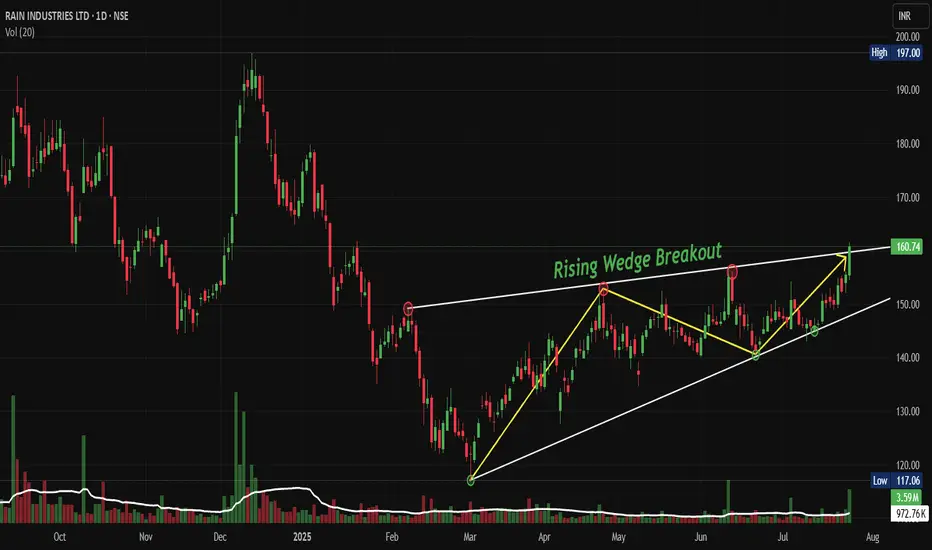
ELGIEQUIP: Breaks Out of its Ascending Triangle PatternNSE:ELGIEQUIP Breaks Out of its Ascending Triangle Pattern: This Industrial Giant Could Be Your Next Multi-Bagger as Manufacturing Boom Accelerates
Price Action:
- Current Price: ₹589.75 (as of chart date)
- 52-Week High: ₹752.95
- 52-Week Low: ₹401.00
- Daily Change: +₹35.95 (+6.41%)
- Market Cap: ₹18,703 Cr.
Volume Spread Analysis:
Volume Profile Assessment:
- Breakout Volume: 6.8M shares (significantly above average)
- Volume Trend: Increasing volume during breakout phase
- Volume-Price Relationship: Positive correlation during an uptrend
- Distribution vs Accumulation: Clear accumulation pattern visible
Volume Indicators:
- 20-day Average Volume: 1.24M shares
- Breakout Volume Confirmation: Yes (above average volume)
- Volume Concentration: Higher volumes at support levels indicate buying interest
My Key Technical Observations:
- Stock has successfully broken out from a major ascending triangle pattern
- Strong volume confirmation on the breakout day
- Price action showing momentum acceleration after months of consolidation
- Clear trend reversal from the March 2025 lows
Pattern Recognition and Structure Analysis:
Primary Pattern: Ascending Triangle Breakout
- Formation Period: Jan 2025 to July 2025 (7 months)
- Resistance Level: ₹570-580 (horizontal resistance)
- Support Trendline: Rising from ₹401 lows in March 2025
- Breakout Confirmation: Volume spike accompanying price breakout
- Pattern Target: ₹680-700 (measuring the height of the triangle base)
Secondary Patterns:
- Double Bottom formation at ₹401 levels (March 2025)
- Flag and pennant consolidations during the uptrend
- Higher highs and higher lows structure since March 2025
Key Support and Resistance:
Key Resistance Levels:
- Immediate Resistance: ₹600-610 (psychological level)
- Major Resistance: ₹650-680 (pattern target zone)
- 52 Week High Resistance: ₹750-755 (previous swing high)
Key Support Levels:
- Immediate Support: ₹560-570 (breakout level, now support)
- Strong Support: ₹520-530 (previous consolidation zone)
- Major Support: ₹480-490 (ascending trendline support)
- Critical Support: ₹440-450 (50% retracement of current move)
Base Formation Analysis:
- Primary Base: ₹480-580 consolidation zone (7 months)
- Base Characteristics: Tight consolidation with reduced volatility
- Base Quality: High-quality base with multiple retests of support/resistance
- Accumulation Evidence: Consistent volume during the consolidation phase
Trade Setup and Entry Strategy:
Primary Trade Setup - Momentum Play:
- Entry Strategy: Buy on pullback to ₹570-575 (breakout retest)
- Alternative Entry: Current levels for aggressive traders
- Entry Rationale: Ascending triangle breakout with volume confirmation
Secondary Trade Setup - Swing Trade:
- Entry Strategy: Accumulate on dips to the ₹520-530 zone
- Entry Rationale: Strong support zone with multiple bounce history
- Time Horizon: 3-6 months
Entry Levels and Execution:
Aggressive Entry (Short-term):
- Entry Price: ₹585-590 (current market price)
- Quantity: 30% of planned position
- Rationale: Momentum continuation play
Conservative Entry (Medium-term):
- Entry Price: ₹570-575 (breakout retest)
- Quantity: 50% of the planned position
- Rationale: Better risk-reward ratio
Value Entry (Long-term):
- Entry Price: ₹520-530 (support zone)
- Quantity: 70% of planned position
- Rationale: High probability support zone
Exit Levels and Profit Targets:
Short-term Targets (1-3 months):
- Target 1: ₹620-630 (5-7% upside from current levels)
- Target 2: ₹650-660 (10-12% upside)
- Target 3: ₹680-690 (pattern target)
Medium-term Targets (3-12 months):
- Target 1: ₹700-720 (psychological resistance)
- Target 2: ₹750-760 (52 Week high retest)
- Target 3: ₹800-820 (extension target)
Exit Strategy:
- Partial Profit Taking: 25% at each target level
- Trailing Stop: Implement after reaching the first target
- Final Exit: Technical breakdown below key support
Stop-Loss Strategy:
Initial Stop-Loss Levels:
- Aggressive Traders: ₹555 (5% below entry)
- Conservative Traders: ₹530 (below support zone)
- Long-term Investors: ₹480 (below ascending trendline)
Stop-Loss Management:
- Initial Risk: 5-10% of entry price
- Trailing Strategy: Move stop-loss to breakeven after 5% profit
- Progressive Tightening: Reduce stop distance as price advances
Position Sizing and Risk Management:
Position Sizing Framework:
- Conservative Approach: 2-3% of portfolio
- Moderate Approach: 3-5% of portfolio
- Aggressive Approach: 5-7% of portfolio
Risk Management Rules:
- Maximum Risk per Trade: 2% of total capital
- Risk-Reward Ratio: Minimum 1:2 for all trades
- Portfolio Concentration: Maximum 10% in a single stock
- Sector Exposure: Maximum 20% in the capital goods sector
Capital Allocation Strategy:
- 30% on initial breakout entry
- 40% on pullback to support
- 30% reserved for additional weakness
Sectoral Backdrop:
Capital Goods Sector Overview:
- Sector Performance: Outperforming broader markets in 2025
- Government Support: PLI schemes boosting manufacturing
- Infrastructure Push: Continued focus on industrial development
- Export Opportunities: Growing global demand for Indian machinery
Industrial Compressor Market Dynamics:
- Market Size: India air compressor market valued at $1.09 billion (2023)
- Growth Projection: Expected to reach $1.64 billion by 2030
- CAGR: 5.4% growth from 2024 to 2030
- Volume Growth: From 64,000 units (2023) to 120,000 units (2030)
Manufacturing Sector Tailwinds:
- Target Achievement: Manufacturing sector expected to reach $1 trillion by 2025
- Industrial Growth: Rapid expansion in the automotive and electronics sectors
- Policy Support: Make in India and PLI schemes driving demand
- Infrastructure Development: Continued capex cycle supporting industrial equipment demand
Fundamental Backdrop:
Company Overview:
- Business: Leading manufacturer of air compressors and pneumatic tools
- Market Position: Strong presence in the industrial compressor segment
- Product Range: Oil-lubricated piston compressors, reciprocating compressors
- Employee Strength: 2,172 employees
Financial Highlights:
- Market Capitalization: ₹ 18,703 Cr.
- EPS (TTM): ₹11.05
- Book Value per Share: ₹58.90
- Price to Book Ratio: 10
- Dividend Yield: 0.37%
Recent Performance:
- Q4 FY25 Revenue: ₹ 993 crore
- Q4 FY25 Net Profit: ₹102.00 crore
- Annual Revenue (FY25): ₹3,510 crore
- Annual Net Profit (FY25): ₹350 crore
Earnings Outlook:
- Next Earnings Report: July 30, 2025 (Expected)
- Annual General Meeting: August 12, 2025 (Expected)
- Dividend Declared: ₹2.20 per share for FY25
- Management Assessment: Economic quality in terms of earnings and margins
Risk Factors and Considerations:
Technical Risks:
- False Breakout Risk: Potential failure to sustain above resistance
- Market Correlation: High correlation with broader market movements
- Sector Rotation: Risk of funds moving away from capital goods
- Volume Sustainability: Need for continued volume support
Fundamental Risks:
- Economic Slowdown: Impact on industrial capex cycles
- Competition Intensity: Pressure from domestic and international players
- Raw Material Costs: Inflation in steel and component prices
- Export Dependency: Global economic uncertainty affecting demand
Market Risks:
- Interest Rate Sensitivity: Impact of monetary policy changes
- Currency Fluctuation: Export revenue exposure to forex volatility
- Regulatory Changes: Potential policy modifications affecting industry
- Liquidity Risk: Lower institutional participation during market stress
My Take:
NSE:ELGIEQUIP presents a compelling technical setup with its successful breakout from a 7-month ascending triangle pattern. The combination of strong volume confirmation, favourable sectoral tailwinds, and robust fundamental positioning makes it an attractive investment opportunity. The stock is well-positioned to benefit from India's manufacturing sector growth and the expanding industrial compressor market.
The risk-reward profile appears favourable for both short-term momentum traders and long-term investors, with multiple entry strategies catering to different risk appetites. However, proper position sizing and disciplined stop-loss management remain crucial for the successful execution of this trade setup.
Keep in the Watchlist and DOYR.
NO RECO. For Buy/Sell.
📌Thank you for exploring my idea! I hope you found it valuable.
🙏FOLLOW for more
👍BOOST if you found it useful.
✍️COMMENT below with your views.
Meanwhile, check out my other stock ideas on the right side until this trade is activated. I would love your feedback.
Disclaimer: "I am not a SEBI REGISTERED RESEARCH ANALYST AND INVESTMENT ADVISER."
This analysis is intended solely for informational and educational purposes and should not be interpreted as financial advice. It is advisable to consult a qualified financial advisor or conduct thorough research before making investment decisions.
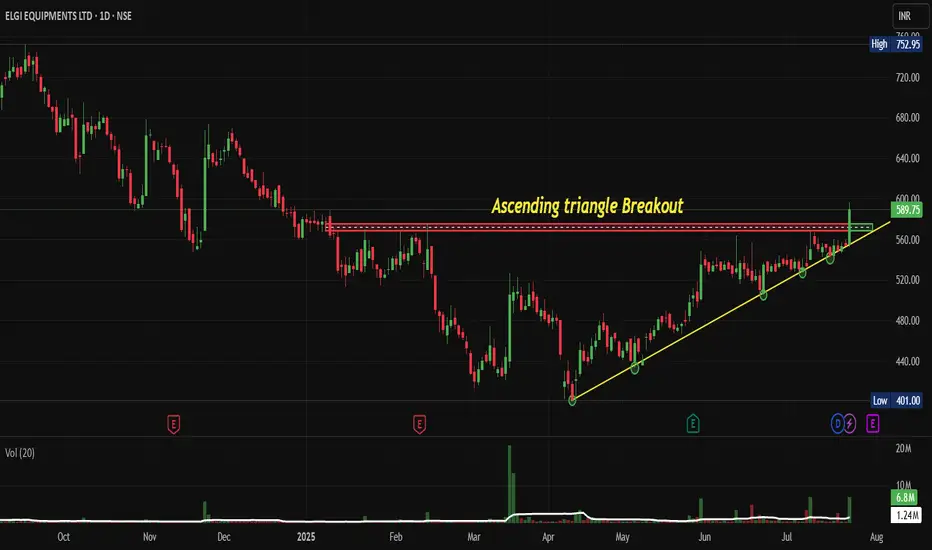
RRKABEL: Cup & Handle Pattern Could Trigger 30% Upside RallyNSE:RRKABEL Perfect Storm: How Cup & Handle Pattern Could Trigger 30% Upside Rally
Price Action Analysis:
Candlestick Patterns:
- Doji Formation: Multiple doji candles during handle formation indicate indecision and potential reversal
- Bullish Engulfing: Strong bullish engulfing pattern on breakout day, showing buying pressure
- Higher Highs/Lows: Clear pattern of higher highs and higher lows post-breakout
- Rejection Candles: Long lower wicks during handle formation show buying support
Price Structure:
- Swing: Clear swing low at ₹853 (March 2025) and swing high at ₹1,850 (previous year)
- Impulse Waves: Strong impulsive moves during the breakout phase indicate institutional participation
- Corrective Waves: Orderly corrective structure during cup and handle formation
- Price Momentum: Accelerating price momentum post-breakout with minimal pullbacks
Market Structure:
- Trend: Transition from downtrend to sideways consolidation to uptrend
- Support Respect: Multiple tests of support levels without breakdown showing strength
- Resistance Breaks: Clean break above multiple resistance levels with conviction
- Price Velocity: Increasing price velocity on breakout indicates strong momentum
Intraday Price Action:
- Opening Gaps: Positive opening gaps during the breakout phase show overnight interest
- Closing Strength: Consistent closing in the upper portion of the daily range
- Pullback Behaviour: Shallow pullbacks with quick recoveries indicate a strong underlying bid
- Volume-Price Sync: Price advances accompanied by volume expansion
Volume Spread Analysis:
Volume Patterns:
- Base Formation: Declining volume during cup formation indicates a lack of selling pressure
- Handle Volume: Minimal volume during handle formation, showing controlled supply
- Breakout Volume: Significant volume spike on breakout confirming institutional participation
- Volume Trend: Above-average volume sustaining post-breakout
Volume Indicators:
- Accumulation Phase: Volume patterns suggest institutional accumulation during the base
- Breakout Confirmation: 2-3x average volume on breakout day
- Follow-through: Consistent volume support in subsequent sessions
- Volume Price Analysis: Positive volume-price correlation during upward movement
Technical Patterns:
Primary Pattern: Cup & Handle Formation
- Cup Formation: The stock formed a classical cup pattern from Jan 2025 to March 2025, with the left rim at approximately ₹1,420 levels
- Handle Formation: A clean handle pattern developed from May to July 2025, showing controlled consolidation with diminishing volume
- Breakout Confirmation: Strong breakout above ₹1,420 resistance with increased volume, signalling pattern completion
- Pattern Reliability: The 6-month cup formation provides a strong technical foundation for sustained upward momentum
Secondary Pattern: Ascending Triangle
- Formation Period: June to July 2025 within the handle structure
- Resistance Level: Horizontal resistance at ₹1,420 tested multiple times
- Support Trend: Rising support line indicating accumulation phase
- Breakout: Clean breakout above triangle resistance with volume expansion
Support & Resistance Levels:
Key Support Levels:
- Immediate Support: ₹1,350 (breakout pullback level)
- Secondary Support: ₹1,280 (handle low)
- Major Support: ₹1,200 (psychological level and previous resistance)
- Critical Support: ₹1,080 (cup base level)
Key Resistance Levels:
- Immediate Resistance: ₹1,500 (psychological level)
- Target Resistance: ₹1,650 (cup depth projection)
- Extended Target: ₹1,800 (previous swing high)
- Long-term Resistance: ₹1,850 (52-week high)
Base Analysis:
Base Characteristics:
- Base Type: Cup with handle base formation
- Duration: 7 months (Jan 2025 to July 2025)
- Depth: Approximately 35% correction from highs
- Volume Pattern: Declining volume during base formation, expanding on breakout
- Base Quality: High-quality base with proper structure and time frame
Base Strength Indicators:
- Volatility Contraction: Price volatility decreased during handle formation
- Volume Dry-up: Minimal selling pressure during consolidation
- Support Holding: Multiple tests of support levels without breakdown
- Institutional Activity: Likely accumulation phase based on volume patterns
Trade Setup:
Entry Strategy:
- Primary Entry: ₹1,420-1,430 (on breakout confirmation)
- Secondary Entry: ₹1,380-1,400 (on pullback to breakout level)
- Aggressive Entry: ₹1,350-1,360 (deeper pullback support)
Entry Confirmation Signals:
- Volume Expansion: Minimum 1.5x average volume on entry
- Price Action: Close above ₹1,420 for two consecutive sessions
- Momentum: RSI above 50 and trending upward
- Moving Averages: Price above 20 and 50-day moving averages
Exit Levels:
Profit Targets:
- Target 1: ₹1,500 (5.5% upside) - Psychological resistance
- Target 2: ₹1,650 (16% upside) - Cup depth projection
- Target 3: ₹1,800 (27% upside) - Previous swing high
- Extended Target: ₹1,850 (30% upside) - 52-week high
Exit Strategy:
- Partial Profit: Book 25% at Target 1
- Scale Out: 50% at Target 2
- Trailing Stop: Implement 8-10% trailing stop after Target 2
- Final Exit: Complete exit at Target 3 or on stop-loss trigger
Stop-Loss Strategy:
Stop-Loss Levels:
- Conservative: ₹1,320 (7% below entry)
- Moderate: ₹1,280 (10% below entry)
- Aggressive: ₹1,250 (12% below entry)
Stop-Loss Management:
- Initial Stop: Below handle low at ₹1,280
- Trailing Stop: Move to breakeven after 5% profit
- Progressive Stops: Raise stops with each target achievement
- Time Stop: Exit if no progress within 4-6 weeks
Position Sizing:
Risk-Based Sizing:
- Conservative Approach: 1-2% of portfolio risk
- Moderate Approach: 2-3% of portfolio risk
- Aggressive Approach: 3-5% of portfolio risk
Position Calculation:
- Risk Per Share: Entry price minus stop-loss level
- Position Size: (Portfolio Risk Amount) / (Risk Per Share)
- Example: For ₹1,400 entry with ₹1,280 stop, risk = ₹120 per share
- Capital Allocation: Maximum 5-8% of total portfolio in a single position
Risk Management:
Risk Control Measures:
- Position Sizing: Limit individual position to 5% of portfolio
- Stop-Loss Discipline: Strict adherence to predetermined stop levels
- Diversification: Maintain exposure across multiple sectors
- Correlation Risk: Avoid concentration in similar cable stocks
Risk Monitoring:
- Daily Monitoring: Track volume, price action, and sector performance
- Weekly Review: Assess progress toward targets and adjust stops
- News Monitoring: Stay updated on company and sector developments
- Market Correlation: Monitor broader market conditions
Sectoral Backdrop:
Indian Cable Industry Outlook:
- Market Growth: The market is projected to grow from USD 10.01 billion in 2025 to USD 17.08 billion by 2032, exhibiting a CAGR of 7.94% during the forecast period
- Infrastructure Push: India's National Grid capacity is expanding continuously under the PM Gati Shakti National Master Plan, which is expected to add around 26,988 circuit km capacity by 2024-2025
- Renewable Energy: India has observed a substantial rise in the demand for wires and cables due to the country's ambitious renewable energy goals
Growth Drivers:
- Smart Cities: The development of smart cities in the country, along with the increase in electronic devices in the household, would increase the demand
- Government Investment: India Wires and Cables Market would grow on the back of rapidly growing investment by the government towards the development of infrastructural projects
- Electrification: Growing electricity demand is driving transmission and distribution network expansion
Fundamental Backdrop:
Company Profile:
- Market Position: RR Kabel is now the 4th largest W&C Company in India by value.
- Global Presence: With a global presence spanning over 67 countries, this electrical company has established a strong international footprint
- Financial Performance: Revenue: 7,618 Cr · Profit: 312 Cr
Financial Metrics:
- Market Cap: Mkt Cap: 16,529 Crore (down -17.5% in 1 year)
- Valuation: Stock is trading at 7.68 times its book value
- Promoter Holding: Promoter Holding: 61.8%
- 52-Week Range: The 52-week high is ₹1825 and the 52-week low is ₹750
Investment Considerations:
- Sector Tailwinds: Strong sectoral growth prospects with government infrastructure push
- Market Leadership: Established position as the 4th largest cable company in India
- International Exposure: Diversified revenue streams from 67 countries
- Valuation Concerns: Recent 22.8% decline in market cap may indicate value opportunity
My Take:
The technical setup for NSE:RRKABEL presents a compelling opportunity with the successful completion of a cup and handle pattern. The 8-month base formation, combined with strong sectoral tailwinds and the company's market leadership position, creates a favourable risk-reward scenario. The breakout above ₹1,420 with volume confirmation suggests institutional participation and potential for sustained upward momentum toward the ₹1,650-1,800 target range.
Key success factors include strict adherence to stop-loss levels, proper position sizing, and monitoring of broader market conditions. The sectoral growth prospects, driven by infrastructure development and renewable energy initiatives, provide fundamental support for the technical breakout.
Keep in the Watchlist and DOYR.
NO RECO. For Buy/Sell.
📌Thank you for exploring my idea! I hope you found it valuable.
🙏FOLLOW for more
👍BOOST if you found it useful.
✍️COMMENT below with your views.
Meanwhile, check out my other stock ideas on the right side until this trade is activated. I would love your feedback.
Disclaimer: "I am not a SEBI REGISTERED RESEARCH ANALYST AND INVESTMENT ADVISER."
This analysis is intended solely for informational and educational purposes and should not be interpreted as financial advice. It is advisable to consult a qualified financial advisor or conduct thorough research before making investment decisions.
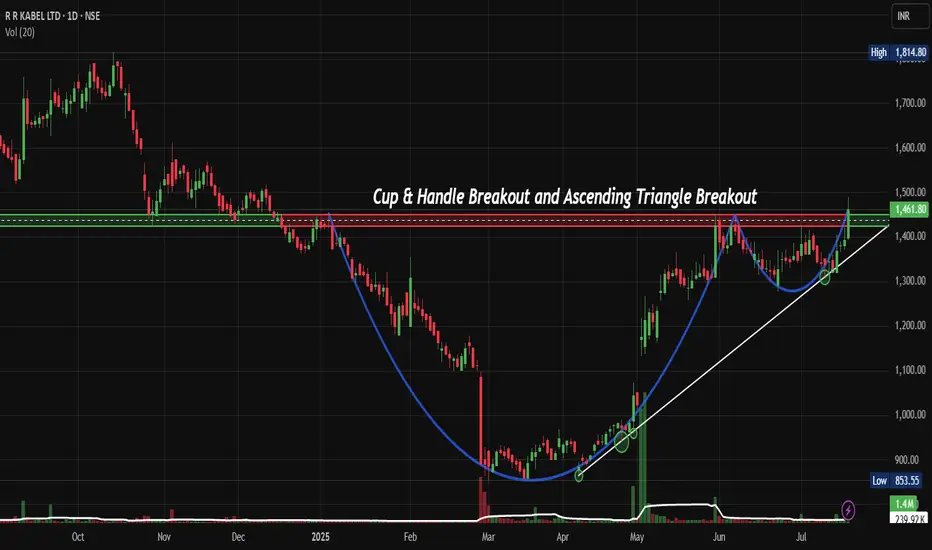
KIRLPNU: Technical Breakout Attempt That Could Deliver 25% ReturNSE:KIRLPNU : A Technical Breakout Attempt That Could Deliver 25% Returns
Price Action Analysis:
- Current Price: Rs 1,511.20
- Day's High: Rs 1,817.00
- Day's Low: Rs 953.00
- Volume: 152.69K shares
Volume Spread Analysis:
Volume Profile:
- Significant volume spike during recent breakout attempt
- Volume during consolidation was relatively lower
- Current volume suggests institutional buying
- Volume trend supports price movement authenticity
Volume Indicators:
- Volume surge above 20-day average confirms breakout attempt
- Price-volume divergence absent, indicating a healthy move
- The accumulation phase is visible in the volume profile during base formation
Key Technical Observations:
- The stock has shown a strong upward momentum with a significant gap-up movement
- Price has moved from the consolidation zone around Rs 1,350-1,400 to the current levels
- Strong volume surge indicating institutional participation
- Daily candlestick pattern shows bullish momentum with long green candles
Technical Levels & Pattern Analysis:
Support Levels:
- Immediate Support: Rs 1,350-1,380 (previous resistance turned support)
- Strong Support: Rs 1,250-1,300 (multiple touch points)
- Major Support: Rs 1,100-1,150 (significant accumulation zone)
Resistance Levels:
- Immediate Resistance: Rs 1,550-1,580 (red horizontal line marked on chart)
- Next Resistance: Rs 1,650-1,700 (psychological level)
- Major Resistance: Rs 1,800-1,850 (day's high region)
Base Formation:
- Multi-month base formation visible from December 2024 to June 2025
- Consolidation range: Rs 1,100 to Rs 1,400
- Base breakout occurred around Rs 1,380-1,400 levels
- Volume expansion during breakout confirms strength
Technical Patterns:
- Cup and Handle pattern completion with breakout attempt
- Ascending triangle formation during the consolidation phase
- Bullish flag pattern on shorter timeframes
- Higher highs and higher lows trend intact
Trade Setup:
Entry Strategy:
- Primary Entry: Rs 1,480-1,520 (current market price on dips)
- Secondary Entry: Rs 1,350-1,380 (on pullback to support)
- Aggressive Entry: Rs 1,540-1,560 (breakout continuation)
Target Levels:
- Target 1: Rs 1,650-1,700 (8-12% upside)
- Target 2: Rs 1,800-1,850 (18-22% upside)
- Target 3: Rs 1,950-2,000 (25-30% upside)
Stop Loss Levels:
- Conservative Stop Loss: Rs 1,320 (below major support)
- Aggressive Stop Loss: Rs 1,420 (below immediate support)
- Trailing Stop Loss: Rs 1,480 (after first target achievement)
Risk Management:
Position Sizing:
- Conservative traders: 2-3% of portfolio
- Moderate traders: 4-5% of portfolio
- Aggressive traders: 6-8% of portfolio
- Risk per trade should not exceed 1-2% of total capital
Risk Assessment:
- Risk-Reward Ratio: 1:2 to 1:3 (favorable)
- Maximum drawdown potential: 12-15%
- Probability of success: 65-70% based on technical setup
Money Management Rules:
- Never risk more than 2% of capital per trade
- Use position sizing based on stop loss distance
- Maintain diversification across sectors
- Book partial profits at predetermined levels
Sectoral Backdrop:
Industry Overview:
- NSE:KIRLPNU is engaged in the manufacturing and service of engineering goods, operating through the Compression Systems Segment, comprising air and gas compressors, air-conditioning and refrigeration
- Industrial air compressor market to grow at 8.2% CAGR (2023-2033) with market share to reach US$6.86 Billion by 2033
Market Dynamics:
- India Air Compressor Market is forecast to reach $995 million by 2030, after growing at a CAGR of 5.2% during 2024-2030
- Manufacturing is expected to contribute 39.1% share of the market in 2025, as the industry relies heavily on compressed air for pneumatic tools
Growth Drivers:
- Increasing industrialization and infrastructure development
- Rising demand from the manufacturing and automotive sectors
- Energy-efficient compressor adoption
- Government initiatives supporting industrial growth
Fundamental Backdrop:
Financial Performance:
- Market Cap: 9,797 Crore with Revenue of 1,629 Cr and Profit of 211 Cr
- Revenue: ₹583Cr as on March 2025 (Q4 FY25) with Net Profit: ₹81Cr
- Annual revenue growth of 23% is outstanding, Pre-tax margin of 17% is great, ROE of 21.1% is exceptional, ROCE of 28.3% is also exceptional
Key Metrics:
- The stock is trading at 8.95 times its book value
- The company is debt-free and has a strong balance sheet, enabling stable earnings growth
- Promoter holding has decreased over the last 3 years: -14.8% with current Promoter Holding: 38.85%
Analyst Outlook:
- Recent research reports show an average share price target of 1784
- Strong financial metrics support technical breakout
- Debt-free status provides financial flexibility
- Consistent profitability across business cycles
Investment Thesis Summary:
Bullish Factors:
- Strong technical breakout attempt with volume confirmation
- Robust financial performance with 23.14% revenue growth
- Favourable industry growth prospects
- Debt-free balance sheet providing stability
Risk Factors:
- General market volatility
- Sector-specific cyclical risks
- Global economic uncertainties
- Promoter holding reduction trend
My Take:
NSE:KIRLPNU presents a compelling technical setup with strong fundamental backing. The recent breakout attempt from multi-month consolidation, supported by volume surge and positive sector outlook, creates an attractive risk-reward opportunity for medium-term investors. The company's strong financial metrics and debt-free status add confidence to the technical setup.
Keep in the Watchlist.
NO RECO. For Buy/Sell.
📌Thank you for exploring my idea! I hope you found it valuable.
🙏FOLLOW for more
👍BOOST if you found it useful.
✍️COMMENT below with your views.
Meanwhile, check out my other stock ideas on the right side until this trade is activated. I would love your feedback.
Disclaimer: "I am not a SEBI REGISTERED RESEARCH ANALYST AND INVESTMENT ADVISER."
This analysis is intended solely for informational and educational purposes and should not be interpreted as financial advice. It is advisable to consult a qualified financial advisor or conduct thorough research before making investment decisions.

Rossari: Ready to Break Out from Multi-Month ConsolidationNSE:ROSSARI : Hidden Gem Ready to Break Out from Multi-Month Consolidation - My Technical Analysis & Trade Setup on this beautiful Chart Structure
Price Action:
- Stock has been in a prolonged consolidation phase since March 2025, after a significant decline from highs near 970 levels
- Current price action shows the formation of a symmetrical triangle pattern with converging trend lines
- Recent price movement indicates a potential breakout attempt with increased volume participation
- The stock has found strong support around 580-600 levels and resistance near the 720-740 zone
Volume Spread Analysis:
Volume Characteristics:
- Volume has been declining during the consolidation phase, which is typical for triangle patterns
- Recent sessions show increasing volume participation, suggesting institutional interest
- Volume spike during recent upward movement indicates genuine buying interest
- Average volume appears to be around 300-400K shares, with recent pickup to 620K+
Volume Confirmation Signals:
- Higher volume on up days compared to down days in recent sessions
- Volume expansion during the recent breakout attempt
- Accumulation pattern visible in volume profile during base formation
Base Formation:
- Primary base formation: Large consolidation base formed between 580-740 levels over 7+ months
- Base characteristics: Symmetrical triangle with higher lows
- Base depth: Approximately 27% from resistance to support levels
- Time duration: An Extended 7-month base suggests a strong accumulation phase
Key Support and Resistance Levels:
- Immediate Support: 680-690 (recent swing low)
- Major Support: 580-600 (tested multiple times, strong buying interest)
- Immediate Resistance: 720-740 (upper trend line of triangle)
- Major Resistance: 800-820 (previous significant resistance zone)
- Ultimate Resistance: 900-920 (prior consolidation area)
Technical Patterns:
- Primary Pattern: Symmetrical Triangle
- Secondary Pattern: Potential Cup and Handle formation within the larger triangle
- Volume Pattern: Decreasing volume during consolidation with recent pickup suggesting breakout preparation
- Price compression: Narrowing price range indicates imminent directional move
Trade Setup:
Entry Strategy:
- Primary Entry: On breakout above 720-725 with volume confirmation
- Secondary Entry: On pullback to 700-705 levels after successful breakout
- Aggressive Entry: Current levels around 704-706 for risk-tolerant traders
Exit Levels:
- Target 1: 760-770 (measured move from triangle base)
- Target 2: 800-820 (previous resistance zone)
- Target 3: 860-880 (extended target based on base depth)
- Ultimate Target: 920-950 (full triangle breakout target)
Stop-Loss Strategy:
- Conservative Stop-Loss: Below 680 (recent swing low)
- Aggressive Stop-Loss: Below 695 (intraday support)
- Trailing Stop: Move to breakeven once Target 1 is achieved
Position Sizing:
- Risk per trade: Maximum 2% of portfolio
- Position size calculation: Based on stop-loss distance from entry
- For entry at 705 with stop at 680: Risk of 25 points allows for appropriate position sizing
- Recommended allocation: 3-5% of portfolio for medium-term holding
Risk Management:
- Maximum drawdown tolerance: 3-4% from entry point
- Partial profit booking at each target level (25% at each target)
- Trailing stop-loss implementation after achieving Target 1
- Time-based exit if no progress within 3-4 weeks
Sectoral and Fundamental Backdrop:
Sector Overview:
- The speciality chemicals sector is showing resilience in the current market conditions
- Increasing demand for sustainable and eco-friendly chemical solutions
- The government push for domestic manufacturing under PLI schemes
- Growing export opportunities in the speciality chemicals space
Company Fundamentals:
- Business Profile: Speciality chemicals manufacturer focusing on home, personal care, and fabric care segments
- Revenue Growth: Consistent growth trajectory in recent quarters
- Market Position: Strong presence in domestic market with expanding export footprint
- Product Portfolio: Diversified range of speciality chemicals and ingredients
Industry Tailwinds:
- Increasing consumer spending on personal care products
- Growing demand for sustainable and biodegradable chemical products
- Import substitution opportunities in speciality chemicals
- Rising per capita income is driving demand for quality personal care products
Fundamental Catalysts:
- New product launches and capacity expansions
- Strategic partnerships and collaborations
- Improving operational efficiency and margin expansion
- Strong balance sheet supporting growth investments
Risk Factors:
Technical Risks:
- Failure to sustain above 720 levels could lead to further consolidation
- Breakdown below 680 could trigger deeper correction to 600-620 levels
- Low liquidity may result in higher volatility during a breakout
Fundamental Risks:
- Raw material price inflation is impacting margins
- Competitive pressure from larger players
- Regulatory changes affecting product approvals
- Currency fluctuation impact on export revenues
My Take:
NSE:ROSSARI presents an attractive risk-reward setup with a well-defined technical pattern and strong fundamental backdrop. The extended consolidation phase suggests substantial energy is building up for the next directional move. With proper risk management and disciplined execution, this setup offers multiple target levels for profit booking while maintaining manageable downside risk.
Keep in the Watchlist.
NO RECO. For Buy/Sell.
📌Thank you for exploring my idea! I hope you found it valuable.
🙏FOLLOW for more
👍BOOST if you found it useful.
✍️COMMENT below with your views.
Meanwhile, check out my other stock ideas on the right side until this trade is activated. I would love your feedback.
Disclaimer: "I am not a SEBI REGISTERED RESEARCH ANALYST AND INVESTMENT ADVISER."
This analysis is intended solely for informational and educational purposes and should not be interpreted as financial advice. It is advisable to consult a qualified financial advisor or conduct thorough research before making investment decisions.
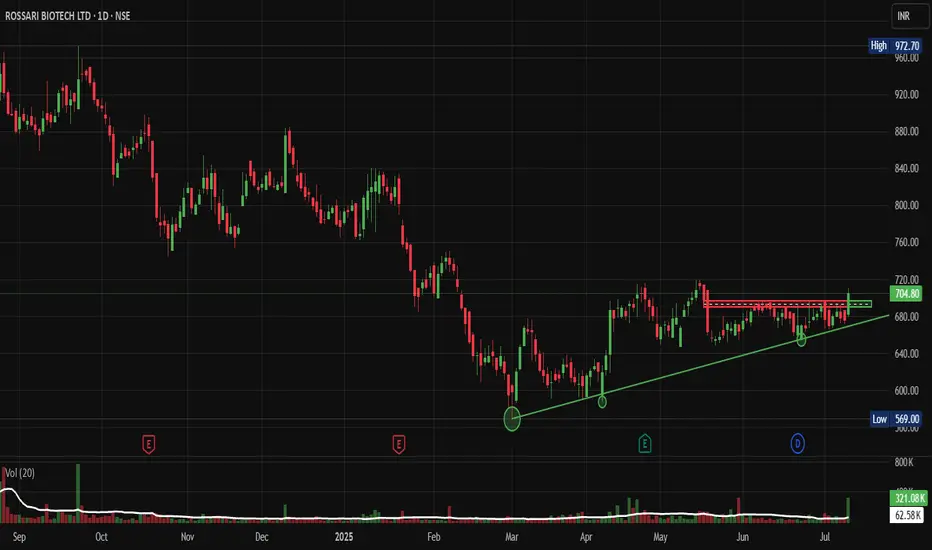
AHLUCONT: Rising Wedge pattern formationNSE:AHLUCONT Rising from the Ashes: How This Construction Giant is Trying to Break Out of Its Year-Long Consolidation Pattern. Let's Analyze
Price Action Analysis:
• The stock is displaying a classic Rising Wedge pattern formation over the past several months
• Current price of ₹1,037.70 represents a +54.00 gain (+5.49%) from the previous close
• The stock has established a strong base formation around the ₹620-650 levels as indicated by the low marker
• Multiple higher lows have been formed along the rising trendline, demonstrating buying interest at progressively higher levels
• The pattern shows a narrowing price range as it approaches the apex, typical of wedge formations
Volume Spread Analysis:
• Volume has been relatively subdued during the consolidation phase, which is characteristic of wedge patterns
• Recent session shows increased volume at 349.26K compared to the average, suggesting institutional participation
• Volume spikes appear to coincide with key support and resistance tests, indicating active participation at critical levels
Key Technical Levels:
Support Levels:
• Primary Support: ₹950-970 (recent breakout level)
• Secondary Support: ₹850-880 (previous consolidation zone)
• Major Support: ₹620-650 (base formation area)
Resistance Levels:
• Immediate Resistance: ₹1,050-1,070 (psychological level)
• Key Resistance: ₹1,100-1,120 (pattern target)
• Major Resistance: ₹1,300-1,337 (52-week high zone)
Technical Patterns:
• Rising Wedge Pattern: The stock has formed a rising wedge over several months, which typically indicates a continuation pattern in an uptrend
• Base Formation: A solid base has been established in the ₹620-650 range, providing strong support for future moves
Trade Setup:
Entry Strategy:
• Primary Entry: ₹1,040-1,050 (current levels with momentum confirmation)
• Secondary Entry: ₹980-1,000 (on any retracement to support)
• Breakout Entry: Above ₹1,070 with volume confirmation
Exit Strategy:
• Target 1: ₹1,120-1,150 (short-term target)
• Target 2: ₹1,200-1,250 (medium-term target)
• Target 3: ₹1,300+ (long-term target based on pattern projection)
Risk Management:
• Stop Loss: ₹950 (below recent support and breakout level)
• Position Size: Risk 1-2% of portfolio per trade
• Risk-Reward Ratio: Minimum 1:2 for all entries
Position Sizing Guidelines:
• Conservative investors: 2-3% of portfolio
• Moderate risk takers: 4-5% of portfolio
• Aggressive traders: 6-8% of portfolio (not recommended to exceed this)
Sectoral and Fundamental Backdrop:
Company Overview:
• Ahluwalia Contracts has a market cap of ₹6,936 crore with promoter holding at 55.32%
• The company reported revenue of ₹4,099 crore and profit of ₹202 crore
• Recent quarterly results show revenue of ₹1,215.84 crore and net profit of ₹83.33 crore for Q4 FY25
Sector Outlook:
• The infrastructure boom is set to lead India to become the third-largest construction market by 2025
• Government has bolstered capital expenditure by 11.1% to $133 billion for fiscal year 2024-25, equivalent to 3.4% of GDP
• The India Infrastructure Sector Market is expected to reach USD 190.70 billion in 2025 and grow at a CAGR of 8% to reach USD 280.60 billion by 2030
Government Support:
• Budget 2025-26 allocates INR 11.21 lakh crore for the infrastructure sector
• The FY2025–26 Budget outlines major allocations with INR 2.9 trillion for the Ministry of Road Transport and Highways, and INR 2.6 trillion for the Ministry of Railways
Growth Drivers:
• The flourishing housing market, coupled with the government's sustained and massive infrastructure push, has driven construction market growth
• Government-led initiatives aimed at advancing infrastructure are driving the Indian construction market growth during the forecast period
• The India Construction Market is projected to register a CAGR of greater than 6% during the forecast period (2025-2030)
Investment Rationale:
Bullish Factors:
• Strong technical breakout on cards from a well-defined pattern
• Robust government spending on infrastructure development
• The company's established market position in the construction sector
• Healthy financial metrics with consistent profitability
Risk Factors:
• Contingent liabilities of ₹1,963 crore present a concern
• Dividend payout has been low at 1.42% of profits over the last 3 years
• General market volatility could impact sector performance
• Execution risks in large infrastructure projects
My Take:
The stock presents a compelling technical setup with strong fundamental support from the government's infrastructure push. The rising wedge breakout, combined with increased volume and supportive sector dynamics, makes it an attractive investment opportunity for medium to long-term investors. However, strict adherence to stop-loss levels and position sizing guidelines is essential for risk management.
Keep in the Watchlist.
NO RECO. For Buy/Sell.
📌Thank you for exploring my idea! I hope you found it valuable.
🙏FOLLOW for more
👍BOOST if you found it useful.
✍️COMMENT below with your views.
Meanwhile, check out my other stock ideas on the right side until this trade is activated. I would love your feedback.
Disclaimer: "I am not a SEBI REGISTERED RESEARCH ANALYST AND INVESTMENT ADVISER."
This analysis is intended solely for informational and educational purposes and should not be interpreted as financial advice. It is advisable to consult a qualified financial advisor or conduct thorough research before making investment decisions.
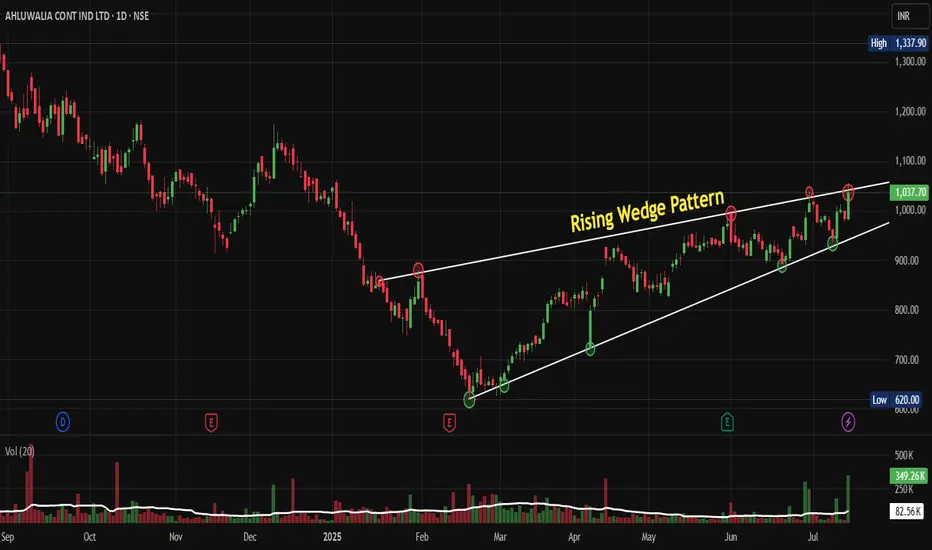
PCBL: The Sleeping Giant Ready to BreakOut of Its TriangleNSE:PCBL : The Sleeping Giant Ready to Break Out of Its Consolidation Triangle
Price Action Analysis:
• Stock has been trading in a well-defined ascending triangle pattern since early 2025
• Current price at ₹434.40 represents a +2.53% gain, showing bullish momentum
• The pattern shows a higher low formation with resistance around ₹450-460 levels
• Recent price action suggests an accumulation phase with controlled volatility
Volume Spread Analysis:
• Volume has been consistently above average during recent sessions (4.79M vs 1.71M average)
• Volume spike visible in recent trading sessions, indicating increased institutional interest
• The volume pattern supports the price consolidation with periodic accumulation phases
• Higher volume during up-moves compared to down-moves suggests buying interest
Key Technical Levels:
Support Levels:
• Primary Support: ₹420-425 (recent swing low)
• Secondary Support: ₹390-395 (ascending trendline support)
• Major Support: ₹360-370 (previous consolidation zone)
Resistance Levels:
• Immediate Resistance: ₹450-460 (triangle upper boundary)
• Key Resistance: ₹480-490 (previous highs)
• Major Resistance: ₹520-530 (psychological level)
Base Formation:
• The stock has formed a strong ascending triangle base over 6-7 months
• Base depth of approximately 15-20% from highs to lows
• Duration suggests a sustainable breakout when it occurs
• Base shows characteristics of institutional accumulation
Technical Patterns:
• Primary Pattern: Ascending Triangle (Bullish)
• Secondary Pattern: Flag formation on shorter timeframes
• Volume-Price Relationship: Positive divergence during recent consolidation
• Moving Average Setup: Price trading above all its key moving averages
Trade Setup:
Entry Strategy:
• Breakout Entry: ₹465-470 (above triangle resistance with volume confirmation)
• Pullback Entry: ₹440-445 (on any dip to support with volume)
• Accumulation Entry: ₹420-430 (for longer-term investors)
Exit Levels:
• Target 1: ₹520-530 (measured move from triangle base)
• Target 2: ₹580-590 (previous swing high zone)
• Target 3: ₹650-680 (extension target based on base depth)
Stop-Loss Levels:
• For Breakout Trades: ₹445-450 (below breakout level)
• For Accumulation Trades: ₹410-415 (below key support)
• Trailing Stop: Use an 8-10% trailing stop after the first target
Position Sizing:
• Conservative Approach: 2-3% of portfolio
• Moderate Approach: 3-5% of portfolio
• Aggressive Approach: 5-7% of portfolio (only for experienced traders)
Risk Management:
• Risk-Reward Ratio: Minimum 1:2 for all trades
• Maximum risk per trade: 2% of total capital
• Use the position sizing calculator based on stop-loss distance
• Avoid adding to losing positions
• Book partial profits at each target level
Sectoral Backdrop:
Chemical Sector Overview:
• Indian chemical sector showing strong fundamentals with export growth
• The speciality chemicals segment is experiencing robust demand
• The government's PLI scheme supports domestic chemical manufacturing
• Global supply chain diversification benefiting Indian chemical companies
Industry Trends:
• Increasing demand for agrochemicals and pharmaceutical intermediates
• Focus on sustainable and green chemistry practices
• Rising input costs are being managed through pricing power
• Strong export opportunities in speciality chemicals
Fundamental Backdrop:
Company Overview:
• NSE:PCBL is a leading player in speciality chemicals and carbon black
• Strong presence in the tire industry through carbon black manufacturing
• Diversified product portfolio, reducing concentration risk
• Established relationships with major tire manufacturers
Financial Highlights:
• Consistent revenue growth over the past few quarters
• Improving margin profile due to operational efficiency
• Strong balance sheet with manageable debt levels
• Increasing return on equity and asset efficiency
Growth Drivers:
• Expanding tire industry in India and globally
• New product launches in speciality chemicals
• Capacity expansion plans for key products
• Focus on high-margin speciality products
Risk Factors:
• Raw material price volatility
• Environmental regulations compliance costs
• Competition from global players
• Cyclical nature of the tire industry
My Take:
NSE:PCBL presents a compelling technical setup with its ascending triangle pattern nearing completion. The combination of strong volume accumulation, supportive sectoral trends, and improving fundamentals creates a favourable risk-reward scenario. Traders should wait for a decisive breakout above the ₹465 levels, accompanied by volume confirmation, for optimal entry. Meanwhile, investors can consider gradual accumulation at current levels, exercising proper risk management.
Keep in the Watchlist.
NO RECO. For Buy/Sell.
📌Thank you for exploring my idea! I hope you found it valuable.
🙏FOLLOW for more
👍BOOST if you found it useful.
✍️COMMENT below with your views.
Meanwhile, check out my other stock ideas on the right side until this trade is activated. I would love your feedback.
Disclaimer: "I am not a SEBI REGISTERED RESEARCH ANALYST AND INVESTMENT ADVISER."
This analysis is intended solely for informational and educational purposes and should not be interpreted as financial advice. It is advisable to consult a qualified financial advisor or conduct thorough research before making investment decisions.
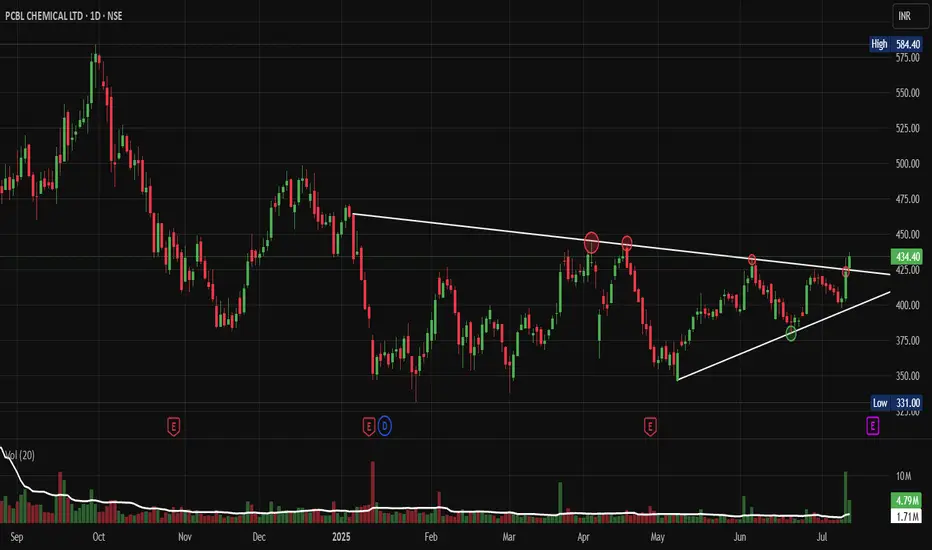
Venus Pipes: A Breakout Story in the MakingNSE:VENUSPIPES : A Breakout Story in the Making
Price Action Analysis:
• Price consolidated between 1,200-1,600 levels from January 2025 to June 2025
• Recent breakout above 1,600 resistance with strong volume confirmation
• Currently trading at 1,574.80 after hitting a high of 2,450.35
• Pullback to retest the breakout level suggests healthy consolidation
Volume Spread Analysis:
• Significant volume spike during the recent breakout phase
• Volume increased from an average of 149.65K to 860.5K, indicating institutional interest
• Higher volume during up moves compared to down moves shows buying pressure
• Volume pattern supports the breakout thesis with strong participation
Key Technical Levels:
Support Levels:
• Primary Support: 1,200 (previous base level)
• Secondary Support: 1,400 (mid-range support)
• Immediate Support: 1,500 (recent pullback low)
Resistance Levels:
• Immediate Resistance: 1,650 (recent high)
• Major Resistance: 2,450 (lifetime high)
• Psychological Resistance: 2,000 and 2,500
Base Formation:
• Strong base formed between 1,200-1,400 levels over 6 months
• Multiple retests of support levels showing accumulation
• Base provides a strong foundation for upward movement
Technical Patterns:
Primary Pattern:
• Bullish continuation pattern with horizontal resistance at 1,600 and rising support line
• Pattern duration: 8 months (Jan 2025 to July 2025)
• Breakout confirmed with volume expansion
Secondary Patterns:
• Higher low pattern indicating underlying strength
• Volume-price divergence resolved with a recent breakout
Trade Setup:
Entry Strategy:
• Conservative Entry: On pullback to 1,500-1,520 levels
• Aggressive Entry: Current levels around 1,570-1,580
• Breakout Entry: Above 1,650 with volume confirmation
Exit Strategy:
• Target 1: 1,800 (immediate target)
• Target 2: 2,100 (50% retracement of lifetime high)
• Target 3: 2,400-2,500 (lifetime high retest)
Stop-Loss Levels:
• For entries around 1,570: Stop at 1,450 (below base support)
• For entries around 1,500: Stop at 1,350 (below key support)
• Trailing stop: 8-10% below recent swing highs
Risk Management:
Position Sizing:
• Risk per trade: Maximum 2% of portfolio
• Position size calculation: Portfolio value × 2% ÷ (Entry price - Stop loss)
• Gradual position building is recommended, given the volatility
Risk Assessment:
• Risk-Reward Ratio: 1:2 to 1:3 for current setup
• Time horizon: 3-6 months for primary targets
• Market correlation: Monitor broader market sentiment
Sectoral Backdrop:
Steel Pipes and Tubes Industry:
• Infrastructure spending boost under government initiatives
• Demand from the oil and gas sector supports growth
• Housing sector recovery driving construction demand
• Water supply projects creating additional opportunities
Industry Trends:
• Consolidation phase in the sector, favouring established players
• Raw material cost pressures being managed through pricing power
• Export opportunities emerging in neighbouring markets
• Technology upgrades improving operational efficiency
Fundamental Backdrop:
Company Overview:
• Venus Pipes & Tubes is a leading manufacturer of steel pipes and tubes
• Established presence in water supply, structural, and industrial applications
• Strong distribution network across India
• Focus on quality and customer service
Recent Developments:
• Capacity expansion plans to meet growing demand
• Strategic partnerships with infrastructure companies
• Improved working capital management
• Strong order book visibility for coming quarters
Financial Health:
• Steady revenue growth trajectory
• Improving margin profile
• Healthy balance sheet with manageable debt levels
• Strong cash flow generation capabilities
My Take:
Short-term View (1-3 months):
• Consolidation expected around current levels
• Potential for retest of breakout levels
• Volume patterns to be monitored for direction
Medium-term View (3-6 months):
• Upside potential to 2,000-2,200 levels
• Sector rotation could benefit the stock
• Infrastructure spending cycle supporting fundamentals
Long-term View (6-12 months):
• Structural growth story intact
• Market leadership position strengthening
• Potential for significant value creation
Keep in the Watchlist.
NO RECO. For Buy/Sell.
📌Thank you for exploring my idea! I hope you found it valuable.
🙏FOLLOW for more
👍BOOST if you found it useful.
✍️COMMENT below with your views.
Meanwhile, check out my other stock ideas on the right side until this trade is activated. I would love your feedback.
Disclaimer: "I am not a SEBI REGISTERED RESEARCH ANALYST AND INVESTMENT ADVISER."
This analysis is intended solely for informational and educational purposes and should not be interpreted as financial advice. It is advisable to consult a qualified financial advisor or conduct thorough research before making investment decisions.
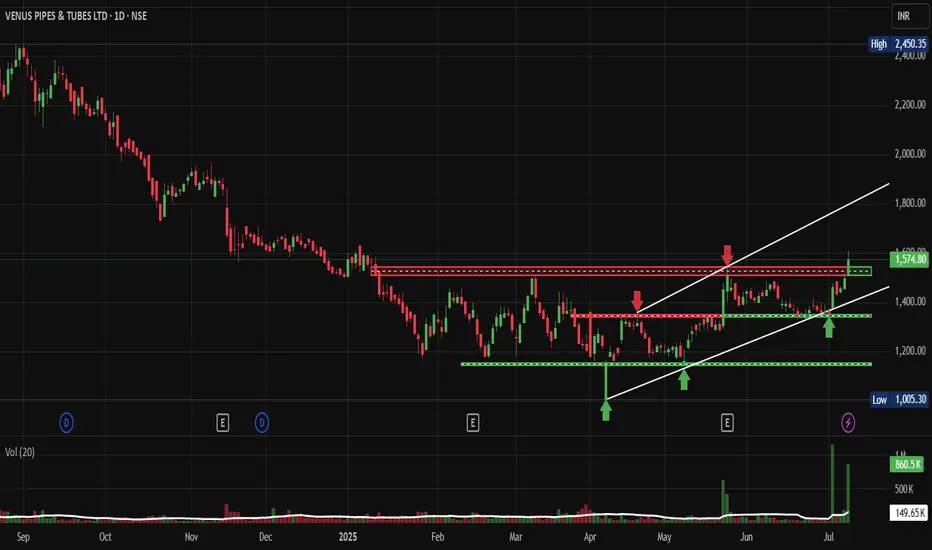
USDT.D BULLISH DIVERGENCE SET TO BLEED BTCCRYPTOCAP:USDT.D has formed a bullish divergence and a clear double bottom with proper higher lows, signaling a potential surge toward the 4% to 4.10% resistance area. This movement could lead to a significant drop in BTC and altcoins, as USDT.D and the crypto market are inversely correlated.

Diverse Trading Strategies for UGRO Capital LtdUGRO Capital Ltd is currently exhibiting a symmetrical triangle pattern, characterized by converging trend lines drawn in black. This technical formation is indicative of a potential continuation or reversal pattern, often signaling an impending breakout, either upward or downward.
Within this chart pattern, the upper trend line serves as a short-term resistance zone, while the price action has encountered difficulties in surpassing this level. A counter-trendline, represented by a dotted black line, suggests an attempt to break free from the prevailing downtrend; however, the stock continues to face resistance from the upper trend line.
The stock has demonstrated notable resilience, establishing multiple support points, clearly identified by the blue line on the chart. These instances of price bounces indicate a consistent level of buying interest and present evidence of the stock's strength. The formation of higher lows during this period signifies a bullish sentiment, suggesting the potential for upward price movement. MACD & RSI values also denotes strong buying pressure and suggests a significant potential for price reversal.
Recent trading activity shows a significant surge in volume over the past two days, substantially exceeding the average trading volumes. This spike is a critical sign of accumulating buying pressure, further supporting the bullish outlook for UGRO Capital Ltd . Increased volume during price ascents often serves as confirmation of the strength of the momentum.
While the current technical indicators present a constructive outlook, a definitive breakout can only be confirmed when the stock price successfully clears the upper trend line resistance. Upon achieving this milestone, the next target of interest will likely be the established resistance level at 299, which could be revisited in the foreseeable future if bullish momentum continues.
Disclaimer: The information provided in this analysis is purely for informational and educational purposes and should not be construed as financial advice. Investors are strongly encouraged to consult with a qualified financial advisor or conduct thorough research prior to making any investment decisions.

Devyani International: Will Weekly Momentum Fuel a Breakout?Devyani International is currently making higher lows, as indicated by the trend line. The stock has established strong support at 142, with resistance at 203. After two failed breakout attempts, the question remains: will the third succeed or will it pull back to support?
Minor resistance at 179 has now turned into support. However, it is important to note that while the weekly volumes remain unimpressive, the MACD is showing growing strength, signaling potential bullish momentum in the coming weeks.
Potential Risk:
The primary risk to the stock's upward trajectory is the possibility of a broader market correction, particularly influenced by uncertainty in the Index.
Disclaimer:
This analysis is intended for educational purposes and is not a recommendation to buy. It is important to learn how to recognize and understand patterns in stock movements.

National aluminium multi pattern trade idea National Aluminium trades within a broader rising wedge pattern, marked by the red lines. A counter-trendline (solid white line) also comes into play, indicating a shorter-term resistance zone. The stock recently broke through one of the dotted hidden lines, but it's still facing resistance from the upper hidden trendline, keeping it just below a key breakout point. The formation of higher lows, highlighted by the yellow circles, signifies strength in price action and building momentum.
Today's volume surge, notably higher than average, adds weight to the bullish sentiment. However, a significant breakout could only be confirmed once the price clears the last hidden line of resistance. Watching closely for this potential move

BASF on a strong supportBASF is consolidating near a strong support. We can see a higher low, higher formation with daily RSI over 60 which indicates that a breakout might happen soon.
Stock might face resistance at 2650 and 2800 levels.
Kindly trade as per your own analysis since this idea is shared only for educational purpose.

Skipper forming HHs-HLs, and ready to breakout?-From strong sector
-making Higher Highs - Higher Lows (HHs-HLs)
-VCP (contraction in price)
-Volume Spikes
-Long Base
-Bounced from 21 ema

CAMS standing on a strong demand zoneCAMS has been in a downtrend from end of 2021. We can see on the chart that the stock is consolidating near a strong support of 2000 level.
RSI is forming higher lows which indicate strength of buyers at this level.
It looks attractive at CMP for a positional long trade for minimum target of 2300.However, a weekly closing below 2000 levels will have a sharp fall upto 1750 levels which is a major risk.
Kindly consider this idea for educational purposes and trade as per your own analysis.

Trend Identification: Utilizing Higher Highs and Higher LowsTechnical Indicator - William Fractal
Setting - 20 period
About the Indicator : William Fractal is a technical analysis tool used by traders in financial markets to identify potential turning points and trends. It is based on the concept of fractals, which are self-similar patterns that repeat themselves on different scales. The William Fractal is formed when there is a series of five bars, with the middle bar having the highest high and the lowest low in comparison to the surrounding bars. Traders use this pattern to determine potential buy and sell signals, as a fractal forming at the bottom of a downtrend could signal a potential reversal, while a fractal forming at the top of an uptrend could signal a potential trend continuation. The William Fractal can be used in combination with other technical indicators to improve trading decisions.
Benefits of using William fractal indicator
Easy to Identify : The William Fractal is a simple and straightforward pattern to spot, making it accessible for traders of all skill levels.
High Accuracy : The pattern is based on the concept of fractals, which have a high degree of accuracy in identifying trend reversals.
Confirms Trend Strength : By highlighting areas of potential trend reversal or continuation, the William Fractal can help traders confirm the strength of a trend.
Improves Timing : By using the William Fractal in conjunction with other technical indicators, traders can improve the timing of their trades and increase the chances of success.
Identifies Key Turning Points : The William Fractal can help traders identify key turning points in the market, allowing them to make informed trades and take advantage of market movements.
Works in All Markets : The William Fractal is applicable across different financial markets, including stocks, forex, and commodities, making it a versatile tool for traders
Try this out and let me know your thoughts in the comment section.

Why Pick Stocks in an Uptrend ? Here I show why I bought some #ROSSELLIND. The stock has been in an uptrend with heavy volumes supporting it. The stock was taking a breather before continuing it's ascent. I found a low risk point to get the entry and the stock immediately shot up.
#ROSSELLIND #MARKMINERVINI #LOWRISK #VOLATILITYCONTRACTION #VCP #INDIA #
