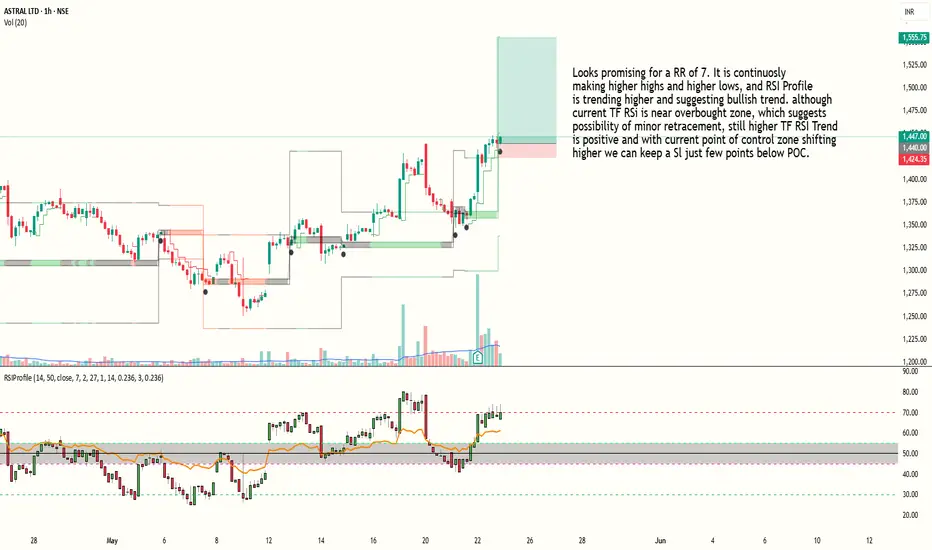
Bullish trade building up in Astral with RR of 7Looks promising for a RR of 7. It is continuosly making higher highs and higher lows, and RSI Profile is trending higher and suggesting bullish trend. although current TF RSI is near overbought zone, which suggests possibility of minor retracement, still higher TF RSI Trend
is positive and with current point of control zone shifting higher we can keep a Sl just few points below POC.
Entry at 1440
SL around 1423
Target around 1555
Risk to reward ratio is around 7.
Indicator used : RSI Hybrid Profile (Link available in my profile)
PS : This is an Educational post and doesn't constitute any trading or financial advice, just do your own research.
Highrr
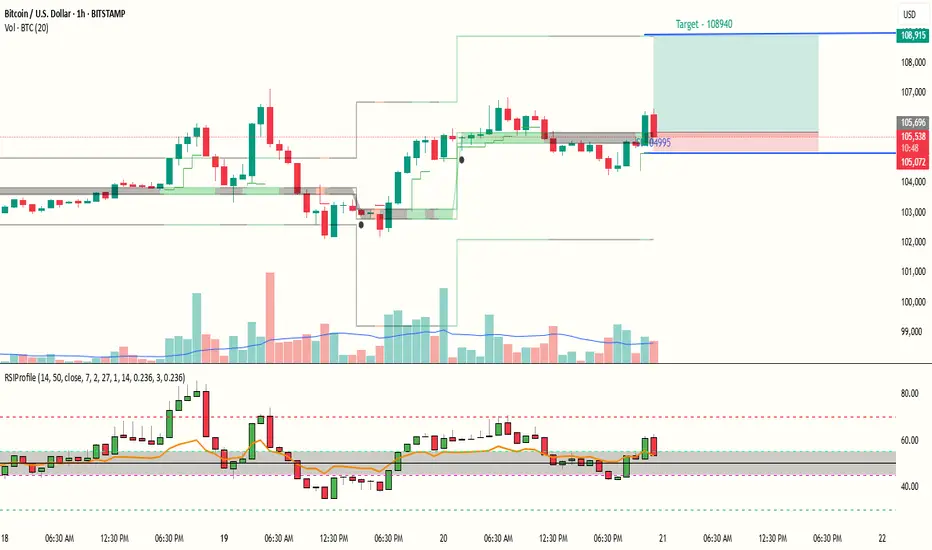
BTC ready for continuation of UP move with a reward ratio of 5RSI Profile shows a positive trend for BTCUSD and and risk reward ration is above 5. Also a Bullish triangle pattern seems to reach near complete on BTC Chart. Price is above RSI Point of Control, hence a small SL below POC and target is near the Value area High.
Entry near 105600
Target near 108940
Sl near 104995
RR : 5.16
PS : Above is only for Educational purpose and does not constitute any financial advice. Do your Own Research.
SBI Card is approaching the zone—upside potential of 15%+?NSE:SBICARD has approached the 200SMA on Daily chart and is not too far away from 50SMA on Weekly. As highlighted in the chart, we can see a confluence of support zone and FIB level.
A confirmation candle might be needed, but it looks like an interesting long setup, especially if 900 is retested and held. Target can be around ATH which is ~15-20% away.
Price action in this stock tends to be a little choppy, so best to be alert.

Venkeys: my bar-by-bar trade analysis from 1700-3100+Following is my bar-by-bar trade analysis of Venkeys, currently sitting at 80%+ ROI.
a. Entered NSE:VENKEYS thanks to the range breakout + RSI 60 breach, indicating momentum. Stop placed at around gap filling (1650). 50DMA was ~9% away from LTP.
b. Price saw a strong move on the upside on the next day with a sizeable gap-up. 2,000 psych level held + very strong volumes.
c. The next day, the price saw a strong rejection of higher levels, but it had held on to the gap up and closed above the prev candle's high. Not exiting here was a tough decision, but such trades don't come up often, and exiting too early may mean you leave far too much on the table. I'd moved my stop to gap-filling and subsequent 2100 rejection.
d. Price shook out weak hands by testing lower levels but showed a very strong upmove.
e. What follows are a few candles that signal exhaustion at higher levels including an inverted hammer. But by this point, I understood that Venkeys appears to have a history of showing price rejection after making a high and that a strong move might follow. The only way to catch on to this strong move would be to set a trailing stop and let the markets do the work. A stop was set to prev candle low (for partial qty) as I wanted to secure profits, too.
f. Trailing stop hit, booked partial quantity profits. Now let the rest of the position run. Potential gap retest possible, but booking partial profits helps you stay in the trade for longer. However, this can also make you hold on to a position for longer than you would have. So best to be strict.
g. Started showing signs of support after the dip.
h. Tried to breakout, but sellers stepped in making an inverted hammer pattern. But, this is more or less normal. Still holding.
i. Strong move after a doji. Staying alert as the price had just breached FIB level. This is where price had typically started showing exhaustion.
j. Observing the price movements carefully. Next round of selling around highs. The potential of a further move is still there, as the price has shown its personality. But placing a trail is important.
k. Holding position despite the sliding price. In hindsight, I might have waited a little longer than required. Exiting once the lows of the inverted hammers were broken could have been better.
l. News of China suspending the import of frozen seafood owing to COVID-19 traces emerges. Venkeys slides, and I'm cautious at this point. Trail hit as 2700 levels are rejected.
m. Strong move, but price remains sideways after that for the most part.
n. Yet another strong move, and now the price is above 3,000 psych level.
o. Still holding partial quantity with the intention to trail as long as the move lasts. I will update as the price moves...
This was compiled during the live market, so there's a chance that what I've said in points n. and o. has been negated by EOD.
I know the smallcase alphabets I've used are also used in EW analysis. My intention isn't to display any EW, but that was the easiest way of marking the candles for easy reference.
P.S. I used FIB channels to test how they work. They aren't exactly my entry or exit basis, but I will do a quick tutorial on them, too.
Hope this helps! Happy trading :)
