HSCL: A Classic Breakout Story in the MakingNSE:HSCL : A Classic Breakout Story in the Making
Price Action Analysis:
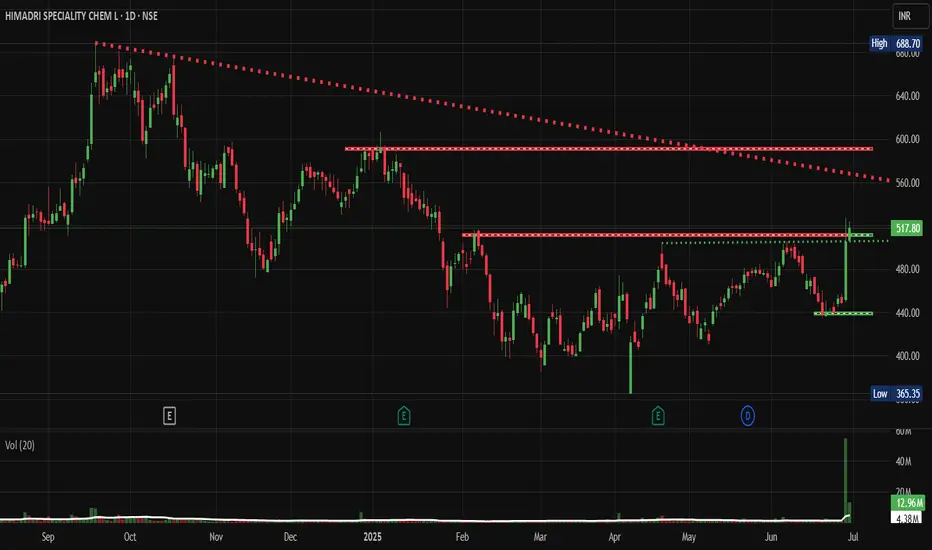
- Stock has formed a strong uptrend from September 2024 lows around 365 levels
- Current price of 517.80 represents a significant +41% move from the base
- Recent breakout above the 500 resistance level with strong volume confirmation
- Price action shows a classic accumulation pattern followed by a markup phase
Volume Spread Analysis:
- Significant volume spike visible in recent sessions (12.96M vs average 4.38M)
- Volume confirmation during breakout above 500 levels
- Accumulation pattern evident with higher volume on up days
- Volume trend supports the bullish price action
Base Formation & Key Levels:
- Primary Base: Formed between 400-520 levels from December 2024 to May 2025
- Secondary Base: 440-480 consolidation zone during March-April 2025
- Base Duration: Approximately 6 months of sideways consolidation
- Base Characteristics: Multiple retests of support levels with decreasing volatility
Key Support & Resistance Levels:
- Immediate Support: 480-500 zone (previous resistance turned support)
- Strong Support: 440-460 zone (multiple bounce levels)
- Major Support: 400 psychological level
- Immediate Resistance: 520-530 zone
- Next Resistance: 580-600 zone (measured move target)
- All-time High Resistance: 688.70
Technical Chart Patterns:
- Cup and Handle Pattern: Visible from October 2024 to June 2025
- Ascending Triangle: Formed during the consolidation phase
- Bullish Flag: Recent consolidation before the breakout
- Higher Highs and Higher Lows: Established uptrend structure
Trade Setup & Strategy:
Entry Strategy:
- Primary Entry: 515-520 on any pullback to the breakout zone
- Aggressive Entry: Current levels around 517-518
- Conservative Entry: Wait for retest of the 500 support level
- Scale-in Approach: 50% at 515, 30% at 505, 20% at 495
Exit Strategy:
- Target 1: 560-570 (Risk-Reward 1:2)
- Target 2: 600-620 (Risk-Reward 1:3)
- Target 3: 650-680 (Risk-Reward 1:4)
- Trailing Stop: Use 480 as a trailing stop once Target 1 is achieved
Risk Management:
- Stop Loss: 475-480 (below breakout support)
- Position Size: Maximum 2-3% of portfolio
- Risk per Trade: Not more than 1% of total capital
- Time Stop: Exit if no progress in 3-4 weeks
Position Sizing Guidelines:
- Conservative Investor: 1-1.5% portfolio allocation
- Moderate Risk: 2-2.5% portfolio allocation
- Aggressive Trader: 3-4% portfolio allocation (with tight stops)
- Swing Trading: 2% with wider stops at 460 levels
Fundamental & Sectoral Backdrop:
Company Overview:
- NSE:HSCL is a leading manufacturer of coal tar pitch and advanced carbon materials
- Key products include coal tar pitch, carbon black feedstock, and speciality carbons
- Strong presence in aluminium, graphite electrode, and speciality chemical sectors
Sectoral Dynamics:
- The speciality chemicals sector is showing strong growth momentum
- Increased demand from the aluminium and steel industries
- The government focus on Make in India and import substitution
- Rising demand for advanced materials in electric vehicles and renewable energy
Fundamental Catalysts:
- Capacity expansion plans and new product launches
- Strong demand from end-user industries
- Improved margin profile due to product mix optimization
- Debt reduction and improved financial metrics
- ESG initiatives and sustainable product development
Market Conditions:
- Overall market sentiment is positive for chemical stocks
- Sectoral rotation favours speciality chemicals
- Export opportunities in global markets
- Raw material cost stabilization supporting margins
Risk Factors:
Technical Risks:
- Failure to sustain above 500 levels could lead to a retest of the 440 support level
- High volatility is expected given the breakout nature
- Overbought conditions in the short term may cause profit booking
Fundamental Risks:
- Raw material price volatility (coal tar and petroleum products)
- Environmental regulations affecting production
- Competition from global players
- Economic slowdown affecting end-user demand
- Currency fluctuation impact on exports/imports
My Take:
My analysis suggests a positive technical setup with strong breakout potential, supported by favourable sectoral trends and improving fundamentals. However, proper risk management and position sizing remain crucial for successful execution.
Keep in the Watchlist.
NO RECO. For Buy/Sell.
📌Thank you for exploring my idea! I hope you found it valuable.
🙏FOLLOW for more
👍BOOST if you found it useful.
✍️COMMENT below with your views.
Meanwhile, check out my other stock ideas on the right side until this trade is activated. I would love your feedback.
Disclaimer: "I am not a SEBI REGISTERED RESEARCH ANALYST AND INVESTMENT ADVISER."
This analysis is intended solely for informational and educational purposes and should not be interpreted as financial advice. It is advisable to consult a qualified financial advisor or conduct thorough research before making investment decisions.
Himadrispeciality
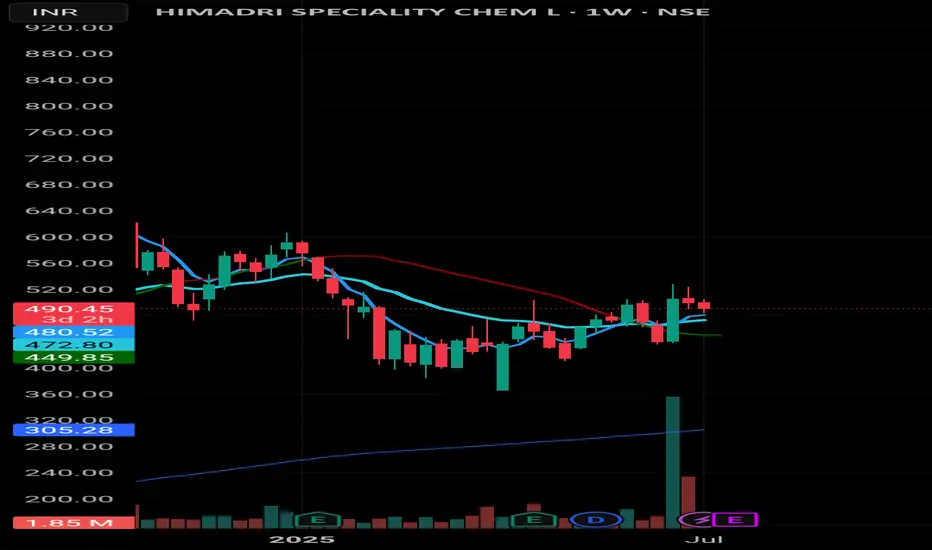
Himadri Speciality Chem – Weekly Chart Update📊 Himadri Speciality Chem – Weekly Chart Update
• Strong volume breakout recently, with price hovering around 480–490 zone
• Price facing resistance near 200 EMA (red line) at ~487.70
• Support zones:
– 472.55 (20 EMA)
– 449.70 (50 EMA)
• Weekly candle formation hints at indecision. Watch next move for breakout or fade.
🎯 Plan Ahead:
If sustains above 488–490, potential upmove towards 520+
If breaks 472, expect retracement till 450–455 range
🔁 Trend is your friend, till it bends.
Not financial advice—just chart reading. Stay sharp. 💹
#Himadri #SwingTrade #PriceAction #VolumeBreakout #NSE #WeeklyAnalysis #TechnicalSetup
HSCL Trading Above Fresh Weekly Demand ZoneHSCL is currently trading at ₹481.15, slightly above its demand zone between ₹475.4 and ₹441.1, identified on 23rd August 2024. This fresh zone has not been tested, suggesting potential buying interest if the stock revisits this range. Investors may watch for a pullback to these levels, which could present a buying opportunity with strong support.
Disclaimer: This analysis is for informational purposes only and should not be considered as financial advice. Please conduct your own research or consult a financial advisor before making any investment or trading decisions.

himadari spltycmp : 255
might retest 235-240 levels
avoid longs for short term.
q2 results in focus
for educational purpose only

Bullish on Himadri Speciality Chemical for Short TermThe stock hit a fresh 52-week high of 108.85 on 6th Dec 2022, but failed to hold on to the momentum and falling about 17%.It bounced back after hitting a low of 80.35 in 27th Feb 2023 on the daily charts.A double-bottom pattern on the daily charts makes it an attractive buy.
It gave a breakout from wedge pattern on 10.03.23 rising 3.17%. It then corrected by 2.09% the succeeding day. Today i.e. on 14.03.2023 it rose 1.4% to 90.40 and closed above the resistance trendline again.
In terms of price action, the stock is trading well above most of the short-term moving averages. But it is hovering just below its 50 and 200 day MA of 90.85 & 90.95 respectively.
RSI is above 50 and MACD is above its center and signal line, this is a bullish indication.
Based on these technical indicators, it is expected that the stock's price will continue to rise towards the assigned targets, with a recommended stop loss at 88 on a closing basis.

HIMADRI SPECIALITY SWING TRADE SETUP Swing trade setup for Himadri chemicals, high rtr, moving averages also supporting and volumes are giving good confirmation. Trade at your own risk shared only for educational purposes.

Himadri Speciality forming probable flag and pole patternHimadri Speciality is forming flag & pole Pattern in a daily chart frame.
If today's candle close above 88 range, then we can see a clear breakout and it should confirmed by next day candle.
After this breakout stock will test 93 range first, once it break 94 range, it has a potential to reach 112 range as per the pattern.
Ideal SL will be below 78.
Wait for supply zone breakout for the confirmation.
This is just a View, not recommendation to trade, do your own analysis before taking any trade.
NSE:HSCL

HSCL - Weekly Breakout above 2 years congestion area - Target 85Scrip: Himadri Specialty Chemical Ltd (HSCL).
Setup: Weekly Breakout above 2 years range
Call: Buy
Entry: 60-67
Stoploss: This is a positional and investment call for a few months. Stoploss needs to be determined as per risk profile.
In case of a market crash, more positions can be added at lower levels in the range of 40-45.
Target 1 - 85
Target 2 - 105
Timeline - Few Months.
Valuations: Price to BV - 1.53 (Book Value - 43.5)
This is a small cap company and with a bit of risk involved. Please trade and invest based on your due diligence and risk profile.
I am not a SEBI registered analyst, please trade and invest based on your own research and analysis.

MultibaggerCounter has given breakout from 2 years consolidation. It has potential to become multibagger. SL 49 on daily closing basis. Buy at opening.
Disc : It's not an investment advise to buy or sell

Himadri Speciality Chemicals-Trend Change BreakoutHimadri Speciality Chemical is primarily engaged in the manufacturing of carbon materials and chemicals. It is the No.1 coal pitch manufacturer in India and is the only company to manufacture advanced carbon material in India. It is also the largest player of Naphthalene and SNF in India.
Manufacturing Capabilities
Capacity :-
Coal Tar Distillation - 5,00,000 MTPA
Carbon Black - 120,000 MTPA
Specialty Carbon Black - 60,000 MTPA
SNF - 68,000 MTPA

HSCL - can long here for higher gainsHSCL looks really good on every timeframe.
Operating above 20 EMA on monthly timeframe . . . operating in a range
expecting 2X-3X gains in 1 yr time frame
Target 1: 100
Target 2: 150

HSCL | Himadri Specialty Chemicals | Multi-year breakoutNSE:HSCL
HSCL has given a multi-year breakout on weekly charts with good volume
Note : For EDUCATIONAL purpose only

HSCL Cup and Handle formation about to break out.HSCL has been consolidating since the last 2 years in the range of Rs 40 to 63. It seems to have formed a Cup and Handle pattern which will break out above Rs 63.
The actual rally will start after breaking the rectangular channel resistance at 63 and will then reach to the above mentioned long term targets .
The technical indicators seem to have bottomed out on monthly time frame and have turned bullish on daily and weekly time frames.
This is totally an EV (Electric Vehicles) play before the current budget is presented.
This chart is only for information purposes and it is not an investment advice.

HSCL- Ready To Shot UpChemical stocks are in boom and very bullish.
Buy-Above 50
Sl-45
Target- 60 70 100
Midterm-Long Term
See this stock in monthly timeframe.

#HSCL... Morning Star pattern .. swing trade ideaHSCL is forming morning star pattern on the daily chart..
Ofcourse half the trading session is left and confirmation only will come after today's closing..
But keep an eye..can be easy 20% short term profit here
HSCL also has multibagger potential.. see my previous ideas in related links section

Himadri Speciality, EMA50 > EMA200, with Volume.on daily chart, EMA 50 has crossed EMA 200, DMA50 > DMA100
Also Triangle Pattern on Daily, Weekly, Monthly basis. backed by Volume.

Himadri Speciality : INVESTMENT opportunity Accumulation 50 to 80
Can expect 3x returns
Based on historical analysis

Himadri Speciality,Symmetrical TriangleHSCL, it gave symmetrical triangle breakout, enter on buy side with SL below trendline.

HIMADRI SPECIALITY
HFCL is generating a symmetrical triangle pattern and ready for the breakout.
Entry above 54
Note that this chart is posted by me only for educational purposes, feel free to share your feedback/queries.

