HINDUNILVR: Smart Money Accumulation Zone After CHoCH?📘 HINDUNILVR (HUL) — Technical Analysis | Structure Shift & Golden Retracement Setup
(Timeframe: Daily)
HINDUNILVR is currently trading around ₹2,265 after a prolonged corrective phase.
The chart reflects a Change of Character (CHoCH) followed by a controlled retracement into a high-probability demand zone, where the next directional move is likely to emerge.
🔍 Market Structure & Price Action
The stock previously witnessed a strong bullish extension, reaching the 113%–128% Fibonacci extension zone, indicating an overextended move.
Post extension, price showed loss of bullish momentum, leading to a CHoCH — a clear signal of shifting market control.
CHoCH highlights early trend transition and often leads to range-bound or corrective price action, rather than an immediate trend reversal.
📌 CHoCH helps traders prepare for structural transitions before confirmation from higher highs.
📐 Fibonacci & Wave Context
The decline from point A to B appears corrective, not impulsive.
Price has now entered the Golden Retracement Zone (50%–78%) of Wave A.
This zone is typically where Wave B or Wave 2 attempts to develop.
Institutional participants often accumulate positions here due to favorable risk–reward.
📌 Failure to hold this zone often results in a deeper correction or trend reversal.
🎯 Key Levels from the Chart
Major Demand Zone: ₹2,230 – ₹2,200
Invalidation Level: Day close below ₹2,200
First Target: ~₹2,630 (≈ 78% retracement of Wave AB)
Second Target: ₹2,826 – ₹2,888
🧭 Trading Strategy (Swing / Positional)
Look for long opportunities only inside the ₹2,230–₹2,200 zone.
Prefer confirmation signals such as:
– Bullish rejection wicks
– Higher-low formation
– Minor CHoCH on lower timeframes
Avoid aggressive entries without confirmation.
🛑 Risk Management
Strict stop loss: Day close below ₹2,200
A close below this level indicates weak demand and opens the risk of extended downside correction.
Partial profit booking recommended near Target 1.
Trail stop aggressively if price sustains above ₹2,630.
📚 Educational Notes
Golden Retracement (50%–78%) is where institutions seek value-based entries.
CHoCH ≠ Trend Reversal — it signals momentum loss, not instant bearishness.
Confirmation always comes from structure + demand holding, not prediction.
🔮 Probable Scenarios
Bullish Case:
Holding above ₹2,200 → Base formation → Gradual recovery toward ₹2,630 → ₹2,826–2,888.
Bearish Case:
Day close below ₹2,200 → Demand failure → Deeper corrective phase.
📌 Conclusion
HINDUNILVR is positioned at a critical inflection zone.
Risk is clearly defined, while upside potential remains asymmetric.
This is a wait-for-confirmation accumulation setup, not a chase trade.
⚠ DISCLAIMER
I am not a SEBI-registered analyst.
This analysis is for educational purposes only and should not be considered investment advice.
Always use your own analysis and risk management.
HINDUNILVR

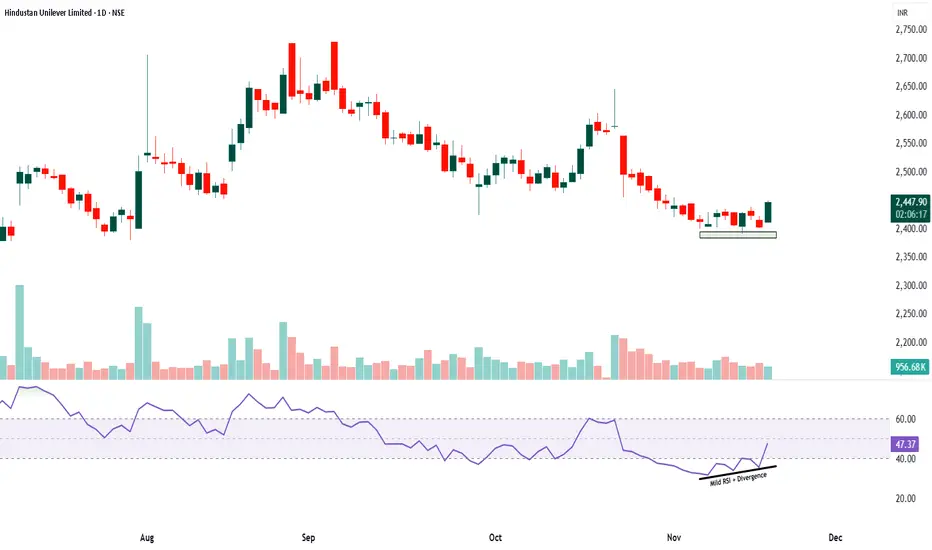
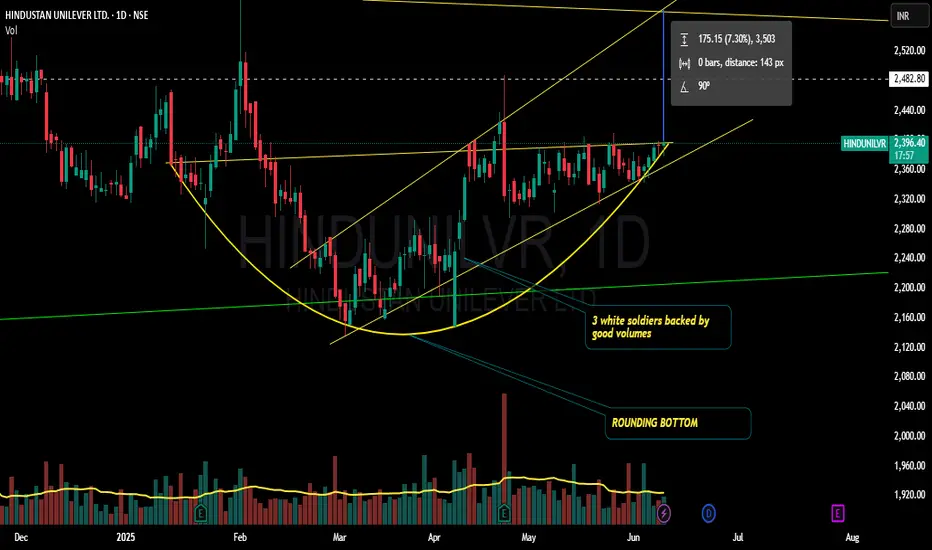
HINDUNILVR - longThe chart shows a mild RSI divergence where the price made a lower low near the 2400 zone while RSI formed a higher low, indicating that the selling momentum is reducing even though the price slipped slightly. This zone also aligns with a strong weekly support area where the stock has earlier taken reversal, adding more weight to the possibility of a bounce from this level. Volumes have remained on the lower side during the recent fall, suggesting that the decline was not driven by strong selling pressure. The latest green candle near support with improving RSI momentum indicates that buyers are slowly stepping in.
A possible trade plan can be to take entry above 2460 once the price shows continued strength. A safe stop loss can be placed below 2385, just under the weekly support zone. The first target can be around 2520, where minor resistance exists, and the second target can be around 2580 if momentum continues to build. This setup works best if RSI moves above 50 and volumes start rising on bullish candles. This is for educational purposes only.
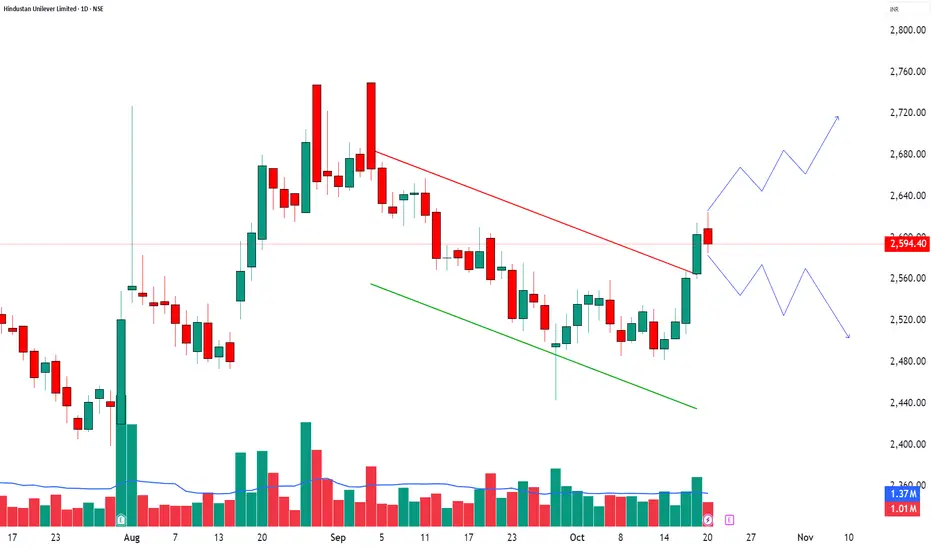
HINDUNILVR – Bulls Resting, Bears Watching💹 Hindustan Unilever Ltd (NSE: HINDUNILVR)
Sector: FMCG | CMP: ₹2,610.80 | View: Neutral-to-Bullish Zone Reaction Setup
Key Levels:
Resistance: 2618/2641/2657
Support: 2578/2562/2539
STWP Trade Analysis:
A Retested Demand zone: 2509.20 – 2482.30
Stock has moved up almost 4% in the last 4 days.
The bulls seem to have taken a rest at these levels.
Two possible scenarios:
🟢 Scenario 1 – Bulls Take Charge: I will buy @ 2624.70 with a stop at around 2583.45
View: Bullish continuation setup if price sustains above 2620 zone.
🔴 Scenario 2 – Bears Take Charge: I will sell at 2585.60 with a stop at around 2626.85
View: Reversal setup if price fails to hold above 2618 and selling pressure builds.
───────────────────────────────────────────────
⚠️ **DISCLOSURE & DISCLAIMER (SEBI-Compliant)**
───────────────────────────────────────────────
📘 **Purpose:**
This content is created **solely for educational and informational purposes** to help readers understand market structure, price action, and technical analysis.
It does **not constitute investment advice**, research recommendation, or a solicitation to buy or sell any security.
👤 **Author Disclosure:**
The author is **not a SEBI-registered investment adviser or research analyst.**
All chart studies, price levels, and observations are based on publicly available data (e.g., **NSE India**, **TradingView**) and are presented purely for **learning illustration**.
📊 **Position Status:**
No active position in * * at the time of publication.
“The author may sometimes trade in the securities discussed, but such trades are independent and shared here only for educational understanding.”
⚠️ **Risk Disclosure:**
Trading and investing involve financial risk. Market movements can be unpredictable, and losses may exceed invested capital.
Readers are strongly advised to consult a **SEBI-registered investment adviser** before making any trading or investment decisions.
🧠 **Responsibility Clause:**
By engaging with this post, you acknowledge that you are **solely responsible for your own trading or investment decisions**, and that this content is intended only for **market education and awareness**.
───────────────────────────────────────────────
💬 **Did You Find This Useful?**
If this analysis helped you understand price structure or market psychology better:
🔼 **Boost** to support transparent & structured financial education.
✍️ **Comment** your insights, observations, or questions — let’s learn together.
🔁 **Share** this post with learners and aspiring traders who value discipline.
📚 **Follow stwp** for more structured, educational breakdowns on stocks & setups.
🚀 *Stay Calm. Stay Clean. Trade With Patience.*
💡 *Trade Smart | Learn Zones | Be Self-Reliant.*
───────────────────────────────────────────────
SBIN 1D Time frameCurrent Price (approx): ₹864
52-Week Low: ₹680
52-Week High: ₹880.50
Daily Chart Explanation
On the 1-day timeframe, SBIN is moving near its upper range, close to the recent high. This means the stock is strong but also facing heavy resistance.
Trend: Uptrend overall (higher highs and higher lows).
Momentum: Price is consolidating near resistance, showing hesitation.
Candles: Recent candles show wicks near the top, which means sellers are active near ₹880.

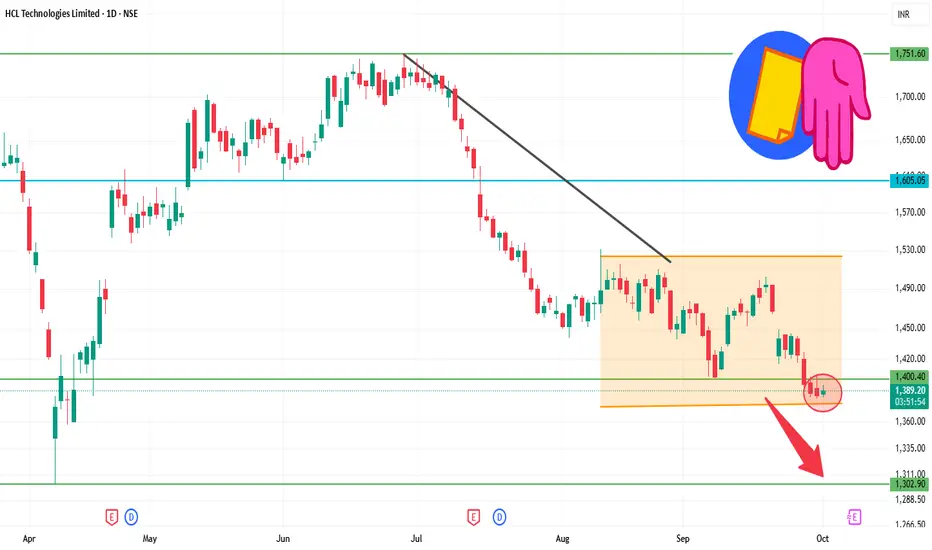
HCLTECH 1D Time frameOpening Price: ₹1,387.40
Closing Price: ₹1,387.40
Day Range: ₹1,383.10 – ₹1,395.00
Previous Close: ₹1,387.40
📉 Trend Analysis
Short-Term Trend: Bearish — The stock is trading below key moving averages, confirming the bearish trend.
Medium-Term Trend: Neutral — The stock is in a consolidation phase, characterized by lower highs and lower lows.
Long-Term Trend: Neutral — No significant trend identified; the stock is trading within a range.
HDFCBANK 1D Time framePrice Action
Current Price: ₹967.10 (approx)
Day’s Range: ₹965 – ₹970
52-Week Range: ₹806.50 – ₹1,018.85
🔹 Support & Resistance
Immediate Support: ₹960 – ₹958
Next Support: ₹954 – ₹950
Immediate Resistance: ₹970 – ₹975
Higher Resistance: ₹980

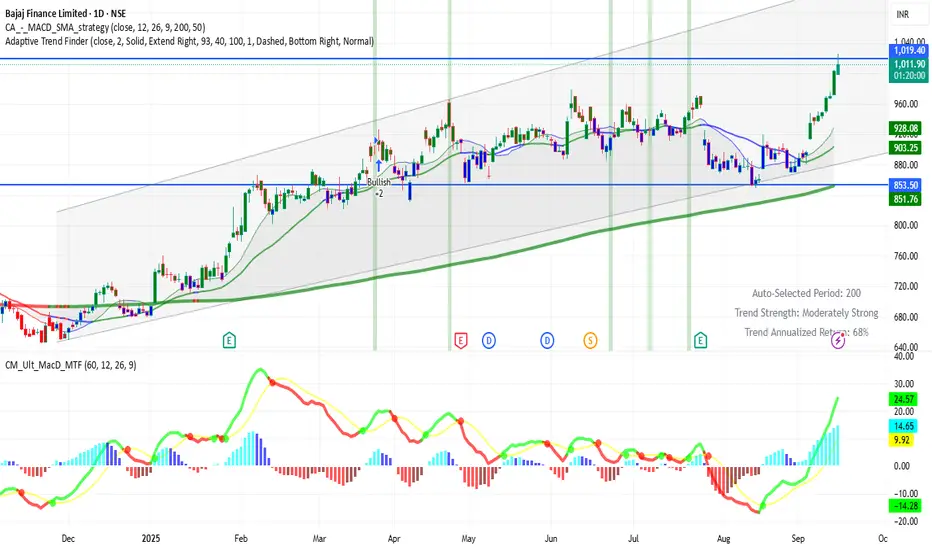
BAJFINANCE 1D Time frame
Current Price: ₹1018 (approx)
Day’s Range: ₹998 – ₹1,025.70
Previous Close: ₹970.25
🔹 Support & Resistance
Support 1: ₹981 – ₹960
Support 2: ₹947 – ₹934
Resistance 1: ₹1,030
Resistance 2: ₹1,049
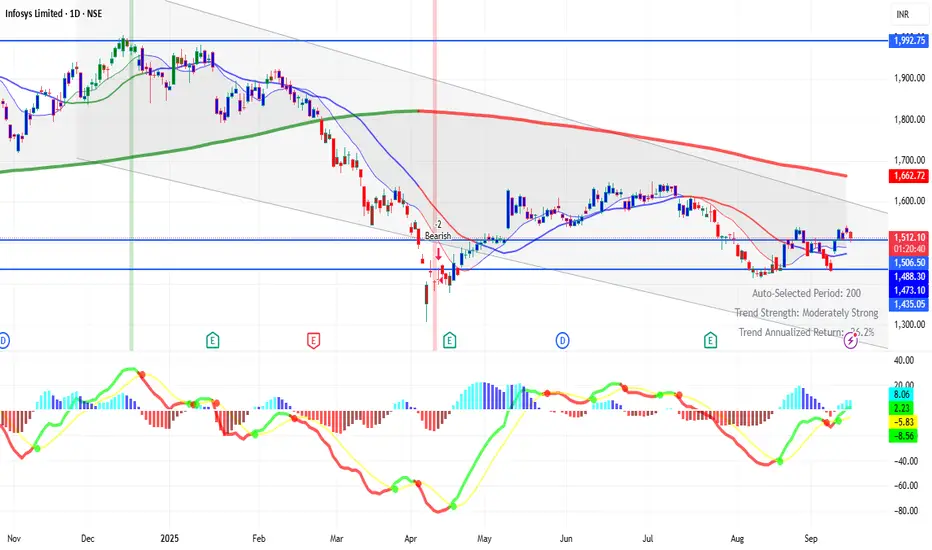
INFY 1D Time frameCurrent Price: ₹1507 (approx)
Day’s Range: ₹1507 – ₹1543
Previous Close: ₹1509.10
🔹 Support & Resistance
Support 1: ₹1500
Support 2: ₹1490 – ₹1470
Resistance 1: ₹1539 – ₹1552
Resistance 2: ₹1560 – ₹1570
HINDUSTAN UNILEVER LTD – Technical Analysis________________________________________
🧠 HINDUSTAN UNILEVER LTD – Technical Analysis
Ticker: NSE: HINDUNILVR | Sector: FMCG
Current Price: ₹2,521.20 ▲ (+3.44% on July 31, 2025)
Technical View: ⭐⭐⭐⭐ | Chart Pattern: Volume-Driven Range Breakout
________________________________________
Latest News & Developments
Hindustan Unilever (HUL) reported strong Q1 FY26 results, with standalone net profit rising 7.6% YoY to ₹2,732 crore and consolidated profit up ~6%. Revenue grew ~4–5% YoY, aided by a rural demand rebound and volume-led gains in home care and beauty segments. While demand recovery is still gradual and margin guidance has been trimmed, the company is ramping up investments for future growth. A key structural change includes the demerger of its Kwality Wall’s ice-cream business by FY26-end. Leadership transition is also underway, with Priya Nair set to take over as CEO & MD from August 1, 2025. Shares surged 3.5% on July 31 to ₹2,521.85, outperforming the market.
________________________________________
Technical Analysis & Chart Pattern
Hindustan Unilever Ltd (HUL) has broken out above a key resistance zone of ₹2,440–2,445 on the daily chart, supported by strong volume and a bullish candle. This move ends the prior consolidation phase between ₹2,136–2,602. Momentum indicators such as RSI (~70), MACD, and moving averages show a bullish bias. If the price sustains above ₹2,500, the stock may trend toward resistance levels at ₹2,573, ₹2,625, and ₹2,702. Key support levels lie at ₹2,445, ₹2,368, and ₹2,316.
________________________________________
Trade Analysis (SEBI-Compliant | Educational Purpose Only)
As per the chart structure, the stock has shown a breakout above the ₹2,440–2,450 zone on strong volume, currently near ₹2,521. If momentum sustains, potential price zones to watch are ₹2,575–2,625 in the near term and ₹2,700+ in the medium term. A logical risk level could be around ₹2,395 or near the breakout point of ₹2,440.
________________________________________
Technical & Sentiment Snapshot
The stock recently broke out with strong volume, indicating accumulation post-consolidation. A pullback toward ₹2,440–2,430 may test the breakout zone, while a move to ₹2,360–2,316 could signal range re-entry. Sustained trade above ₹2,500–2,520 may indicate trend continuation. Market participants are watching volume behaviour on dips and potential sentiment shifts under new leadership. Key risks include broader market weakness, margin pressures, and rural/urban demand trends.
________________________________________
Educational Insight for Learners
A classic breakout occurs when a stock trades within a defined range (support and resistance) and then moves sharply beyond that range with strong volume. To identify such setups, observe the range boundaries, wait for a confirmed close outside the range, and ensure volume rises on the breakout. Entry is ideally near the breakout, with a stop just inside the range and targets based on the range height. The recent price action in HUL aligns well with this rectangle breakout concept — a valuable pattern for learners to study.
________________________________________
⚠️ Disclaimer & Educational Note
This content is strictly for educational and research purposes only. I am not a SEBI-registered advisor, and no buy/sell recommendations are being provided. All insights are based on personal analysis and experience and are not financial advice.
📘 This setup illustrates how combining price action (candlesticks), support/resistance zones, volume, and indicators like RSI or MACD can help build conviction in trades. However, trading—especially in derivatives like options—involves high risk, and losses can exceed the initial investment.
👉 Always do your own research and consult a SEBI-registered advisor before taking any position.
👉 Use strict risk management and only trade with capital you can afford to lose.
The author assumes no liability for any losses incurred.
By engaging with this content, you agree to these terms.
________________________________________
💬 Found this helpful?
Drop your thoughts, questions, or insights in the comments below ⬇️ — let’s learn together!
🔁 Share this post with your trading friends and community — help them discover clean charts, structured setups, and zone-based learning.
✅ Follow simpletradewithpatience for clear setups, educational content, and a no-nonsense approach to price action, supply-demand zones, and risk-managed trades.
🚀 Trade with patience. Trust your charts. Stay clear-headed.
Because the goal is not just to trade — it's to trade better.
Be Self-Reliant | Trade with Patience | Learn with Charts & Zones 📊
________________________________________

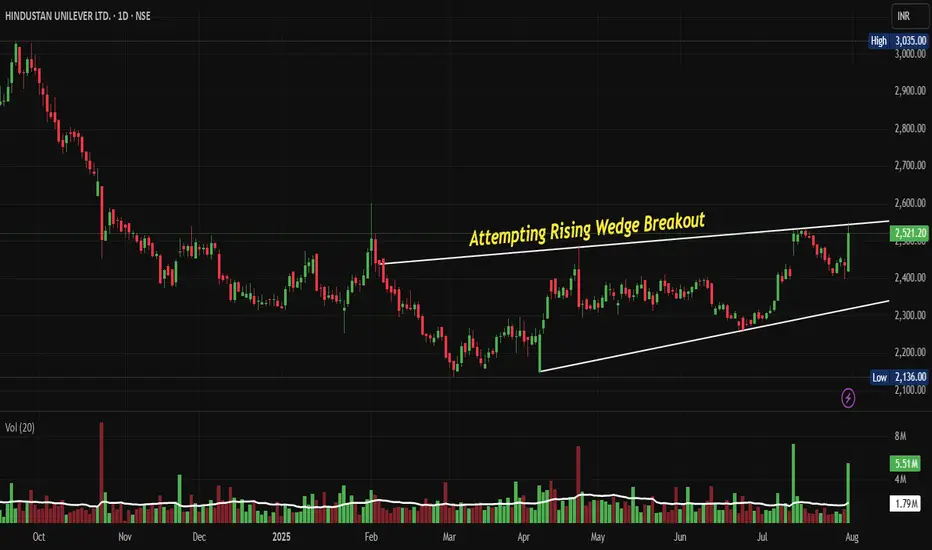
HINDUNILVR: Attempting Rising Wedge Breakout Post Q1 FY 26NSE:HINDUNILVR Attempting Rising Wedge Breakout: A Technical Revival Story Worth Watching Post Decent above Estimate Volume Growth and Q1 FY26 Results.
Price Action:
• Trading within a well-defined rising wedge pattern from February 2025 to July 2025
• The stock experienced a significant decline from its peak around ₹3,035 in September 2024 to a low of ₹2,136 in March 2025
• Currently trading at ₹2,521.20 with a gain of ₹83.80 (+3.44%)
• The stock appears to be attempting a breakout from the upper trendline of the rising wedge
Volume Spread Analysis:
• Volume has been relatively subdued during the consolidation phase within the wedge
• Recent sessions show increased volume activity with 5.51M shares traded, indicating renewed interest
• The volume pattern suggests accumulation during the lower levels of the wedge formation
• Volume spike accompanies the current breakout attempt, confirming the move
Key Technical Levels:
Key Support Levels:
• Immediate support: ₹2,420-₹2,450 (recent consolidation zone)
• Strong support: ₹2,300-₹2,350 (lower trendline of the rising wedge)
• Critical support: ₹2,136 (52-week low established in March 2025)
Resistance Levels:
• Immediate resistance: ₹2,550-₹2,580 (upper trendline breakout zone)
• Next resistance: ₹2,700-₹2,750 (previous swing highs)
• Major resistance: ₹3,035 (52-week high from September 2024)
Technical Patterns:
• Rising Wedge Pattern: A bearish reversal pattern that has been forming since Feb 2025
• Breakout Attempt: The stock is testing the upper boundary of the rising wedge with increased volume
• Higher Lows Formation: Despite the wedge pattern, the stock has been making higher lows since March 2025
Trade Setup:
Entry Strategy:
• Primary Entry: On sustained breakout above ₹2,550 with volume confirmation
• Secondary Entry: On pullback to ₹2,480-₹2,500 after successful breakout
• Aggressive Entry: Current levels around ₹2,520 for short-term traders
Exit Levels:
• Target 1: ₹2,680-₹2,700 (8-10% upside potential)
• Target 2: ₹2,850-₹2,900 (15-18% upside potential)
• Target 3: ₹3,000-₹3,050 (20-25% upside potential)
Stop-Loss Strategy:
• Conservative: ₹2,350 (below the rising wedge support)
• Moderate: ₹2,420 (below immediate support zone)
• Tight: ₹2,480 (for breakout trades)
Position Sizing:
• Conservative investors: 2-3% of portfolio allocation
• Moderate risk appetite: 4-5% of portfolio allocation
• Aggressive traders: 6-8% of portfolio allocation
Risk Management:
• Risk-Reward Ratio: Maintain a minimum 1:2 ratio for all entries
• Trailing Stop: Implement a 5-7% trailing stop after 10% gains
• Partial Profit Booking: Book 30% profits at Target 1, 40% at Target 2, and hold 30% for Target 3
Sectoral and Fundamental Backdrop:
FMCG Sector Overview:
• BSE FMCG index was up 1 per cent, as compared to a 0.5 per cent decline in the BSE Sensex
• The FMCG sector is showing resilience amid broader market volatility
• Rural demand recovery is expected to support sector growth in the coming quarters
Financial Performance:
• TTM Revenue: 63,928 Cr, TTM Profit: 10,827 Cr
• The company has delivered a poor sales growth of 10% over the past five years
• Annual revenue for March 2025 reached Rs 63,121 Crore, up 2%. Net profit rose 3.8% to Rs 10,671 Crore
Valuation Metrics:
• HUL's stock trades at a Price-to-Earnings (P/E) ratio around 55.70x, slightly below its historical averages (~61x over 5 years)
• Stock is trading at 12 times its book value
• Market Cap: 5,92,476 Crore (down -6.82% in 1 year)
Business Fundamentals:
• Promoter Holding: 61.9%
• Strong brand portfolio across multiple FMCG categories
• Extensive distribution network covering both urban and rural markets
• Urban markets contribute 60 per cent to HUL's sales, while rural markets comprise the rest
Recent Developments:
• Motilal Oswal analysts believe that volume growth for HUL has reached its lowest point and foresee a gradual recovery in volumes during FY25
• Brokerages tracked by Business Standard estimate HUL's net profit to decline 1.2 per cent year-on-year (Y-o-Y) on average, to ₹2,540.6 crore
• The company is expected to benefit from improving rural demand and premiumization trends
My Take:
• HUL remains a defensive play in the FMCG space with strong market positioning
• The technical breakout attempt coincides with expectations of volume recovery
• Long-term investors can consider accumulating on dips while traders can play the breakout momentum
Keep in the Watchlist and DOYR.
NO RECO. For Buy/Sell.
📌Thank you for exploring my idea! I hope you found it valuable.
🙏FOLLOW for more
👍BOOST if you found it useful.
✍️COMMENT below with your views.
Meanwhile, check out my other stock ideas on the right side until this trade is activated. I would love your feedback.
Disclaimer: "I am not a SEBI REGISTERED RESEARCH ANALYST AND INVESTMENT ADVISER."
This analysis is intended solely for informational and educational purposes and should not be interpreted as financial advice. It is advisable to consult a qualified financial advisor or conduct thorough research before making investment decisions.
HINDUNILVR – TECHNICAL ANALYSIS________________________________________
📈 HINDUNILVR – TECHNICAL ANALYSIS
📆 Date: July 8, 2025 | ⏱ Timeframe: Daily Chart
🔍 Educational Breakdown – For Learning & Study Use Only
________________________________________
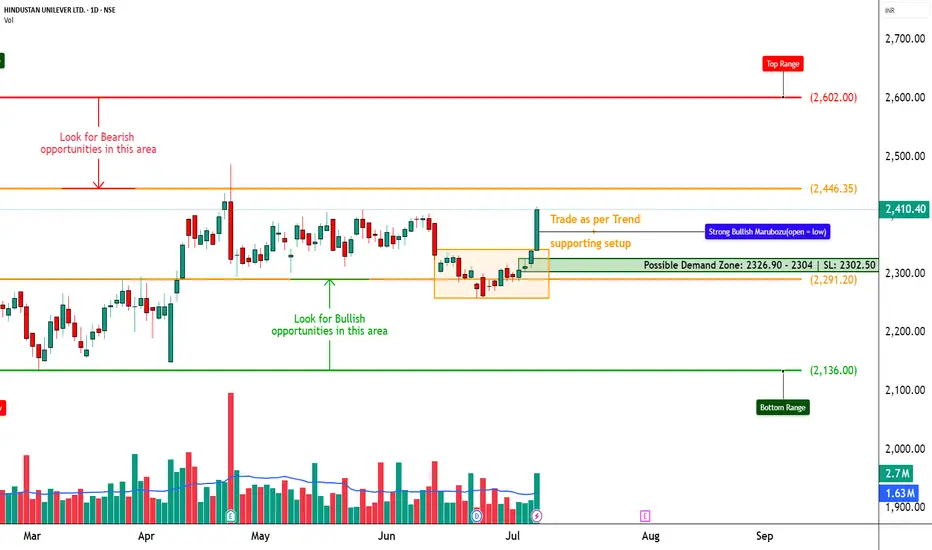
🔹 Price Action Zones
• 🔴 Top Range: 2602
• Resistance: 2437.07 – 2463.73 – 2511.77
• 🟢 Bottom Range: 2136
• Support: 2287.67 – 2314.33 – 2362.37
________________________________________
🔹 Chart Pattern: ✅ Bullish Marubozu Breakout
Price bounced from a demand zone near 2326.90 – 2304| SL: 2302.50 with a powerful Marubozu candle and reclaimed structure strength. This breakout aligns with STWP’s HNI setup and suggests the beginning of a strong bullish leg.
________________________________________
🔹 Reversal Candlestick Patterns:
✅ Bullish Marubozu
✅ Strong follow-through near support
✅ High conviction breakout from base – Open = Low
________________________________________
🔹 Volume Footprint:
✅ Volume spiked to 2.7M (vs average 1.63M)
✅ Indicates institutional participation backing the breakout
🚨 Watch for continuation volume above 2415 to confirm momentum
________________________________________
🔹 Trend Bias: ✅ Bullish
Clear bullish trend forming after breakout. Supports are holding, and resistance levels are now being tested with strength.
________________________________________
📌 What’s Catching Our Eye:
• STWP HNI Setup triggered at 2400–2415 range
• Breakout above strong support near 2300–2320
• OI Data and Option Chain analysis supports upward continuation
________________________________________
👀 What We’re Watching For:
• Sustained close above 2415 = bullish continuation
• Option build-up hints at possible follow-through toward higher zones
• Strong CE activity at 2420, 2440, and 2460 levels
________________________________________
🔹 OPTION CHAIN ANALYSIS – KEY TAKEAWAYS
💥 CALL Side (Bullish Builds):
• 2420 CE: 40.05 – 📈 OI up +158%, Long Build-Up
• 2440 CE: 31.25 – 📈 OI up +182%, Long Build-Up
• 2460 CE: 24.50 – 📈 OI up +345%, Long Build-Up
• 2500 CE: 14.45 – 📈 OI up +22%, Long Build-Up
🚀 Indicates participants are positioning for extended upside toward 2460–2500
📉 PUT Side (Writers in Control):
• 2300 PE: Down -60%, Short Build-Up
• 2400 PE: Down -52%, Short Build-Up
💡 Suggests confidence that price will hold above 2400
🧠 Conclusion from OI Data:
Strong bullish sentiment — Call Writers/Buyers increasing exposure at higher strikes, Puts being shorted. Volume + OI = directional strength.
________________________________________
⚠️ Risks to Watch:
• Close below 2390–2395 = early weakness sign
• Bearish divergence + volume fade risk
• Watch 2460–2512 for rejection
________________________________________
🔮 What to Expect Next:
• ⚡ Price retesting 2460 zone likely
• 🔄 Pullbacks toward 2395–2405 may offer low-risk re-entry
• ⚠️ Watch for spikes in volatility near 2500
________________________________________
📊 Trade Plan (Educational Only – Based on Logic + Volume Confirmation)
🔼 Breakout Long Setup
• Entry: Above 2415
• Stop Loss: 2339.30
• Risk–Reward: 1:1 to 1:2 +
📌 Why:
• Bullish Marubozu + Volume
• OI Long Build-Up at 2420–2460
• STWP HNI Setup alignment
🔁 Pullback Long Setup
• Entry Zone: 2395–2400
• Stop Loss: 2365
• Risk–Reward: 1:1 to 1:2 +
📌 Why:
• Breakout retest zone
• Tight SL with continuation logic
🔽 Bearish Setup (Only on Failure)
• Entry: Below 2360
• Stop Loss: 2410
• Risk–Reward: Flexible (trader-defined)
📌 Why:
• Only valid on strong breakdown with volume
• Reversal below structure
________________________________________
📊 Option Trade Ideas – For Learning Purpose Only
🔼 Best CE (Bullish Bias)
➡️ 2420 CE @ 40.05
• Risk–Reward Potential: 1:1 to 1:2+
🛑 SL: 26
📌 Why: Clean momentum zone, well-aligned with breakout
🟡 Alternate CE (Momentum Extension)
➡️ 2440 CE @ 31.25 – if expecting further move toward 2490–2510
• Slightly lower Delta, higher risk-reward
🔽 Best PE (Only if Breakdown)
➡️ 2400 PE @ 34.40
• Use only below 2390 with high-volume reversal
• Risk–Reward Potential: 1:1 to 1:2 +
🛑 SL: 21
________________________________________
❌ Invalidation Triggers:
• Daily close below 2360
• Long unwinding on CE strikes
• PE Long Build-Up + Volume = Bearish Shift
________________________________________
⚠️ Disclaimer:
This analysis is for educational purposes only.
“STWP HNI Setup” is a proprietary internal model shared for study and learning.
STWP is not a SEBI-registered advisor.
This is not a buy/sell recommendation.
Please consult your financial advisor before taking any action.
STWP is not responsible for trading decisions based on this post.
________________________________________
💬 Found this helpful?
Did the STWP HNI Setup help you anticipate the move?
💭 Drop your thoughts in the comments ⬇️
🔁 Share this with fellow traders
✅ Follow STWP for volume-based, logic-driven setups
🚀 Be Self-Reliant | Trade with Patience | Learn with Logic
________________________________________
Hindunilvr longing for a breakout??!!Chart patterns inflict me the above titled opinion
Breakout can be expected as it has not breached the low made on 25th april 2025 and has been consistently making higher highs and higher lows(seen clearly on hourly charts)
Entry after the breakout.. ...
Godrejcp also seen for a up move!!!!
will update once it breaks out!!!!
Thank you.
This is just my opinion...not a advice!!!!
HINDUNILVRDistribution Schematic #1: wyckoff Phases
Stock has been struggling past 3 to breakout and sustain
one more last dead cat bounce is pending.

HINDUNILVR - Cross 36 Months HIgh HINDUNILVR. The chart is in a Weekly time frame.
On Daily, Weekly, and Monthly time frames - close is above all the indicators.
Above Weekly and MOnthly Pivots
High on momentum.
Also *Close Crossing 36 Months High*
Daily RSI > Weekly RSI > Monthly RSI
Add to watchlist

HINDUNILVR - Ichimoku Breakout📈 Stock Name - Hindustan Unilever Limited
🌐 Ichimoku Cloud Setup:
1️⃣ Today's close is above the Conversion Line.
2️⃣ Future Kumo is Turning Bullish.
3️⃣ Chikou span is slanting upwards.
All these parameters are shouting BULLISH at the Current Market Price and even more bullishness anticipated AFTER crossing 2922.
🚨Disclaimer: This is not a Buy or Sell recommendation. It's for educational purposes and a guiding light to learn trading in the market.
#CloudTrading
#IchimokuCloud
#IchimokuFollowers
#Ichimokuexpert
Excited about this analysis? Share your thoughts in the comments below!
👍 Like, Share, and Subscribe for daily market insights! 🚀
#StockAnalysis #MarketWatch #TradingEducation #ichimoku #midcap #smallcap #largecap #HINDUNILVR

HINDUNILEVER WEEKLY BREAKOUTHindunilever breaking long time resistance
weekly basis and trading at ATH
good volume building up
#target 3200 #positionaltrading
EDUCATIONAL IDEA

HINDUNILVR - - Symmetrical Triangle -Breakout-wklyHINDUNILVR - - Symmetrical Triangle -Breakout-wkly
Concern - Price breakout with avg volume.
Name - HINDUNILVR
Pattern - symmetrical triangle
Timeframe - Wkly
Status - Breakout
Volume - Average
Cmp - 2838
Target - 3675
SL - 2666

HUL - breakout on upsideHUL gas given very strong breakout on upside. either one may buy little now and buy more after re test. HUL turned Bullish now.

HINDUSTAN UNILEVER - SWING TRADE ON LONG SIDESymbol - HINDUNILVR
Hindustan Unilever is currently trading at 2185.
2185-2140 is a good support area for Hindustan Unilever.
I'm seeing a trading opportunity on buy side.
Buying Hindustan Unilever Futures at CMP 2185
I will be adding more if 2150 - 2140 comes & hold with SL of 2090.
Targets I'm expecting are 2265 - 2380 & beyond.
Disclaimer - Do not consider this as a buy/sell recommendation. I'm sharing my analysis & my trading position. You can track it for educational purposes. Thanks!


HindunilvrHindunilvr has been trading within parallel channel from past 25 years. I don't have any position


H U LHUL FUT broke above descending channel pattern on an hourly chart with OI suggesting shortcovering turned to long build up.
Very good risk rewad ratio in favour of bulls.
Not to be missed.
Could be bought with mentioned stoploss & target.
