STWP Breakout Watchlist – [14.09] | Key Stocks for Swing TradersSTWP Breakout Watchlist – | Key Stocks for Swing Traders 📊🚀
Markets are buzzing with momentum as multiple stocks show strong breakout signals backed by volumes and clean chart structures 🚀. Today’s watchlist highlights finance heavyweights and defence leaders that are attracting trader attention with fresh swing setups. Let’s decode the key levels, supports, and resistances to track for the coming sessions 🔑.
________________________________________________________________________________
________________________________________________________________________________
BAJFINANCE – 1003.25 (3.41%)
📊 Technical Indicators Explained
Bajaj Finance has given a powerful breakout 🚀 as it clears a long consolidation zone with a strong bullish Marubozu candle backed by heavy volume. The stock posted volumes almost 2 times its 20-day average, reflecting active trading and stronger-than-usual participation. Elevated volumes like this often support the sustainability of the underlying trend.
The chart highlights multiple bullish signals — strong momentum, a 52-week breakout, RSI breakout ⚡ confirming strength, and a Bollinger Band squeeze-off 📊 hinting at fresh volatility expansion. With VWAP support and intraday swing confirmation, the setup looks robust.
As long as key supports at 981 / 959 / 947 are protected, the stock can eye resistances at 1015 / 1026 / 1048 and possibly move towards higher upside levels of 1062 and 1120 in the coming sessions, with a possible demand zone at 975.90 – 965.60.
Bajaj Finance recently touched a 52-week high, driven by strong trading volumes (as per MarketWatch).
The company has set an ambitious goal to grow its loan book to ₹10 lakh crore by FY29, while also working on internal succession planning for senior leadership roles (as per Economic Times).
________________________________________
📈 Investment Outlook & Conclusion
📈 Bullish Case – Momentum with volume support may extend gains towards resistances.
📉 Bearish Case – Breach below 970 can attract selling pressure.
⚡ Momentum Case – Well-aligned for short swing trades.
📅 Perspective – Short-term momentum positive; long-term depends on loan book growth and asset quality.
________________________________________
📊 STWP Trade Analysis – BAJFINANCE
Bajaj Finance has given a strong breakout with momentum and volume confirmation 🚀
👉 For me, my entry zone is around 1004.60, aligned with the breakout structure considering 946.70 as my stop loss.
👉 If the stock dips towards 975.90 – 965.60 (Pullback zone), I will see that as a conservative re-entry with tighter risk.
🔑 Key Levels I’m Watching
Invalidation Level: A sustained move below 945 will negate my bullish view.
My Levels (if momentum continues): 1048 → 1062 → 1120
This is my swing trading approach as long as supports hold and is not a buy/sell recommendation.
________________________________________________________________________________
________________________________________________________________________________
BDL – 1566.50 (▲ +5.73%)
📊 Technical Indicators Explained
Bharat Dynamics (BDL) has delivered a strong breakout candle 🔥 after a prolonged downtrend, backed by extremely high volume 🚀. BDL stood out with an impressive 3.7x surge in volumes over its 20-day average, showcasing aggressive market involvement. Such strong accumulation signals heightened attention from traders and investors, often aligned with significant moves.
The chart highlights multiple bullish signals — RSI breakout, Bullish Engulfing candle, Buy Today Sell Tomorrow (BTST) setup, VWAP support, and SuperTrend reversal confirmation. The BB squeeze-off 📊 indicates a fresh trending move is likely to unfold.
As long as supports at 1506 / 1446 / 1410 are protected, and with a demand zone between 1513 – 1470, the stock looks well positioned to sustain momentum. On the upside, resistances are placed at 1602 / 1637 / 1697, with Fibonacci-based higher levels stretching to 1734 → 1886 → 2041 and beyond.
________________________________________
📰 Recent Updates
Institutional interest in BDL is rising, with the HDFC Defence Fund increasing its stake in the company along with other defence stocks (Economic Times).
BDL has also been highlighted among defence counters that recently surged up to 19%, supported by a strong order book and export prospects (Mint).
________________________________________
📈 Investment Outlook & Conclusion
📈 Bullish Case – Strong breakout with heavy volumes may extend towards higher resistances.
📉 Bearish Case – Slip below 1479 can open downside risk.
⚡ Momentum Case – High-risk, high-reward setup for aggressive short-term swings.
📅 Perspective – Short-term breakout play; long-term outlook tied to defence orders and exports.
________________________________________
📊 STWP Trade Analysis – BDL
Bharat Dynamics has delivered a breakout with volume confirmation and multiple bullish signals 🚀
👉 For me, my entry zone is around 1577, aligned with the breakout structure with my stop being at 1422.60
👉 If the stock dips towards the 1513 – 1470 demand zone, I will treat it as a conservative re-entry with tighter risk.
🔑 Key Levels I’m Watching
Invalidation Level: Invalidation level of below 1422 will negate my bullish view.
My Levels (if momentum continues): 1602 → 1637 → 1697 → 1734 → 1886 → 2041
This is my swing trading approach as long as supports hold and is not a buy/sell recommendation.
________________________________________________________________________________
________________________________________________________________________________
BAJAJFINSV – 2081.50 (▲ +2.14%)
📊 Technical Indicators Explained
Bajaj Finserv (BAJAJFINSV) has given a breakout candle with volume confirmation 🔥 after a long consolidation phase.
The stock displays strong signals — possible breakout setup, bullish engulfing candle, RSI breakout ⚡, swing trade confirmation, and Bollinger Band breakout 📊. The stock is also supported by VWAP demand and a BB squeeze-off, indicating potential for fresh momentum expansion. BAJAJFINSV recorded volumes about 1.8 times its recent 20-day average, suggesting above-normal market activity. This indicates healthy interest and participation, though the intensity is moderate compared to high-volume breakouts.
With strong supports at 2047 / 2013 / 1992, the stock looks well-positioned to sustain its move. On the upside, resistances are placed at 2102 / 2122 / 2156, with higher Fibonacci levels seen at 2135 → 2217 → 2236 if momentum holds.
________________________________________
📰 Recent Updates
Bajaj Finserv has set a target to achieve carbon neutrality for Scope 1 & 2 emissions by 2032, following a decarbonisation study in FY25 (Times of India).
In Q1 FY26, the company reported a 30.4% YoY rise in consolidated net profit to ₹2,789 crore, with revenues growing by ~12–13% (Economic Times).
________________________________________
📈 Investment Outlook & Conclusion
📈 Bullish Case – Gradual momentum with volume support could lift towards resistances.
📉 Bearish Case – A fall below 2032 can trigger near-term weakness.
⚡ Momentum Case – Suitable for cautious swing setups.
📅 Perspective – Short-term bias positive; long-term backed by financial services expansion.
________________________________________
📊 STWP Trade Analysis – BAJAJFINSV
Bajaj Finserv has delivered a breakout candle with momentum and above-average volume 🚀
👉 For me, my entry zone is around 2089, aligned with the breakout structure and a stop loss level of 2024.95.
👉 If the stock dips towards the level of 2041, I will treat it as a conservative re-entry with tighter risk.
🔑 Key Levels I’m Watching
Invalidation Level: A sustained move below 2012 will negate my bullish view.
My Levels (if momentum continues): 2102 → 2122 → 2156 → 2135 → 2217 → 2236
This is my swing trading approach as long as supports hold and is not a buy/sell recommendation.
________________________________________________________________________________
________________________________________________________________________________
HAL – 4745.60 (▼ –3.59%)
📊 Technical Indicators Explained
Hindustan Aeronautics (HAL) has given a breakout candle with strong volume confirmation 🚀 after a corrective downtrend. HAL witnessed trading volumes nearly 2.6x higher than its 20-day average, reflecting strong participation in the stock. Such elevated volumes often highlight rising institutional or retail activity, adding credibility to the ongoing price momentum.
The stock shows powerful bullish signals — Bullish Marubozu candle, RSI breakout ⚡, Bullish Engulfing setup, VWAP support, backed by a SuperTrend reversal and Bollinger Band breakout 📊. The BB squeeze-off suggests a potential trending move is just beginning.
With supports at 4634 / 4523 / 4465, the stock looks cushioned for momentum continuation. On the upside, immediate resistances lie at 4803 / 4861 / 4972, with higher Fibonacci-based levels stretching towards 5074 → 5399 → 5723 if momentum sustains. There is a possible demand zone around 4634 – 4544.30
________________________________________
📰 Recent Updates
HAL has received its third GE-404 engine from the US for the LCA Tejas Mark-1A programme, with a fourth expected later this month (Economic Times).
The company also signed a technology transfer agreement with IN-SPACe, ISRO, and NSIL for the Small Satellite Launch Vehicle (Economic Times).
HAL’s HJT-36 trainer jet is being evaluated for conversion into a light-attack fighter aircraft, with basic weapon trials already completed (Navbharat Times).
________________________________________
📈 Investment Outlook & Conclusion
📈 Bullish Case – Strong momentum with volume support may push towards higher resistances.
📉 Bearish Case – A drop below 4576 can attract downside pressure.
⚡ Momentum Case – Aligned with momentum; good for short-term swings.
📅 Perspective – Short-term breakout play; long-term supported by defence growth.
________________________________________
📊 STWP Trade Analysis – HAL
Hindustan Aeronautics has delivered a breakout candle with strong volume and momentum 🚀
👉 For me, my entry zone is around 4750, aligned with the breakout setup and my stop loss level at 4425.35.
👉 If the stock dips towards the 4634 – 4544.30, I will consider it as a conservative re-entry with tighter risk.
🔑 Key Levels I’m Watching
Invalidation Level: A sustained move below 4425 will negate my bullish view.
My Levels (if momentum continues): 4803 → 4861 → 4972 → 5074 → 5399 → 5723
This is my swing trading approach as long as supports hold and is not a buy/sell recommendation.
________________________________________________________________________________
________________________________________________________________________________
⚠️ Disclaimer – Please Read Carefully
The information shared here is meant purely for learning and awareness. It is not a buy or sell recommendation and should not be taken as investment advice. I am not a SEBI-registered investment advisor, and all views expressed are based on personal study, chart patterns, and publicly available market data.
Trading — whether in stocks or options — carries risk. Markets can move unexpectedly, and losses can sometimes exceed the money you have invested. Past performance or past setups do not guarantee future results.
If you are a beginner, treat this as a guide to understand how the market works — practice on paper trades before risking real money. If you are experienced, always assess your own risk, position sizing, and strategy suitability before entering trades.
Consult a SEBI-registered financial advisor before making any real trading decision. By engaging with this content, you acknowledge full responsibility for your trades and investments.
💬 Found this useful?
🔼 Give this post a Boost to help more traders discover clean, structured learning.
✍️ Drop your thoughts, questions, or setups in the comments — let’s grow together!
🔁 Share with fellow traders and beginners to spread awareness.
👉 “If you liked this breakdown, follow for more clean, structured setups with discipline at the core.”
🚀 Stay Calm. Stay Clean. Trade With Patience.
Trade Smart | Learn Zones | Be Self-Reliant 📊
Hindustanaeronautics
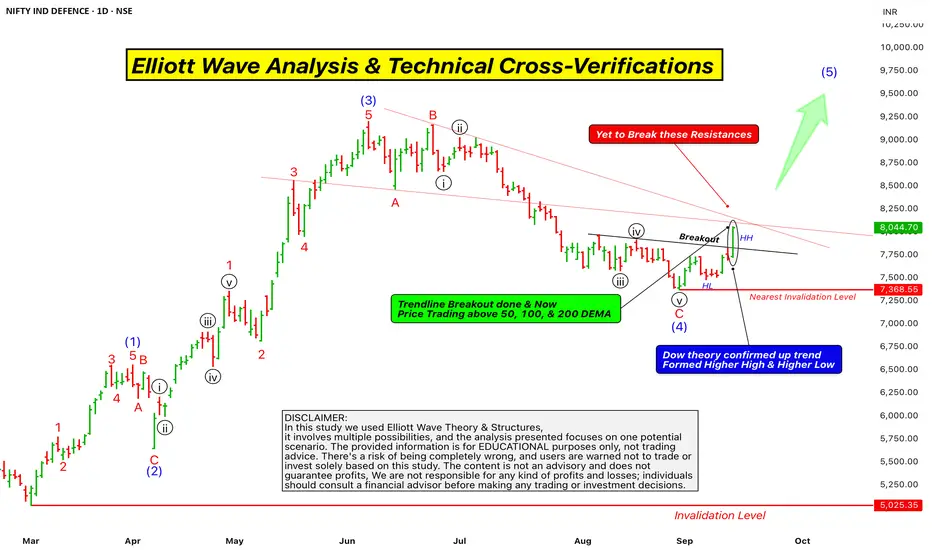
Elliott Wave Analysis & Technical Cross-VerificationsHello Friends, Welcome to RK_Chaarts,
Today, we're going to learn how to validate our Elliott Wave analysis by identifying additional factors that support our directional bias. Once we've plotted our Elliott Wave counts and identified a direction, we want to confirm whether other technical indicators and patterns align with our analysis. This helps strengthen our conviction in our directional bias and provides additional confidence in our trading decisions. Today, we'll explore some key points, including Elliott Wave theory, Exponential moving averages, Trend line breakouts, and Invalidation levels, as well as projected targets. And please note that this post is shared solely for educational purposes. It is not a trading idea, tip, or advisory. This is purely an Educational post.
Elliott Wave Theory structure & wave Counts
Here chart we are using Nifty India Defence sector, which is an index chart. We are analyzing it using Elliott Wave theory. It's very clear that from the March 2025 bottom, we've identified a clear Wave (1) Wave (2) Wave (3) and Wave (4) and now we've started Wave (5) of Intermediate degree in Blue.
Projections of wave (5)
According to the theory, the projected target for Wave (5) is typically between 123% to 161.8% of the length of Wave (4). So, we can at least assume that the price will reach 123% of Wave (4)’s length, and the price will move higher from here.
Trendline Breakout
The trend line breakout also confirms this. Since Wave (4) moved downwards, Wave (5) should move upwards, indicating a potential upward movement in price. This is a positive signal and a possibility.
Dow Theory confirmation of Trend changed
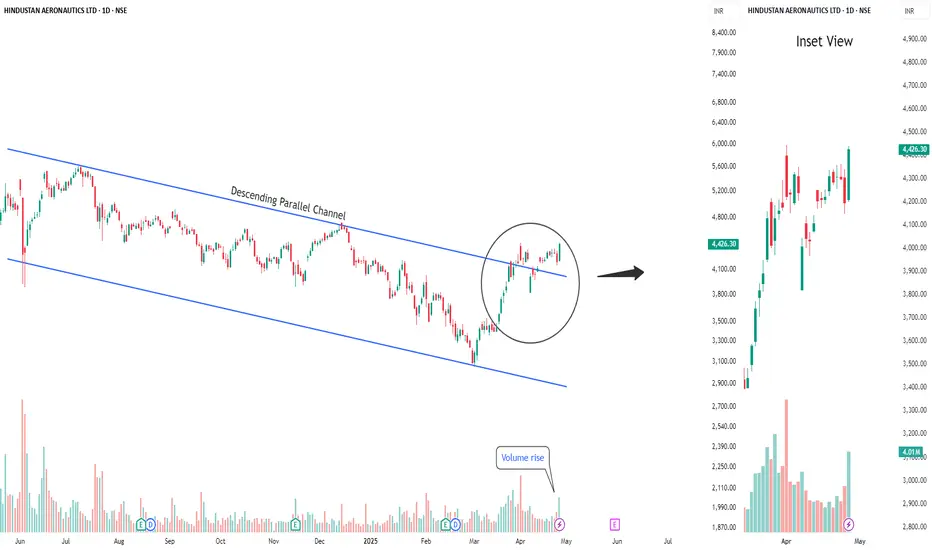
Additionally, we can see that in the daily time frame, the price has recently completed Wave (4) and formed a higher high, followed by a higher low, and then another higher high, along with a trend line breakout, which we've marked with a rounded ellipse on candle on the chart.
According to Dow theory, this formation of higher highs and higher lows, along with the trend line breakout, indicates that the index has the strength to break through resistance. These two factors strongly support our Elliott Wave projection, which suggests that the price will move upwards. The chart is looking bullish, indicating that a swing has been activated upwards from here.
Exponential Moving Averages
Furthermore, we can see that the price is trading above the 50-day exponential moving average (EMA) in the daily time frame, as well as above the 100-day EMA and the 200-day EMA. These three EMAs are major indicators, and the price is sustaining above all of them. This is also a very good positive sign that supports our view and this scenario.
Supporting Indicators
MACD
RSI
Some Hurdles to cross yet
Finally, we can see that the Zero B trend line, which is coming down from the top, has not been crossed by the price yet, and there has been no breakout. Additionally, we have drawn a trend line connecting the high of the third wave and the low of the fourth wave, which initially acted as resistance and later as support. This trend line is also approaching the same level as the Zero B trend line. So, we have two resistances converging at the same point, which the price has yet to break out of.
This could potentially be a hurdle, and it's possible that according to the Elliott Wave count, Wave (5) will arrive with five sub-divisions, which could lead to a retest of the previous trend line or a Retracement before moving further upwards.
Invalidation Level
According to Elliott Wave theory, the nearest invalidation level is the low of Wave (4), which is currently at 7368, and this level should not be breached. If it is, it will lead to a lower low, which would be an invalidation of the Elliott Wave count.
Overall, the chart of this index looks very promising and bullish. As we all know, the market can be unpredictable, but if this invalidation level is not triggered and the price doesn't break down, then the chart may move upwards with strength. This entire analysis that we discussed is for the Nifty India Defense index chart. Please note that this is not a trading tip or advice, but rather an educational perspective that we shared. Also, keep in mind that the Nifty Defense index is not tradable, but it does provide insight into the market's direction.
This post is shared purely for educational purpose & it’s Not a trading advice.
I am not Sebi registered analyst.
My studies are for educational purpose only.
Please Consult your financial advisor before trading or investing.
I am not responsible for any kinds of your profits and your losses.
Most investors treat trading as a hobby because they have a full-time job doing something else.
However, If you treat trading like a business, it will pay you like a business.
If you treat like a hobby, hobbies don't pay, they cost you...!
Hope this post is helpful to community
Thanks
RK💕
Disclaimer and Risk Warning.
The analysis and discussion provided on in.tradingview.com is intended for educational purposes only and should not be relied upon for trading decisions. RK_Chaarts is not an investment adviser and the information provided here should not be taken as professional investment advice. Before buying or selling any investments, securities, or precious metals, it is recommended that you conduct your own due diligence. RK_Chaarts does not share in your profits and will not take responsibility for any losses you may incur. So Please Consult your financial advisor before trading or investing.
F&O Watchlist – Stocks with Action👋 Hello Traders!
Welcome to the Daily Options Trade Setup & Watchlist – 12th Sept 2025 🚀
The market is showing strong activity today with fresh long build-ups, surging volumes, and supportive OI data across key F&O names. Volatility remains balanced, creating opportunities for traders to ride the momentum while keeping risks in check.
This watchlist highlights stocks where data and trend are aligning, giving us a clearer picture of market sentiment and possible trading setups.
Let’s explore today’s opportunities 👇
ADANIENT | 11th Sept 2025
Overall Bias: Bullish
Spot Price: ₹2,446.50
Trend: Uptrend
Volatility: Moderate (IV ~24–25%)
Ideal Strategy Mix: Directional Bullish + OTM Convexity + Hedge via PE
________________________________________
✅ Bullish Trade (Naked options as per trend)
ADANIENT 2450 CE LTP @ ₹34.45
Why:
Long Build-up at 2450 CE → OI ↑ 173% with Price ↑ 118% (strong confirmation).
Volume surge 986% → heavy participation.
Delta 0.46 → balance of ITM probability & convexity.
Rising IV (5.9%) → supports premium expansion.
________________________________________
⚠️ Contrarian Trade (Naked options against trend)
ADANIENT 2300 PE LTP @ ₹21.50
Why:
Acts as a downside hedge in case of reversal.
IV 28.7% with IV ↑ 26.8% → room for premium spike.
Delta -0.33 → controlled risk hedge.
Suitable for protection if momentum stalls.
________________________________________
🎯 Strategy Trade (As per trend + OI data)
Bull Call Spread → 2450 CE LTP @ ₹34.45 & 2550 CE LTP @ ₹10.75
Why:
• Aligns with strong bullish OI build-up (2400–2600 CE cluster).
• Captures upside momentum with defined risk.
• Excellent R:R (1:3+) → low cost, high potential reward.
• Short CE hedge (2550) cuts theta decay and risk.
________________________________________
________________________________________
ADANIPORTS | 11th Sept 2025
Overall Bias: Bullish
Spot Price: ~₹1,438 (near 1440 zone)
Trend: Uptrend
Volatility: Moderate (IV ~23–26%)
Ideal Strategy Mix: Directional Bullish + OTM Convexity + Hedge via PE
________________________________________
✅ Bullish Trade (Naked options as per trend)
ADANIPORTS 1440 CE LTP @ ₹13.90
Why:
Long Build-up at 1440 CE → OI ↑ 100.6% with Price ↑ 50.3% (classic long-side confirmation).
Volume surge 524.5% → strong participation.
Delta 0.39 → sweet spot between ITM probability & convexity.
IV rising 20.7% → supportive of premium expansion.
________________________________________
⚠️ Contrarian Trade (Naked options against trend)
ADANIPORTS 1400 CE LTP @ ₹27.90 (used here as hedge/play on exhaustion)
Why:
Higher ITM CE with Delta 0.51 → limited convexity, may underperform if momentum slows.
OI ↑ only 12.3% → weaker build-up compared to mid-OTM strikes.
IV 23.0% (low side) → less premium expansion potential.
Can act as a contrarian hedge if market consolidates below 1440.
________________________________________
🎯 Strategy Trade (As per trend + OI data)
Bull Call Spread → ADANIPORTS 1440 CE LTP @ ₹13.90 & 1500 CE LTP @ ₹4.95
Why:
• Strong long build-ups across 1420–1460 strikes → confirms directional bias.
• Captures upside momentum with defined risk using OTM convexity (1500 CE).
• Excellent R:R (≈ 1:2+) → low debit, higher potential payoff.
• Short OTM CE (1500) reduces theta decay and caps risk.
________________________________________
________________________________________
AUROPHARMA | 11th Sept 2025
Overall Bias: Bullish
Spot Price: ~₹1,118 (near 1120 zone)
Trend: Uptrend
Volatility: Rich (IV ~30–32%)
Ideal Strategy Mix: Bullish Directional + Debit Spreads (IV hedging) + Convexity via OTM Calls
________________________________________
✅ Bullish Trade (Naked options as per trend)
AUROPHARMA 1140 CE LTP @ ₹18.95
Why:
Long Build-up → Price ↑ 351% with OI ↑ 280% (strong long confirmation).
Volume surge 1792% → very active participation.
Delta 0.40 → sweet convexity with good ITM odds.
IV rising 6.2% → supports premium expansion.
________________________________________
⚠️ Contrarian Trade (Naked options against trend)
AUROPHARMA 1060 CE LTP @ ₹64.25 (deep ITM hedge / slowdown risk)
Why:
Short covering at 1060 CE (OI ↓ 15.8%) → weaker continuation if fresh longs don’t add.
Higher ITM delta (0.74) → less convexity, less reward-to-risk.
IV rich (31.6%) → premiums already expensive.
Could underperform if price momentum cools off near resistance zones.
________________________________________
🎯 Strategy Trade (As per trend + OI data)
Bull Call Spread → AUROPHARMA 1120 CE LTP @ ₹26.65 & 1160 CE LTP @ ₹13.10
Why:
• Strong long build-ups between 1120–1160 strike cluster confirm bullish continuation.
• Captures upside momentum with limited debit exposure.
• IV ~30+ → spreads preferred over naked calls (reduces risk of IV crush).
• Good convexity → balance of ITM probability and upside leverage.
________________________________________
________________________________________
HAL | 11th Sept 2025
Overall Bias: Bullish
Spot Price: ~₹4,650 (near 4600–4700 zone)
Trend: Uptrend
Volatility: Moderate (IV ~25–28%)
Ideal Strategy Mix: Directional Bullish + OTM Convexity + Debit Spreads for IV balance
________________________________________
✅ Bullish Trade (Naked options as per trend)
HAL 4800 CE LTP @ ₹36.10
Why:
Long Build-up → Price ↑ 16.8% with OI ↑ 7% (fresh long confirmation).
Volume surge 72.5% → active participation.
Delta 0.34 → balance of convexity & ITM probability.
IV 25.7% → stable with upside potential.
________________________________________
⚠️ Contrarian Trade (Naked options against trend)
HAL 4500 CE LTP @ ₹158.55 (short covering driven, contrarian hedge)
Why:
Short covering at 4500 CE → OI ↓ 13.7% while Price ↑ 12.8%.
Delta 0.61 → deeper ITM, lower convexity.
Volume dropped 56% → thinner liquidity, size should be reduced.
Better suited as hedge / risk balancer in case momentum stalls.
________________________________________
🎯 Strategy Trade (As per trend + OI data)
Bull Call Spread → HAL 4800 CE LTP @ ₹36.10 & 4900 CE LTP @ ₹21.00
Why:
• OI build-up across 4700–4900 CE cluster confirms bullish continuation.
• Debit spread reduces IV risk (IV ~25–27%) and limits loss.
• Defined-risk setup with convexity at 4900 CE.
• Cleaner R:R profile compared to naked long calls.
________________________________________
________________________________________
TCS | 11th Sept 2025
Overall Bias: Bullish
Spot Price: ~₹3,135 (near 3140 zone)
Trend: Uptrend
Volatility: Moderate (IV ~17–19%)
Ideal Strategy Mix: Directional Bullish + OTM Convexity + Debit Spread to balance low IV
________________________________________
✅ Bullish Trade (Naked options as per trend)
TCS 3200 CE LTP @ ₹25.05
Why:
Long Build-up → Price ↑ 9.2% with OI ↑ 7.9% (long confirmation).
IV 17.9% → moderate, stable for option buying.
Delta 0.36 → sweet spot of convexity & ITM odds.
Fits directional bullish bias near resistance breakouts.
________________________________________
⚠️ Contrarian Trade (Naked options against trend)
TCS 3100 CE LTP @ ₹67.85 (short covering driven, weaker momentum trade)
Why:
Short covering at 3100 CE → OI ↓ 4% while Price ↑ 6.1%.
Volume dropped 72.5% → thin liquidity, size down.
IV 17.2% easing -5.3% → weaker premium expansion.
Higher ITM delta (0.59) → less convexity, limited upside gearing.
________________________________________
🎯 Strategy Trade (As per trend + OI data)
Bull Call Spread → TCS 3200 CE LTP @ ₹25.05 & 3300 CE LTP @ ₹8.25
Why:
• Strong long build-ups in 3140–3200 CE cluster confirm bullish continuation.
• Low IV environment (17–19%) → debit spreads attractive.
• Defined-risk setup with convexity via OTM CE (3300).
• Good balance of premium outlay vs reward with capped downside.
________________________________________
________________________________________
📘 My Trading Setup Rules
Avoid Gap Plays → Check pre-open price action to avoid trades influenced by gap-ups/gap-downs.
Breakout Entry Only → Enter trades only if price breaks previous day’s High (for bullish trades) or Low (for bearish trades).
Watch Volume for Confirmation → Monitor volume closely. No volume = No trade.
Enter on Strong Candle + Volume → Execute the trade only if a strong candle appears with increasing volume in the direction of the trade.
Defined Risk:Reward Only → Take trades only if R:R is favorable (ideally ≥ 1:2).
Premium Disclaimer → Option premiums shown are based on EOD prices — real-time premiums may vary during execution.
Time Frame Preference → Trade with your preferred time frame — this strategy works across intraday or positional setups.
⚠️ Disclaimer – Please Read Carefully
The information shared here is meant purely for learning and awareness. It is not a buy or sell recommendation and should not be taken as investment advice. I am not a SEBI-registered investment advisor, and all views expressed are based on personal study, chart patterns, and publicly available market data.
Trading — whether in stocks or options — carries risk. Markets can move unexpectedly, and losses can sometimes exceed the money you have invested. Past performance or past setups do not guarantee future results.
If you are a beginner, treat this as a guide to understand how the market works — practice on paper trades before risking real money. If you are experienced, always assess your own risk, position sizing, and strategy suitability before entering trades.
Consult a SEBI-registered financial advisor before making any real trading decision. By engaging with this content, you acknowledge full responsibility for your trades and investments.
💬 Found this useful?
🔼 Give this post a Boost to help more traders discover clean, structured learning.
✍️ Drop your thoughts, questions, or setups in the comments — let’s grow together!
🔁 Share with fellow traders and beginners to spread awareness.
👉 “If you liked this breakdown, follow for more clean, structured setups with discipline at the core.”
🚀 Stay Calm. Stay Clean. Trade With Patience.
Trade Smart | Learn Zones | Be Self-Reliant 📊
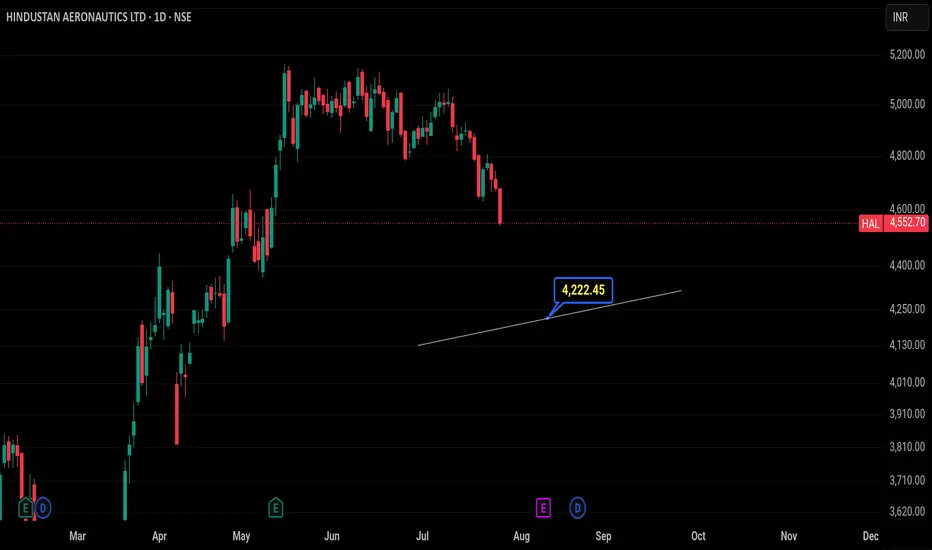
Hindustan Aeronautics Limited (HAL)Chances are it could fall to 4222 or to the white line within 11th August 2025 .
Disclaimer:
It's a personal view not a financial advice and I assume no responsibility and liability whatever outcome arises.
HAL – Ready for a Lift-Off?📈 HAL – Ready for a Lift-Off?
🔍 Bullish Action Heating Up | Option Chain + Price Action Analysis
Chart Type: 15-min / 1H / Daily
Indicators: STWP Zones, Volume, Demand-Supply, OI Analysis
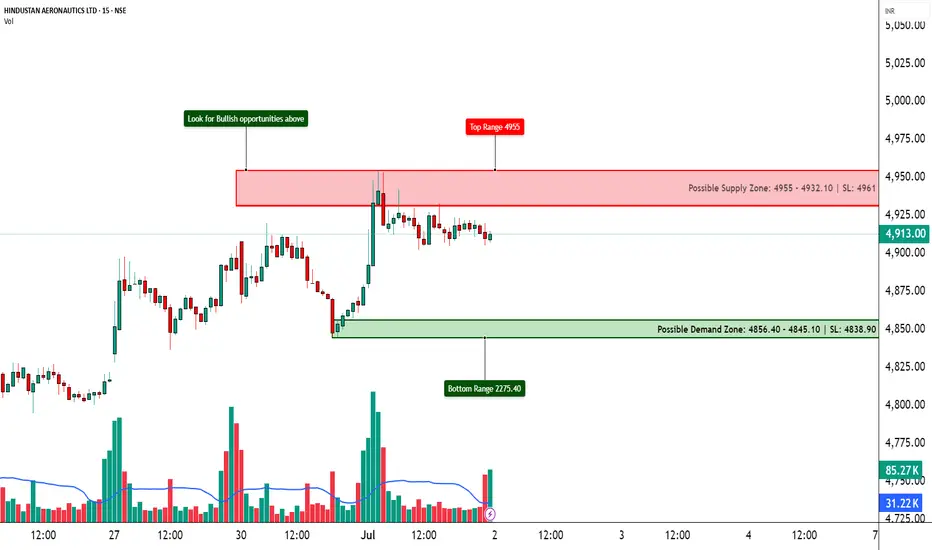
🔹 What’s Catching Our Eye?
✅ Strong Long Build-Up at 5000, 5100 & 4950 Calls – Signs of institutional interest
✅ Short Covering at 4900 & 5200 CE – Shorts getting out = bullish continuation likely
✅ Highest OI at 5000 CE with +7.53% OI change = psychological breakout zone
✅ Spot Price at ₹4912 approaching key round-level resistance
✅ IV stable around 29.4%–29.7% → Room for volatility expansion if breakout happens
📊 What We’re Watching for:
📍 Breakout Zone: 4950–5000
📍 Targets: 5050 → 5100 → 5200
📍 Invalidation Below: 4850
📍 Momentum Confirmation: Sustained price close above 5000 with volume + OI surge
📍 Option Chain Bias: 5000 CE leading in build-up, supporting bullish sentiment
📌 Trade Plan (Educational Purpose Only):
🔹 Bullish: Buy above 4950 breakout with SL below 4850
🔹 Options: Consider 5000 or 5100 CE depending on your risk-reward
🔹 BTST/Positional Type: If price sustains above 4950–5000 with aggressive volumes
⚠️ Disclaimer:
This post is for educational and learning purposes only.
It does not constitute buy/sell advice or investment recommendation.
Always consult your financial advisor before taking any positions.
STWP is not liable for any financial decisions based on this content.
📚 “Smart money seems to be fueling the engines here.”
💬 Is HAL cleared for take-off above 5000? Or is it facing turbulence ahead?
HAL Long - 6400 - Breakout doneThe HAL has broken out of Flag and Pole Pattern.
Breakout done and already on bullish trend.
Target 6400
Buy Hindustan Aeronautics Limited Short Term Trading Advice by Goodluck Capital
Buy Hindustan Aeronautics Limited
Buy Range- 4250 - 4400
Target- 4600 - 4700
StopLoss- below 4100
Upside Potential- 6% -9%
Approx trade duration 14 - 15 days
HAL: Channel Breakout Above 4450, Targeting 5000Details:
Asset: Hindustan Aeronautics Ltd (HAL)
Breakout Level: 4450
Potential Target: 5000
Stop Loss: Below 4450 or as per risk management
Timeframe: Medium-term
Rationale: HAL has given a strong channel breakout above 4450, indicating bullish momentum. If the stock sustains, it can move towards the 5000 level.
Market Analysis:
Technical Setup: Clear breakout from a prolonged channel, supported by strong volumes.
Sector Strength: With increasing defense and aerospace spending, HAL is well-positioned for growth.
Risk Management:
Place stop loss below 4450 to safeguard capital.
Timeframe:
Medium-term move expected toward 5000, with strength in sector fundamentals.
Risk-Reward Ratio:
Attractive, with clear breakout structure and upside potential.
Watch for sustained closing above breakout zone with good volumes.
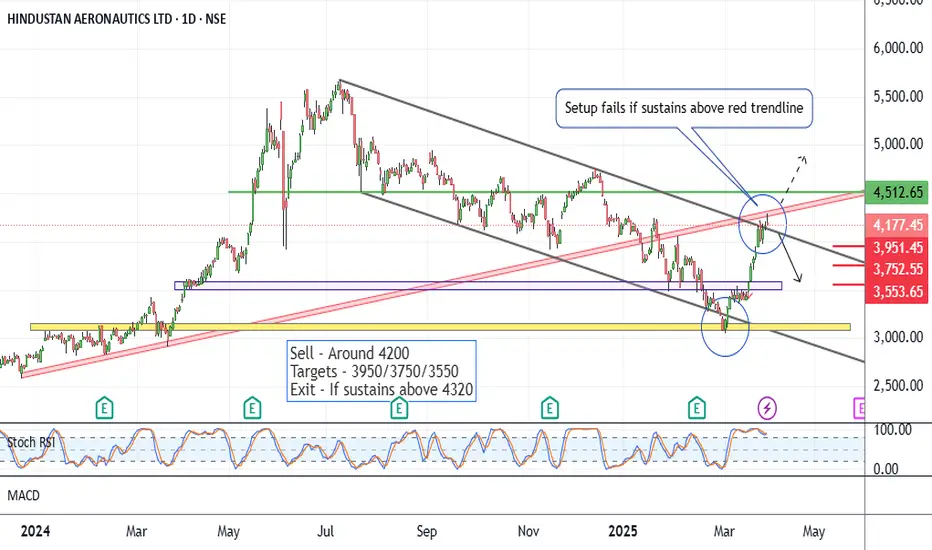
HAL - What Next ?CMP 4177 on 31.03.25
The stock has shown a 40% rise in the recent month. This time may face resistance as shown on the chart (the red trendline).
If the price is rejected from these levels, a downside move can be seen ahead. That can push the price down to the levels of 3950/3750 and 3550.
The setup fails if the price sustains above 4320 levels.
The strategy may be coupled with some hedging options for a wide coverage.
All these illustrations are only for learning and sharing purposes, for paper trading. They are not trading recommendations in any way.
All the best.
HAL | Possible return of the BearsStock in lower lows lower highs in daily
Current area also a flip zone in daily
So the resistance in the below mentioned area will be possibly strong
Area of Daily Resistance 3400 - 3500
SL area strictly above 3540 / 3550
Downside possible target 3050
Good risk reward
Good option play possible

Hindustan Aeronautics Ltd. - Breakout OpportunityDate : 8-Dec-2024
LTP : Rs. 4,559.65
Targets: (T1) Rs. 5,082 --> (T2) Rs. 5,674 --> (T3) Rs. 6,758
SL : Rs. 4,044
Technical View:
• NSE:HAL is in primary uptrend and was recently going through it's secondary downtrend within primary uptrend.
• After touching the high of 5,674.75 on 9-Jul-2024, it has retraced 31% to 3,920.35 level.
• NSE:HAL has recently breakout from it's secondary downtrend with higher than average volume.
• NSE:HAL is trading above 20 DEMA and 50 DEMA since last few sessions.
• RSI is in buy zone and trading at 62.64. MACD has crossed 0 line and trading at 63.50.
• Both RSI and MACD are showing positive divergence, indicating trend reversal.
• Looking strong to start a new swing from here.
Liked the analysis? Boost/Like this idea and follow my ID.
Disclaimer: I am not a SEBI registered analyst/consultant and not recommending anyone to take any BUY or SELL position in stock market. Investing in stock market is risky and one should do a self analysis and validation before investing in stock market. My ideas are published for learning purpose only and are available to everyone at no cost/charge.

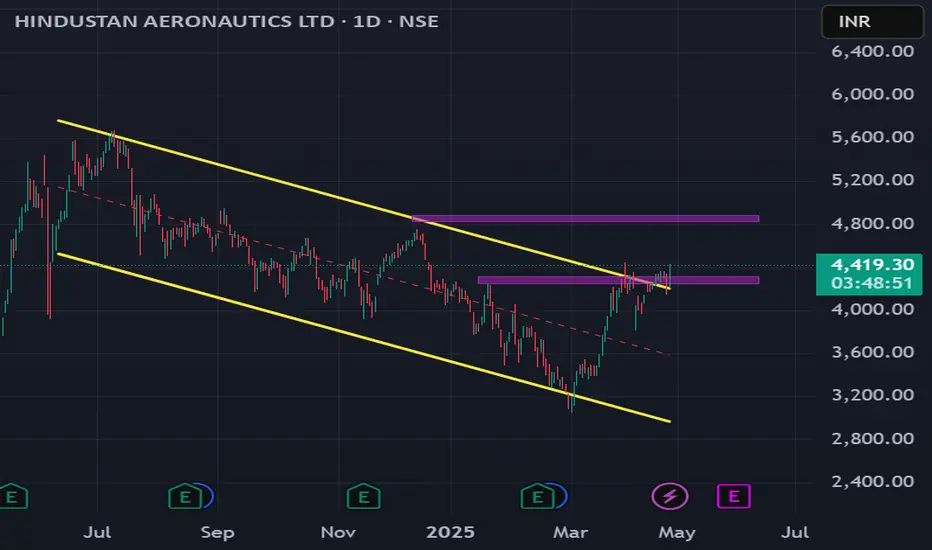
HAL - Possible Path3950 - 4050 Important Junction Zone
1st Resistance 4450 - 4500
1st Support 3650-3700
Upside target - 5650
Downside target - 3350
Trade accordingly

HAL - Break of trend1st Hour candle showing clear signs of break of trend
Stock has also broken an important support of 4600
Its highly possible that stock may again go it its previous support nor turned resistance area of 4600
From there it will start its proper downward journey, till at least 4450
Any close above 4625 will negate the idea

HAL HAL has breached the resistance level and is currently holding above it, making it a good opportunity to buy during the retest.

Hindustan Aeronautics Ltd, HAL.. breakoutHAL took the support near golden ratio 4599
and also given triangle breakout.
Positive move expected towards 5020 and than 5500++
Disclaimer L study is only for learning purpose

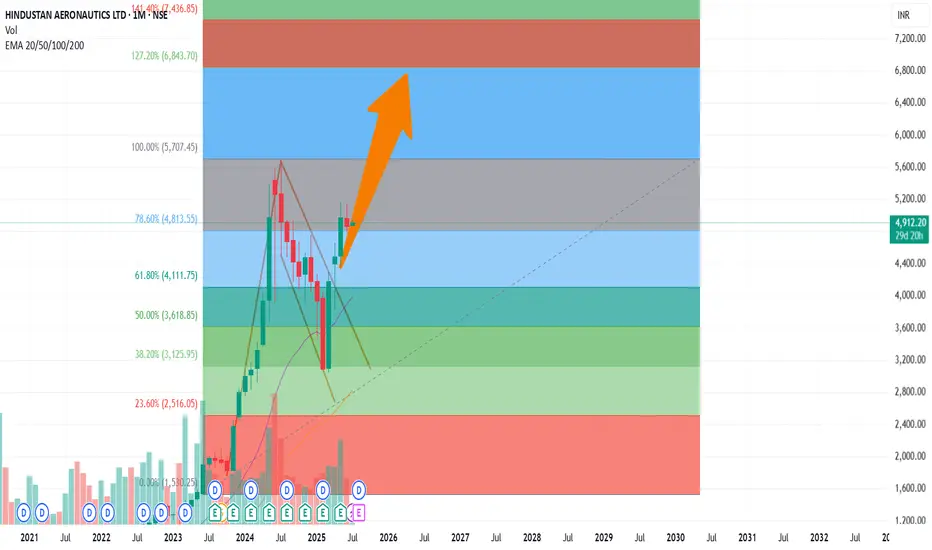
HAL 1D PROJECTIONHAL 1D Timeframe Projection.
Daily and Weekly trends are Bullish.
DISCLAIMER: All labeling and wave counts are done by me manually and I will keep changing according to the LIVE MARKET PRICE ACTION. So don't be bias, hope on my trade plans...try to learn, and make your strategy... Following is not that easy...

Hindustan Aeronautics Limited (HAL)All major points are marked in Chart.
Strong stock for accumulating in the Support. Get good return in long term.
*Do own research before investing in Equity markets.

HAL - Watch for a Triangle BreakoutThe stock has formed a perfect triangle pattern in 4hrs.
Sustaining above 5480 levels will take it to further highs.
The height of a triangle can be taken as a target on a swing basis.
The near term target is 5580 which acts as a Previous Resistance.

Hindustan Aeronautics Ltd - Breakout OpportunityDate : 6-Jun-2024
Rating : Buy - Positional Trade
LTP : Rs. 4,666.60
Targets: (1) Rs. 5,444 --> (2) Rs. 6,385
SL : Rs. 4,044 on daily close basis
Technical View:
• NSE:HAL is in its primary uptrend and was recently going through it's secondary downtrend.
• After touching the high of 5,444 on 3-Jun-2024, it has retraced 28% to 3,920 level.
• On 6-Jun-2024, NSE:HAL has broke out from its secondary down trend with higher than average volume.
• Prices are trading above 21 DEMA and 50 DMA.
• RSI is trading at 53.63 and MACD is trading at 202.50.
• Looking good to start a new swing from here.
Disclaimer : I am not a SEBI registered analyst/consultant and not recommending anyone to take any BUY or SELL position in stock market. Investing in stock market is risky and one should do a self analysis and validation before investing in stock market. Ideas are published for learning purpose only.

Hindustan Aeronautics Ltd - Breakout OpportunityDate : 14-May-2024
Rating : Buy - Positional Trade
LTP : Rs. 4,074.70
Targets: (1) Rs. 4,275 --> (2) Rs. 4,650 ++
SL : Rs. 3,670 on daily close basis
Technical View:
• NSE:HAL is in its primary uptrend and also going through it's secondary uptrend.
• Within the current secondary uptrend, NSE:HAL has retraced 5% from top and again started the upward journey from 8-May onwards.
• On 14-May-2024, NSE:HAL has broke out from minor down trend line as well as it broke the previous 52 week high with higher than average volume.
• On 8-May-2024, NSE:HAL has closed above 20 DMA and 21 DEMA. Since then it is trading above 20 DMA and 21 DEMA.
• RSI is trading at 68.74 and MACD is trading at 118.49.
• Looking strong to continue the current uptrend.
Disclaimer : I am not a SEBI registered analyst/consultant and not recommending anyone to take any BUY or SELL position in stock market. Investing in stock market is risky and one should do a self analysis and validation before investing in stock market. Ideas are published for learning purpose only.

Daily Bullish Flag Breakout in PSU Defense stockHi,
NSE:HAL has given a Bullish Flag Breakout on Daily charts with very good volume.
MACD is also on the bullish side on daily, weekly and monthly time frames. RSI is also on the bullish side on daily and weekly time frames.
In the current market scenario I am expecting that the bullish momentum will continue.
Complete price projection like entry, stoploss and targets mentioned on the charts for educational purpose.
Please share your feedback or any queries on the study.
Disclaimer: Please consult your financial advisor before making any investment decision.

Hindustan Aeronautics Limited - Breakout OpportunityDate : 21-Mar-2024
Rating : Buy - Positional Trade
LTP : Rs. 3121.35
Targets: (1) Rs. 3,428 --> (2) Rs. 3745
SL : Rs. 2910
Technical View:
• NSE:HAL is in its primary uptrend and was going through it's secondary downtrend since it touched life time high of 3,428.
• After touching the life time high of 3,428 on 11-Mar-2024, it has retraced 15% to 2913.6 level.
• NSE:HAL has broke out from its secondary down trend on 21-Mar-2024 with higher then average volume.
• NSE:HAL has also broke its 3 months old resistance placed at 3,079.
• RSI is above 50 at 51.28 and MACD is above 0 at 17.61.
• Looking strong to start a new swing from here.
Disclaimer: I am not a SEBI registered analyst/consultant and not recommending anyone to take any BUY or SELL position in stock market. Investing in stock market is risky and one should do a self analysis and validation before investing in stock market.

Just a View - HAL📊 Script: HAL
📊 Sector: Aerospace & Defence
📊 Industry: Engineering
Key highlights: 💡⚡
📈 Script is trading in between 2821 level to 3132 level.
📈 Breakout is above 3132 level.
📈 One can go for swing trade only above 3132 level.
BUY ONLY ABOVE 3132
⏱️ C.M.P 📑💰- 3115
⚠️ Important: Always maintain your Risk & Reward Ratio.
✅Like and follow to never miss a new idea!✅
Disclaimer: I am not SEBI Registered Advisor. My posts are purely for training and educational purposes.
Eat🍜 Sleep😴 TradingView📈 Repeat 🔁
Happy learning with trading. Cheers!🥂
