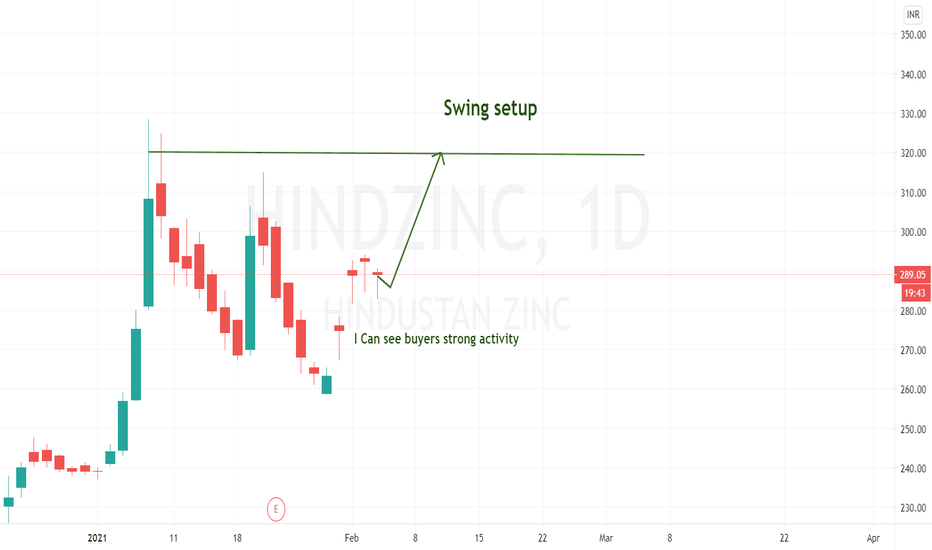
Hindustan ZincHIND ZINC (NSE CASH)
CHART ANALYSIS
LTP: 309.85
SUPPORT: 305.25 (309.01 ACCORDING TO 20 DEMA)
RESISTANCE: 321.90 / 329.30
RISK TO REWARD RATIO IS APT
RSI IN DAILY CHART IS IN A STRONG UPTREND AND IS ABOVE THE 50 MARK IN OTHER PERIODICALS
329.30 LOOKS LIKE A BREAKOUT LEVEL WHICH MEANS THAT THE CHARTS WILL MAKE NEW HIGH ONCE IT CROSSES AND TRADES ABOVE 330
CHART IS IN AN UPTREND (15M) SINCE 6th MAY AND LOOKS LIKE THE UPTREND WILL CONTINUE
OI NA AS THIS SCRIPT IS NOT PRESENT IN NFO
MARKET CAP: 1.253T (ABOVE 200B / VERY GOOD)
VOL: 7.838M (ABOVE 500K / VERY GOOD)
REL VOL: 2.16 (ABOVE 2 / VERY GOOD)
AVG VOL: 2.153M (ABOVE 100K / VERY GOOD)
FLOAT: 222.945M (BELOW 2B / VERY GOOD)
***BUY FOR MEDIUM TERM TARGETS OF 329+ AND CAN ALSO BE A LONG TERM PART OF YOUR PORTFOLIO
HINDZINC
Hindustan ZincHindustan Zinc
Market cap: 1.267T
Vol: 5.347M
Rel vol: 2.90
Avg vol: 1.866M
Float: 222.945M
LTP: 317
Support: 313.10
Resistance: 323.50 / 334.40
Daily charts (long term)
the candles are following the higher top and higher bottom bull pattern.
20 and 100 DEMA look good.
Volume looks good.
MACD has crossed over and has entered the bull zone.
RSI is in an uptrend above 50 mark.
***Investors can add Hind Zinc to their portfolios and accumulate at lower levels.
Hourly charts (medium term)
The first impression is that RSI is very close to the overbought level.
MACD has reduced volumes.
The runaway candle has all the magic. We will watch for a confirmation candle and enter for a short term trade.
***334.40 is a breakout level. We can expect a rally above it.
15m charts (short term)
As indicated in the hourly chart, RSI is correcting itself.
MACD looks strong.
20 and 100 DEMA look fine.
The chart is on a clear uptrend.
***buy on dips for short term targets of 335+
HINDZINCNote:
1. Views are personal and for educational purposes only. Recheck and take the trade as per your RR.
2. Always remember SL is your lifeline, not the big target...
3.Follow us for more patterns and like, share so that we feel it is helpful to many and share more patterns...
3. Views given here is not a tip rather it is for educational purpose... Aftermarket opens, the condition might change so learn to handle different conditions...
4. To learn more about patterns, Psychology behind the trade, and price action trading... contact us... Thanks...
Keep an eye ladies and gentlemen. Cheers and Happy Trading
HINDZINC TRENDIt has been in a downtrend from 2 years, so we can see V shaped recovery.
WHY IT SEEMS BULLISH -
1. A small flag formation an be formed in daily charts, it has crossed an important level of 205 and now the stock will find resistance at either the trendline or another important level of 230. For now the stock can see some accumulation/retracement moves.
2. Also the stock has just crossed 200 day MA and constantly taking support of 50 day MA.
3. Keep your eyes in this stock as if it cross 230, this stock will be very bullish and can be brought for long term, because there has been a volume divergence too


