Nifty - Wave-B or Boon? (Short Term) Time Holds the Answer!🔹 The Fall as Expected
The fall we anticipated in our weekend video has unfolded exactly as discussed.
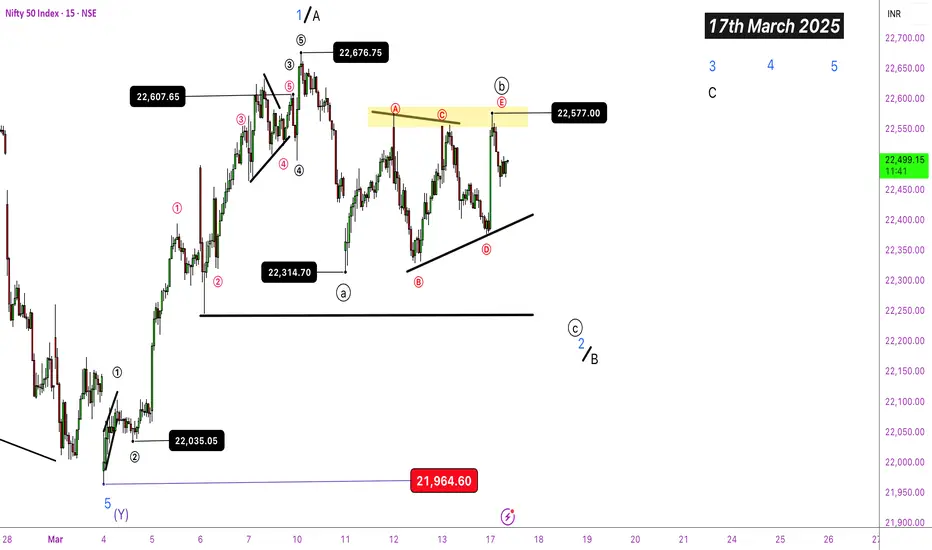
Triangular Pattern in Wave-B (proposed)
Copyright Notice – WaveTalks Original Content
Snapshot and analysis are original content from WaveTalks, protected under copyright laws. Any unauthorized use, distribution, or copying without written permission is strictly prohibited.
The pattern appears to be forming a triangle in Wave-B (proposed), but the bigger question remains—
Has (Wave-e) topped out at 22,577, forming a double top with (Wave-a) within the triangle?
🔹 Bullish Momentum & Market Complexity
Interestingly, the bullish momentum slightly surpassed (Wave-c) of the proposed triangular structure adding complexity to the structure but pattern still intact as wave-a & wave-e both made similar top so far .
🔹 Key Levels to Watch
- Will this decline hold above the swing low at 21,964?
- Or is this just a pause before Nifty resumes its upside journey post the expanded ending diagonal in the larger degree as discussed on 26th Feb2025?
🔹 TradingView Idea - 26th Feb 2025
Last Idea
This structure was already pointing towards higher targets—but now, the answer to all these uncertainties lies with only one entity—⏳ time.
🔹 The Final Truth Lies in Time
Main Samay Hoon… Aur main sab kuch dekh sakta hoon!
Just like in the epic Mahabharat, only time reveals the truth in the market!
Stay Tuned for More Insights!
Catch me with another exciting idea from WaveTalks, Market Whispers! Can you hear them?
Howtotradeimpulsivemoves
EURUSD – The Perfect Catch at 1.02! (Heading Upside in Wave 3?)Patience rewarded! EURUSD dipped right into the 1.02-1.04 box zone as projected in Jan & March 2024, marking the completion of Wave C before delivering a powerful bounce to 1.08883! 📈🔥
How many of you held steady?
From 0.95358, we identified a leading diagonal wave, signaling a long-term uptrend. The retracement to 1.02-1.04 (50-61.8%) was all part of the base-building phase, preparing for the next major wave—Wave 3! 🚀
📉 Wave C = Wave A projection hit the zone at 1.03118!
📍 Low: 1.01766 (61.8% retracement nailed!)
📈 Bounce: 1.08883 – The move begins!
Now, as the foundation is set, is EURUSD ready for its next wonder wave—Wave 3? Let’s wait and watch the magic unfold!
📊 Check the previous TradingView idea & last tweet for reference!

ONGC -Wave 5 Bottomed! OMG! - From Oil Rigs to Green Gigs!ONGC is making history, transitioning from oil dominance to renewable energy leadership.
On Feb 28, Last ONGC Idea on TradingView
I shared my TradingView idea, predicting Wave 5 completion at the bottom and expecting a bounce off the trendline. And here we are on March 6—ONGC surges from 215 lows to 232+ highs as of today’s close with a strong green candle.
ONGC’s Big Bet: A ₹9.25B Leap into Green Energy!
But that’s not all—ONGC just made a massive fundamental move, acquiring PTC Energy for ₹9.25B ($106M), adding 288 MW of operational wind power across three Indian states.
Why This is a Game-Changer
✅ India’s 500 GW non-fossil fuel target by 2030
✅ ONGC Green targeting 10 GW renewable energy portfolio
✅ Recent $2.3B Ayana Renewable Power acquisition with NTPC Green
Technical Perspective – The Power of Wave 5
Is Wave 5 bottom confirmed in some degree of the impulsive move which started falling from 345 highs as discussed and warned earlier in the Bigger Idea
Momentum building – are new highs incoming
From oil rigs to green gigs, ONGC is shifting gears fast. Is this just the beginning of an explosive rally?
Let us decode the waves.
Catch me with another exciting idea from WaveTalks, Market Whispers! Can you hear them?
Regards,
Abhishek
WaveTalks

ONGC- Is it ONGC or OUCH!!! (Will You Buy or Sell?) Elliott Wave20th Feb 2025
Last time, ONGC traded at ₹241 on February 20, 2025 , as shown in the snapshot. Today, February 28, 2025, the stock hit a low of ₹223. The big question—Is this a buying opportunity, or is more downside ahead?
Let’s break it down:
Double Divergence Unfolding
- The RSI image on the daily chart (shown above the price chart) indicates a potential reversal.
- Price is making lower lows, while RSI is making higher lows— a regular bullish divergence , signaling that the downtrend is losing strength.
Waiting for the Final Leg Downside ( Since 20th Feb 2025)
- Though the stock has dropped to ₹223 lows as of today ( 28th Feb 2025), we are possibly in the last phase of the correction before a reversal attempt.
Trendline Confluence – Price vs. RSI
- Price chart: The stock has touched a falling trendline three times (1st, 2nd, and 3rd touch points), which could act as dynamic support.
- RSI image: A rising trendline with three touch points suggests regular bullish divergence, strengthening the case for a potential bottom formation.
Andrew Cardwell’s RSI Magic
- According to Cardwell’s RSI principles, a rising RSI against a falling price often signals an upcoming reversal.
Final Thought
- If the RSI divergence holds, ONGC might be nearing a trend reversal, making this a potential buying opportunity.
- However, a break below ₹223 with increasing momentum could invalidate this setup, opening doors for further downside.
Would you buy at these levels, or are you waiting for more confirmation? Have a great weekend
Catch me with another exciting idea from WaveTalks- Market Whispers! Can You Hear Them?
ONGC - The Big Idea - Did You Check Them?
Regards,
Abhishek
WaveTalks

BankNifty: Magic of Historical Levels- Can we hold 49183?(Disclaimer: This analysis is for informational purposes only. Consult your financial advisor before making any trading decisions.)
As anticipated earlier in the day at 12:03 pm
BankNifty faced selling pressure right at the resistance zone of 49,600-49,665, leading to a sharp fall.
Sharp Fall After 45 mins of Patience at 12:45 pm
Was the sharp fall outcome of any pattern you recognise in ElliottWave - If so what is it?
Did you notice it halted in 49600-49665 zones & to be precise it was 49600---Wow!!!
Historical levels once again proved their significance, as we initially expected support near 49,350-49,375, but when momentum takes over, markets can surprise.
The big question ?
Will BankNifty hold at 49,183 & 48,900 (precisely 48,906), or are we set for a deeper plunge? The impulsive Y-Wave began at 47,845 in the WXYXZ proposed correction and if corrections tend to fully retrace, a test of those levels remains a possibility.
And what about Nifty? Could we see a slide towards 23,800? 🤔 Only time will tell.
Key Takeaways:
✅ Resistance worked like magic at 49,600-49,665.
✅ Support zones were tested but didn’t hold up in the sharp fall.
✅ Will 49,183 & 48,900 act as a base, or do we head lower to 47,845?
✅ Corrections often retrace fully—watch for further price action.
Historical levels remain key—markets have their own mind!
Catch Me With Another Exciting Episode from WaveTalks- Market Whispers! Can You Hear Them?

BankNifty - 300 Points Upside & 700+ Points Fall from Gap Zone
Rallied into the gap zone (51775-52000)—just as suggested! Did you read the last idea?
Last Idea on Bank Nifty
If yes, you’d have nailed the halt near 51740 & the pullback to 50951.
What a session for the day !
Regards,
WaveTalks
Market Whispers! - Can You Hear Them

BankNifty - 3000+ Points Fall With A Simple Trendline?BankNifty Analysis
Current Scenario:
- As discussed earlier, the rising trendline has been limiting the upside movement since the RBI Policy announcement on 6th Dec 2024
- The price is the primary indicator; economic news often lags behind price action. Elliott Wave Analysis highlights this effectively, using channels and trendlines as key tools.
- BankNifty is currently in a complex correction phase, experiencing a significant 3000-point fall from recent highs.
- Failed to hold 52600 which was important support level
Last BankNifty Idea - 6th Dec 2024
Support and Resistance Zones:
- Support Zones: 51150 – 50900
- Resistance Zones: Gap zone 51775 – 52000
Short-Term Trading Strategy:
1. Intraday Opportunities:
- If the gap zone (51775–52000) is filled, it will act as resistance. Traders should look for potential halts in the rally started from the 50609 lows.
- Watch for a pullback to the support zone (51150–50900) for possible buy setups.
2. Buying Opportunities:
- If the index holds above 50609 lows, look for opportunities to ride the upside towards the channel highs, where resistance is expected.
- Monitor price action near these critical zones to confirm your trade setups.
Outlook:
Santa Rally
- The much-anticipated "Santa Rally" may bring relief to domestic and global markets if the index manages to sustain above its support zones.
--------------------------------------------------------------------------------------------
Nifty Analysis
Current Scenario:
- Nifty has a positive bias as long as it holds above 23500.
- A breakout above 24180 will confirm the uptrend, paving the way for a move towards 24800 and potentially the 25000+ zone.
Support and Resistance Zones:
- Support Zone: 23500
- Resistance Zones: 24180, 24800, and 25000+
Short-Term Trading Strategy:
1. Upside Confirmation:
- A decisive move above 24180 could signal a buying opportunity for short-term traders, targeting 24800 and beyond.
2. Caution at Higher Levels:
- Traders should exercise caution near 25000+ levels as FIIs return from vacation, which may introduce volatility.
---------------------------------------------------------------------------------------------
Final Thoughts:
- Both indices are presenting potential short-term trading opportunities if key support and resistance levels are respected.
- Always use risk management strategies and avoid chasing moves without confirmation.
Wishing everyone a Happy and Prosperous New Year 2025! May your trades be profitable and your goals achieved. 🎉
From WaveTalks
Market Whispers - Can Hear Them!
Abhishek
