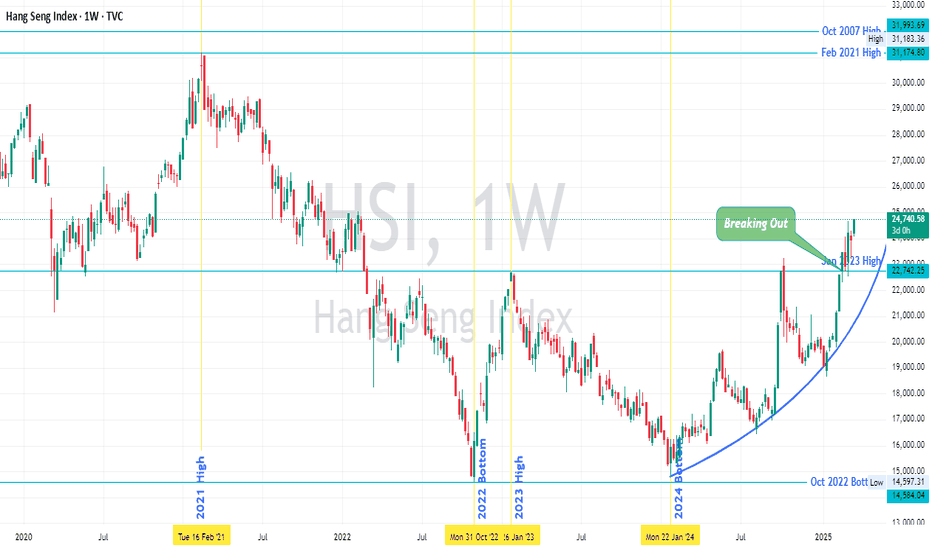
Hang Seng Index (HSI) 's Price Action vis-à-vis Major PivotsHSI seems to have broken out of last year's high (Oct 2024) and Jan 2023 high, and retested it too.
The index is about 67% from Jan 2024 low.
The next major pivot is Feb 2021 High, after that Oct 2007 High and then Jan 2018 High (all are marked on chart).
The price seems to be gaining momentum and moving parabolically, as marked on chart.
It seems price will move higher over months, of course there would be retracements.
As always it won't be as predictable as I have hypothesized above.
Nevertheless at this juncture price action is positive and depending upon price action further into the months the hypothesis will succeed or fail.
Trade Safe
Hang Seng HSI
Comparison of leading markets to anticipate the future movementAn attempt to anticipate the future movement of different markets over next 5 to 10 years. If we see the movement of 6 markets, we can have some insights.
Among the 6, Germany (DAX- purple) and India (NIFTY50 - red) look like being in the middle zone of the direction of movement since 1991.
Hong Kong (HSI - green ) came down gradually from around early 2018 to 2022, now looks at a fair level (may fall further to form a bottom).
USA(DJI - blue ) has recently started falling after forming a sharp peak, I am expecting a fall probably to 27500 levels or may go to 22000.
India (Nifty50 - red ) looks bullish for long term but may see a pullback to 15000 levels or even to 12000 levels in coming years.
UK (UKX - yellow) looks sideways and lacks long term strength as evident in the economy in recent times for United Kingdom.
France (CAC40-brown) looks sideways from a long term perspective.
Germany(Dax-purple) looks the most balanced in terms of bear and bull phases.
Overall it looks like the bear phase has started for most markets and it may take several years for healthy bull phase to be back.
HSI 1 Day Time Frame Chart - Short till 22050As after the bearish setup on daily time frame the market is falling making inverted flags again it looks like an inverted flag which is a decent flag. Targets can act as support or resistance, trade what you see. trail profits at every target or SL at cost.
Hang Seng near Make or Break levelsHang Seng CMP 26494
Sustaining above the red resistance trend line, HSI can potentially scale up to 28500 levels...
Alternatively wait for a dip towards 26244 levels. Holding that level one can look to enter for a Long trade with Stop Loss at around 25980. That provides a good Risk::Reward ratio.
This is for educational purpose only. Please do your own Analysis before taking any investment / speculative decisions.
Take care & safe trading...!!!


