BTC/USD - weekly Analytics + Altcoins 25.02.2022Technical situation in bitcoin is still uncertain, but at the same time we believe that correction from April 2021 is coming to the end. Buy entry tactics looks logically justified as at the moment there is an impulse movement, which gives us a reason to expect the continuation of the recovery (cancellation of the scenario of the exit below 34300). Plus, the investors' mood is at the pessimistic levels, which also increases the chances of upside. Further we will have to monitor the situation as the price moves.
Altcoins:
Among altcoins, we single out ETHEREUM and TRX as the most promising projects, which can grow several times.
I-BTC


Bitcoin | The Best Course Of Action Now | What To Do?Bitcoin (BTCUSD) is now in correction mode from the bearish wave... What is likely to happen next?
The conventional markets continue to look bad and ready to crash.
We have tons and tons of inflammation (or inflation?), the war is just another catalyst that can make the markets unpredictable everyday.
So what to do, what is the best course of action?
We have been bearish for long but nothing goes straight down or straight up...
Prices will fluctuate but with all this uncertainty, it is better to sitout, step-back, wait for things to unravel and only jump back in when the all the drama/noise is gone.
Late March the latest... Spring...
Thanks for the continued support.
Namaste.

BTC/USD is between S/R levelsHELLO FRIENDS, here we can see BTC/USD in 1 day time frame. now we can see a strong feb resistence at $41,500 and a support at $39,500. If the btc breakdown its resistence we can seemore 5% fall. Or if it pull backs and break its resistence we can see a recover to next feb level $46,784 and more.... FOLLOW FOR MORE

Bitcoin Corrects Over 84% From Major Bullish WavesThe title says it all...
Since many people are saying that the correction is already over or that whatever number is the "for sure" or "confirmed" low...
Let me share with you this chart.
We don't know exactly how far down it can or will go, we just know how Bitcoin behaves after each bullish top.
Over 84% right after 2013 and 2017.
So far we have seen -58% from the last top.
Just saying... There can be more.
Namaste.

Price Projection of Bitcoin per HalvingBitcoin Market Cycles
(Recommendation: It will be better to Watch it on Bigger Screen not on Mobile Device)

BTC Trend - Retest PhaseAfter filling the CME Gap and retesting the Mark of 40,000 BTC now moving upward...

BTC Bearish Pennant ?After a Sudden Drop due to several FUD, BTC is Consolidating under a major trend line and forming a Pennant.
M pattern already formed.
considering that .. Will it be a Bearish Pennant. or BTC will Bounce back ..
BTC will decide its path soon..
Let's wait for a clear breakout.
DYOR.

BTC CURRENT LEVELS WITH THE HELP of Ichimoku & FibonacciWelcome all , in this short video i will Discuss About BTC LEVELS FOR INTRADAY AND SWING TRADE WITH THE HELP OF ICHIMOKU & FIBONACCI

💡Don't miss the great buy opportunity in BTCUSD @BitcoinTrading suggestion:
". There is a possibility of temporary retracement to the suggested support line (41034.89).
. if so, traders can set orders based on Price Action and expect to reach short-term targets."
Technical analysis:
. BTCUSD is in a range bound, and the beginning of an uptrend is expected.
. The price is above the 21-Day WEMA, which acts as a dynamic support.
. The RSI is at 33.
Take Profits:
TP1= @ 44375.30
TP2= @ 45791.61
TP3= @ 49369.49
TP4= @ 51787.31
TP5= @ 55720.27
SL= Break below S2
❤️ If you find this helpful and want more FREE forecasts in TradingView
. . . . . Please show your support back,
. . . . . . . . Hit the 👍 LIKE button,
. . . . . . . . . . Drop some feedback below in the comment!
❤️ Your support is very much 🙏 appreciated!❤️
💎 Want us to help you become a better Forex / Crypto trader?
Now, It's your turn!
Be sure to leave a comment; let us know how you see this opportunity and forecast.
Trade well, ❤️
ForecastCity English Support Team ❤️


Bitcoin Enters Consolidation Phase (Short-Term 4H TA)We have a bearish bias developing once more short-term.
We have a strong rejection at the ~$45.5K resistance level on 10-Feb.
What follows is a lower high and a break below EMA10.
EMA50 is now being challenged as support and very likely to break.
If the resistance continues to hold, we will see Bitcoin next move to around $40,000 followed by $38K.
You can find additional support levels on the chart.
Namaste.

$Btc #Bitcoin possible iH&SAs highlighted in whight tint, looks like iH&S. You know the targets. Watching it to play out. Y'all views appreciated.

Bitcoin may form a ascending triangle. Here I am sharing my view on BTCUSDTPERP
Time frame 4hrs
bulls tried to take the price to their side though we can see double top formation around 45521, and price went to retest the previous resistance which is now a support (i.e 4200).
A successful bounce was seen from that zone to 4400. 4400 is a resistance zone which is above the neckline of previous double top pattern, so there are higher possibility of a breakout in upward direction.
if it breaks out we can see BTC around 45400.
Also, I can see a formation of ascending triangle, which means we can see BTC in the range of that triangle.
if the triangle forms nicely we can see stop loss hunt and fadeouts at the near end of the triangle before the real breakout or breakdown.
hope you liked my analysis please give your comments and let me know where I sound wrong to you.

Buying level for BTC Buy above the resistance with strict stop loss .
Also look for buying opportunity at SUPPORT levels .

Bitcoin might drop back to 40k SMC Hi traders, Here's my view on $BTC
Bitcoin is approaching an unmitigated OB and last imbalance, this imbalance is common on 30m & 1h, (44560) and on 15 m chart, another imbalance is there which might retrace till 50% of the 1h OB ()
For entry avoid getting in at 44560 , let it grab liquidity first and short on the mitigation of the levels
SL above OB & start trailing once imbalance () is filled
DYOR, I'm new to SAMC Concepts 😎

Clearly visiblePattern and trend clearly shows that it will take support on 40500-41200 and it will go up till 47-49k and then fall hard. Currently it will go up to complete its inverted HS

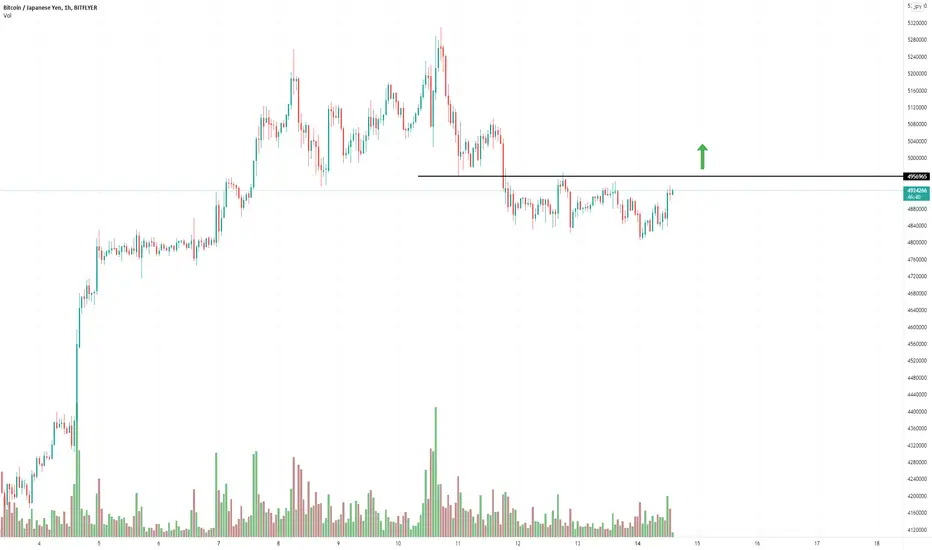
BTC/JPY - weekly Analytics + Altcoins 14.02.2022With high probability there will be a false-break from the level of 4957000 and quotes will move in the ascending direction. We believe that at this stage, the growing momentum and correction from April 2021 is completed, fixing above 5000000 will confirm this idea.
Further we will monitor the situation as there will be a probability of local pullbacks (which will not change the growing trend)
Altcoins:
Among altcoins, we single out ETHEREUM and TRX as the most promising projects, which can grow by times.
BTC/USD - weekly Analytics + Altcoins 14.02.2022With high probability there will be a false-break from the level of 42700 and quotes will move in the ascending direction. We believe that at this stage, the growing momentum and correction from April 2021 is completed, fixing above 43000 will confirm this idea.
Further we will monitor the situation as there will be a probability of local pullbacks (which will not change the growing trend)
Altcoins:
Among altcoins, we single out ETHEREUM and TRX as the most promising projects, which can grow by times.

Bitcoin vs Cardano, Ethereum, Solana, SPX, NDX & DJI + Altcoins I've been looking at the major US indexes (SPX, DJI & NDX), as well as some of the TOP Altcoins within the cryptocurrency market (Ethereum, Cardano, Solana, Polkador), they are all bearish right now on the major/weekly timeframe.
This week we saw mentions in the "news" about Bitcoin and the S&P 500 Index detaching... Sounds fishy.
Maybe detach over the weekend so we get a surprise dump on Monday...
We have a strong downtrend with Bitcoin since November 10 and we were expecting a bounce and the bounce took place.
Bitcoin set the low at $32,950 and bounced to $45,850, that's 39%, really strong.
This same level where we are seeing a rejection now matches EMA50 and EMA10 (around $44/$45,000).
The weekly candle hasn't close though, it closes in 6 hours from now but the bears are getting the upper hand on this chart.
There is some potential to see the Altcoins growing, the smaller ones, while Bitcoin and the major ones correct but, there is always an initial strong reaction if the big ones drop where everything drops... We just wait, it recovers in a few days.
Stay calm.
Keep a calm mind.
As spring comes (March) everything moves ahead (UP/GREEN!).
Thank you for reading.
Hit LIKE to show your support.
Namaste.

Bitcoin is Bearish.!!!After breaking the trend line, it got a resistance from 46k level which is also a 38% fib retracement area. If we are breaking 40500 level, we may retest the trend line which is 34500-35000 level. it will be invalid if we get a closing above 47k.

Bitcoin Weekly vs Altcoins, Potential Scenarios, Bottom, New ATHToday is Saturday and we approach the weekly candle close, we can look at multiple scenarios with the highest potential for Bitcoin in the coming days based on what we have today.
Let's get started.
(Read until the end and reply in the comments section with your potential scenarios or future predictions for Bitcoin and the Altcoins market)
Bitcoin Weekly vs Altcoins & More
We have the current candle (-1), and we have 3 candles before this one squared in light blue.
The (-2) candle from 24-Jan. gives us a hammer.
The hammer is a bullish candlestick and here it comes up right at the bottom of a trend, which is perfect because that's when the hammer is most effective.
The next candle (+1) we have a full green candle which confirms the signal given by the hammer; a reversal signal and later with this candle Bitcoin grows.
The current candle is good but the week is yet to close.
If this weekly candle closes above EMA10 ($44,210), we are looking really good and we can say probability favors that Bitcoin will go straight up.
But, if instead this candle closes below EMA10, there can be a drop that can take us to the next low or just a lower high for the bounce to fully show up.
We have many bullish Altcoins and if Bitcoin goes strong bearish they cannot grow.
Maybe we are going to be seeing Bitcoin going straight up or sideways, if it drops but ends at a higher low before growing this would support the Altcoins in their bullish move.
Once Bitcoin reaches the high for the bounce, then everything drops and we get the last low... With this new development in place, from the bottom, we can have some long-term growth...
We have several scenarios to consider but let me leave you with this one... Once spring comes, everything goes up.
It is the season.
Market cycles...
Only after we have a confirmed bottom, I will tell you about the next bullish run.
You are BIG!
YOU DESERVE THE BEST!
You are precious.
You are LIFE itself.
Value yourself...
Love yourself...
Choose to win.
And have some fun.
Namaste.

Bitcoin Cup & Handle Pattern + Name Your Altcoins (TOP 3!)Beautiful weekend my beloved cryptocurrency trader, that is what I seeing these days...
We have the classic Cup & Handle pattern in the Bitcoin chart (BTCUSD 4H) which is considered bullish and comes up after a correction/near support.
With this pattern in place and many Altcoins preparing to go up... We can expect Bitcoin to also jump if we stay above MA200 (now at $40,270).
You can find additional details on the chart.
Visit the "Related ideas" below for many Altcoins that are showing great potential.
Name Your TOP 3 Altcoins
Feel free to leave a comment & hit LIKE, now with your TOP 3/favorite altcoin pairs for me to look at in the coming days.
Thanks for your continued support.
Namaste.
