POL Could 3x After Breakout: Are You Buying the Right Zone?Price is consolidating above the accumulation zone ($0.19–$0.21) after multiple rejections off demand.
Now trading above this base, if price retests the zone, it could offer a high-probability entry.
Key Resistance = Targets: $0.28 → $0.41 → $0.52 → $0.70 → $1–$2
Structure remains valid above $0.150 (HTF close below = invalidation)
Break + Retest of $0.28 = Bullish continuation confirmed
Setup: Accumulation → Expansion
NFA & DYOR
I-XRP

XRP - 3.98 or move is comingXRP is following wave theory and price will see minimum 3.98 will be seen in this up move.

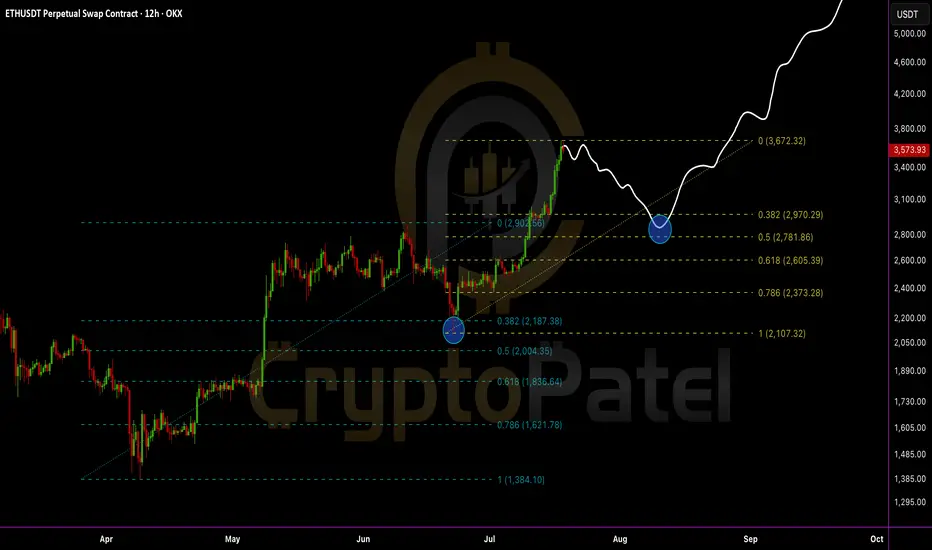
Everyone’s bullish now… but smart traders are waiting for this EEthereum just tapped a key resistance near $3,672 and is starting to show signs of cooling off.
A healthy retracement could bring ETH back to:
0.382 Fib – $2,970
0.5 Fib – $2,781
0.618 Fib – $2,605 (Strong demand zone)
IMO, we can expect ETH to revisit the $2,700–$3,000 zone before the next leg up.
This area will be the golden re-entry for long-term targets of $6,000–$8,000.
Stop-loss: Recent high and candle close above $3,675
Structure remains bullish:
✅ Previous dips into Fibs triggered strong buybacks
✅ Clean higher highs and higher lows
✅ Demand zone + retracement = opportunity
My View: Let price pull back. Then load up again. Bigger wave incoming.
DYOR | NFA
$XRP just broke its all-time high: $3.66CRYPTOCAP:XRP just broke its all-time high: $3.66 — and this is just the beginning?
After years of waiting, XRP finally explodes past $2 and hits $3.66 this bull run. It’s not just a win for XRP holders — it’s a lesson in patience, conviction, and catching early setups before the hype.
Why it matters now:
🔹 While everyone’s chasing the latest meme coin, XRP silently did a clean 7x from $0.50.
🔹 Regulatory clarity is improving — XRP’s bullish narrative is finally unfolding.
🔹 Market rotation is real: old giants like XRP are moving again, and this signals strength in Layer 1 comeback plays.
Quick breakdown:
📌 First signal at $0.50 → 7x
📌 Second entry below $2 → already 2x
📌 Current price: $3.66 (ATH)
📌 Many ignored it, some mocked it — but price tells the truth.
Patience beats hype. Quality setups > chasing pumps.
Save-worthy takeaway:
If you ever feel FOMO, remember this:
The best trades aren’t loud. They’re early, quiet… and require conviction.
What’s your biggest “I told you so” moment in this bull run?👇
Let’s hear your favorite early calls — drop them in the replies!

$PENGU is up 180% from our entry. Insane move.CSECY:PENGU is up 180% from our entry. Insane move.
Entry was around $0.010 — today it touched $0.0308. Almost 3x.
I booked 50% profits here. Still bullish, but I always play safe.
Profit booking is part of the game — don’t wait till it’s too late.
If you’re holding big — at least secure your free capital.
Then ride the rest with peace of mind.
What’s your move? Booked profits or still holding? 👇
Drop a comment + Retweet if you caught this run.
NFA & DYOR

THETA Price Prediction: Can It 20x From This Weekly Support ZoneMYX:THETA is now trading at a strong support area — the same zone where it started big moves in the past.
In previous cycles, from this level:
🔹 THETA went up over 2,700% (to $15.38)
🔹 Later, it again moved up around 570% (to $3.23)
🔹 Now, it's showing signs of a similar bounce from the same level.
Possible Future Price Levels:
Targets: $0.95 / $3.18 / $7.51 / $14.02
These are levels to watch if the upward trend continues.
⚠️ Risk Point:
If THETA falls and stays below $0.65, the setup will no longer be valid and it may go lower.
THETA – Fundamental Overview
🔹 THETA is a blockchain built for decentralized video streaming.
🔹 It lets users share internet bandwidth to help deliver videos and earn TFUEL in return.
Key Use Cases:
🔹 Powering video apps like Theta.tv
🔹 Creator-focused NFTs and content access
🔹 Web3 streaming, gaming, and AI tools
Backed by Big Names:
Google Cloud, Samsung, Sony, CAA, and more.
Real adoption, not just hype.
Token Model:
🔹 THETA: Staking + governance
🔹 TFUEL: Gas + rewards
Fixed supply = No inflation risk
Why It Matters:
As Web3 and AI grow, THETA could become the backbone of content delivery.
Key Takeaway:
🔹 This zone has worked well as a bounce point before.
🔹 THETA is reacting from it again now.
🔹 The potential reward is high, and the risk is limited if managed properly.
Keep an eye on it. This might be a good setup for long-term traders.
Let us know your thoughts & Would you invest in projects like THETA? 👇
Note: NFA & DYOR

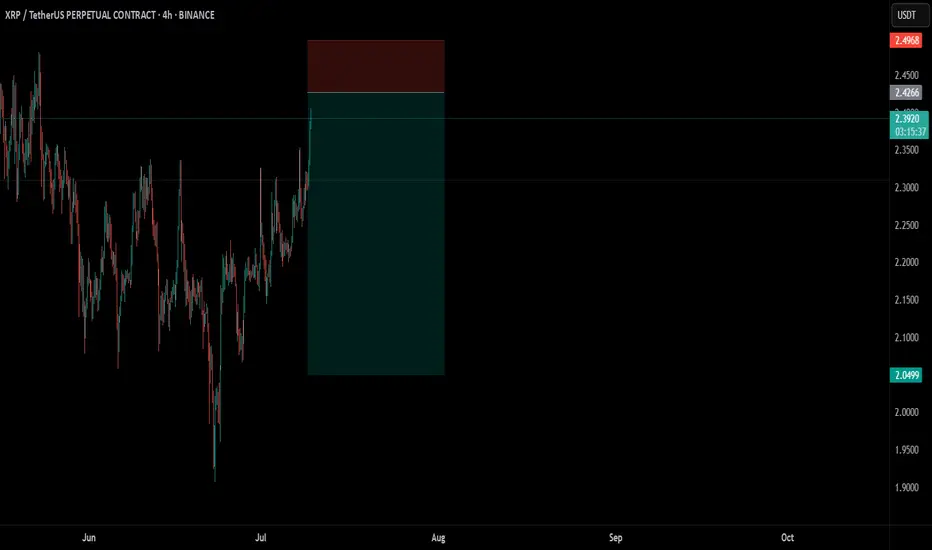
XRP Short OpprtunityThe $2.4261 level looks like an attractive entry point for a small CRYPTOCAP:XRP short position, as it aligns with a historical demand zone.
This is not financial advice. Always trade at your own risk.
ZKJ COIN DUMPING HARD — What’s REALLY Going On?ZKJ COIN DUMPING HARD — What’s REALLY Going On?
The price of Polyhedra Network’s $ZKJ has dropped sharply — falling over -87% in just a few days. But what’s really causing this?
A big reason is the token unlock on May 19 — over 15.5 million ZKJ tokens (worth around $30 million) were released into the market. That’s a lot of new supply, and many holders started selling.
At the same time, trading volume fell by 40%+, meaning fewer buyers and more pressure on price.
In total, ZKJ is down about 95% from its all-time high — and panic selling made things worse.
But here’s something most people are missing:
The project itself is still strong.
They have partners like Google Cloud, Revolut, Bima
zkPyTorch is live
📅 Heads up: Another big unlock is coming on June 19, so stay alert!

XRP Breakout Watch — Will June 16 Trigger a Bull Run?🚨 XRP Breakout Watch — Will June 16 Trigger a Bull Run? 🚨
CRYPTOCAP:XRP is holding above the key $2 support.
👉 A breakout above $2.65 → $3.00 is in play.
👉 Whale accumulation rising. Volume tightening.
👉 Ripple vs SEC ruling expected soon.
Targets if bullish: $3 → $8 → $13 🚀
Downside risk: Below $2 → $1.50 or lower.
Note: NFA & DYOR
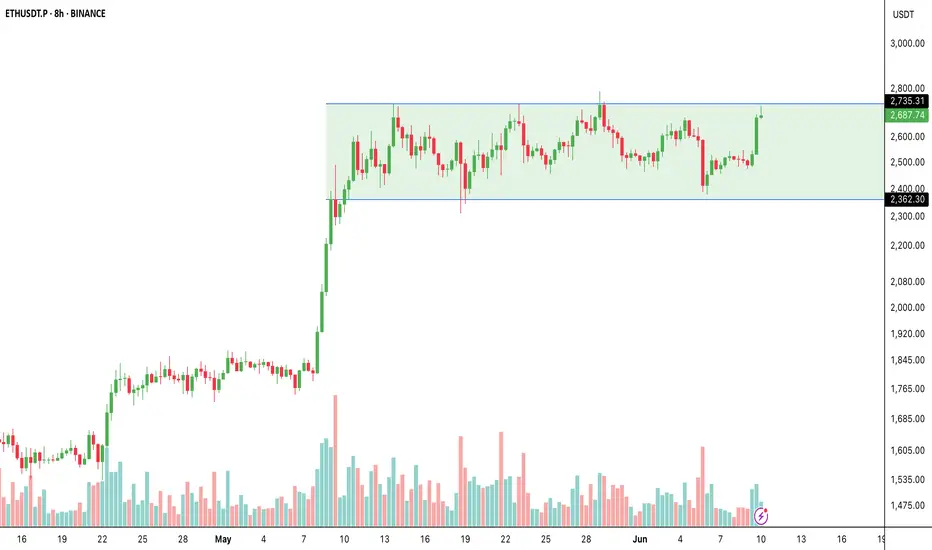
Ethereum Breakout Imminent?🚨 Ethereum Breakout Imminent?
CRYPTOCAP:ETH has been trading in a wide range:
👉 Support: ~$2,362
👉 Resistance: ~$2,735
Now ETH is once again testing this critical resistance zone with higher lows and rising volume — a classic breakout setup in play.
What to watch:
✅ Break & close above $2,735 → $2,800 → $2,900 → $3K
❌ Rejection → back to $2,400–$2,500 range.
Summary:
Ethereum is building momentum → next move could be explosive.
Will it break out or rotate? Stay sharp!
NFA & DYOR
Bitcoin is just 2% away from a new all-time high —will it break?Bitcoin is just 2% away from a new all-time high — will it break or fake? 🚀
BTC is currently trading near $109K–$110K, only 2% below the $112K ATH level.
Strong supports: $94,000 / $80,000
Bullish Case:
If BTC breaks $110K–$112K with strong volume + a bullish weekly close → we could see a rally toward: $135K → $150K
Bearish Case:
If BTC rejects at $110K–$112K, a deep retracement below $100K is possible. Watch for strong support at $100K and $80K levels.
My Personal Take:
I'm bullish overall — but since we’re this close to ATH, I’m opening a short trade with 3% stop loss targeting near $100K.
👉 Not financial advice — do your own research. The crypto market is highly volatile.
Watch this level closely — next big BTC move may be starting NOW. 👀

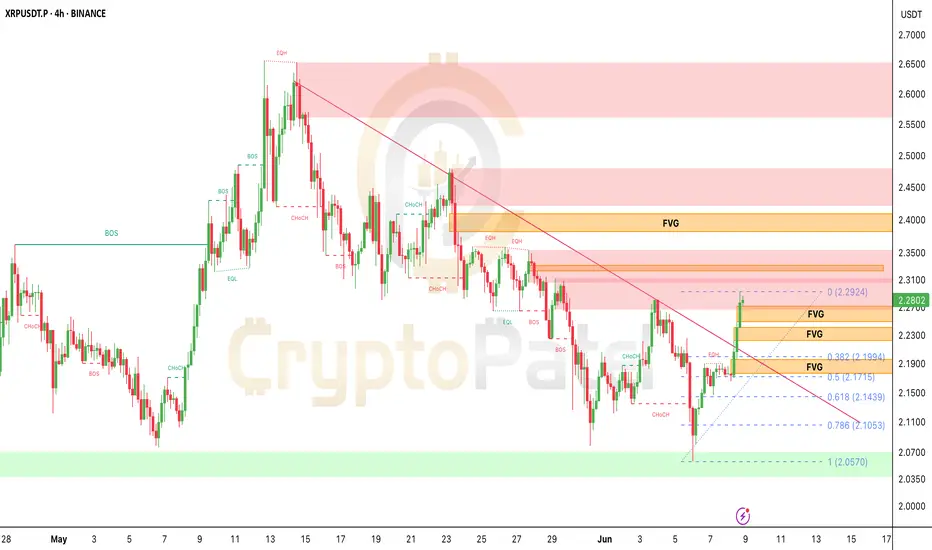
XRP/USDT 4H — Major Breakout Alert! 🔥 XRPUSDT 4H — Major Breakout Alert! 🔥
Here’s what I’m seeing right now on the XRP 4H chart:
✅ Bullish CHoCH + BOS → trendline broken → market flipped bullish.
✅ Testing $2.29 FVG → buyers pushing strong.
✅ Volume confirms true breakout.
🎯 Next upside targets → $2.36 → $2.42 (supply zone).
Best buy zone on pullback → $2.17-$2.14 (confluence of FVG + 0.618 Fib + demand).
Bias: Bullish → Only flips neutral if $2.14 breaks down.
Pro Tip: Wait for pullback if not in yet → better R:R at $2.17-$2.14 zone.
What’s your target for CRYPTOCAP:XRP this week? Comment below! 🚀
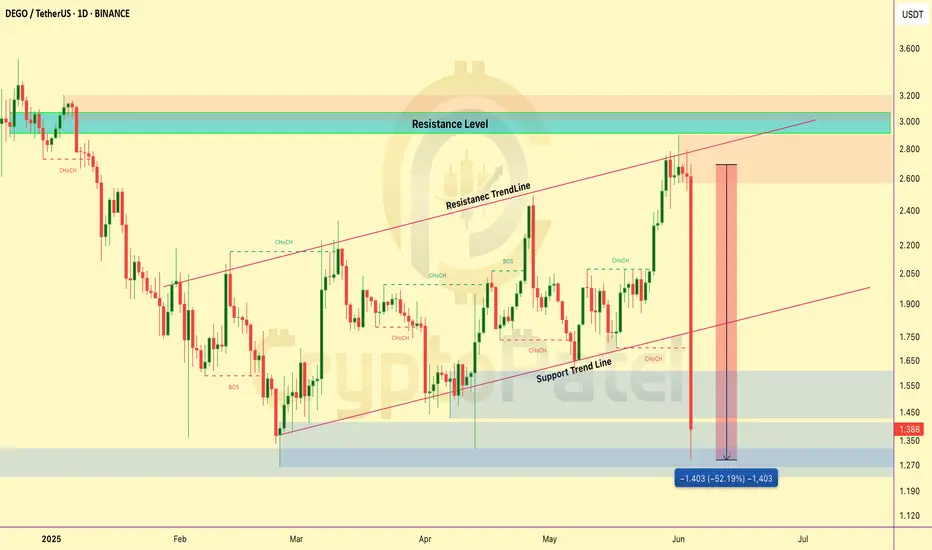
DEGO Price Dumped Hard – What Happened?🚨 DEGO Price Dumped Hard – What Happened?
Dego Finance ($DEGO) dropped over 40% today and here’s why:
🔻 Big Token Dump:
A huge amount of DEGO tokens (worth over $250K) was sent to exchanges — this caused heavy selling pressure.
💥 Record Liquidations:
Over $650K in long positions got liquidated — highest ever for DEGO!
⚠️ USD1 Stablecoin FUD:
DEGO recently said they bought the new USD1 stablecoin. Some users think this might be a risky or scammy move, adding more fear.
📉 Technical Rejection:
Price hit $2.70, then faced strong resistance and dropped fast. Bearish market conditions made it worse.
Stay alert! This is a high-risk zone — wait for stable support if you’re planning to enter.
BITCOIN WARNING – $104K IS KEY🚨 BITCOIN WARNING – $104K IS KEY
#Bitcoin is showing signs of weakness on the 4H chart! Let’s break it down:
🔻 Trend Shift Detected:
Recent CHoCH and BOS suggest the uptrend is over. Market structure has turned bearish.
Key Levels to Watch:
▪️ Support at $104K is being tested again. If it breaks, we may see a drop.
▪️ Next major targets:
➤ $100.5K (Unfilled Fair Value Gap)
➤ $98K – Strong demand zone
➤ $96.6K – Bullish Order Block + FVG confluence
Why It Matters:
▪️ Price rejected hard from the $107K zone (supply + FVG)
▪️ Liquidity was grabbed from Equal Highs
▪️ Now it’s hunting lower liquidity near $100K
⚠️ If $104K fails, get ready for a quick drop to $100.5K or even $96.6K
Plan: Short-term bearish unless BTC breaks back above $106K with volume.
Stay alert — volatility incoming!

$ME/USDT Technical Breakdown – What’s Happening?$ME/USDT Technical Breakdown – What’s Happening?
1️⃣ Market Shift:
We finally got a CHoCH (Change of Character) — the downtrend is likely over!
2️⃣ Support Bounce:
Price respected the strong support zone at $0.76–$0.83 and bounced hard 💪
3️⃣ Trendline Breakout:
A major descending trendline has been broken — signaling bullish momentum 🚀
4️⃣ Next Steps:
There’s an unfilled Fair Value Gap (FVG) below at $0.86–$0.95 — price might dip there to grab liquidity before flying again.
Possible Upside Targets: $1.40 → $1.70 → $2+
Don’t chase. Wait for the pullback = best entry!

ETHEREUM MEGA CYCLE ALERT🚨 ETHEREUM MEGA CYCLE ALERT 🚨
CRYPTOCAP:ETH just bounced from the same support zone that sparked its last bull run 🔥
This could be the start of Wave 5 — and if history repeats…
🎯 Target: $10,000 ETH
Last time this pattern showed up? ETH went 10x.
Don’t fade the chart.
👉 Like & Retweet if you’re riding this wave
👇 Tag a friend who’s still sleeping on ETH!

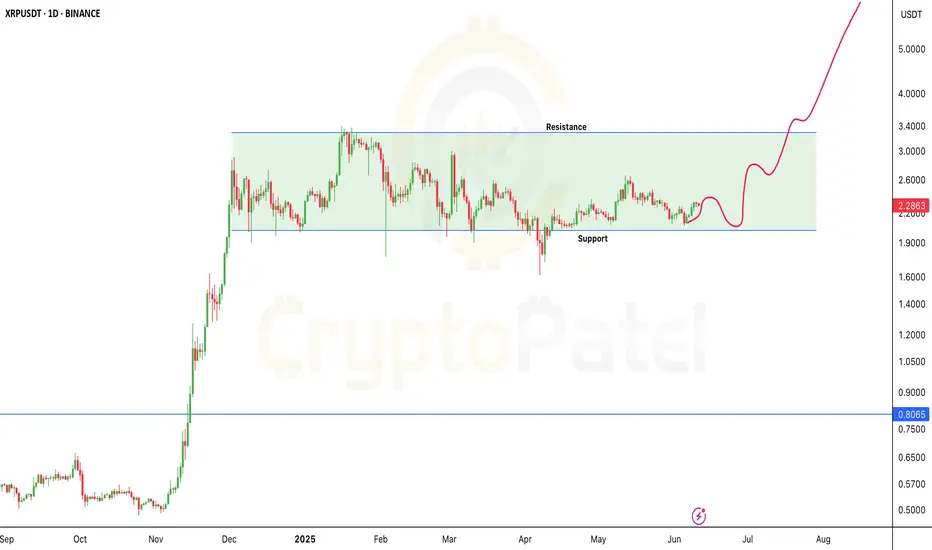
Will XRP hit $10 in this Bull Market?XRP Monthly Chart Update
Chart by: @CryptoPatel
CRYPTOCAP:XRP is looking super bullish right now!
✅ Strong breakout confirmed above the long-term resistance
✅ Price is holding the $2.00 level as new support
✅ Retest likely before the next major leg up
📈 Next major targets: $9.36 → $14.83
Structure is solid, volume building, and the bullish momentum is real.
We're early — $10+ is on the horizon!
Long-term holders, this might be your moment.

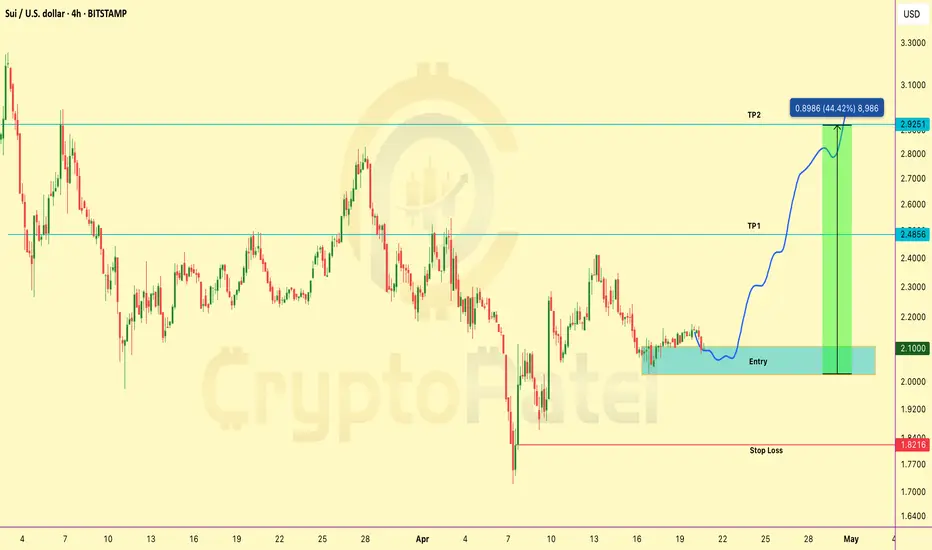
SUI/USDT Chart Analysis and Looking Long Setup for Good RRIf you're hunting clean setups with solid R:R — this CRYPTOCAP:SUI long looks 🔥
▶️ Entry: $2.10–$2.00
▶️ Targets: $2.48 / $2.92
▶️ SL: $1.82
Perfect for risk-managed apes. Don’t sleep on it.
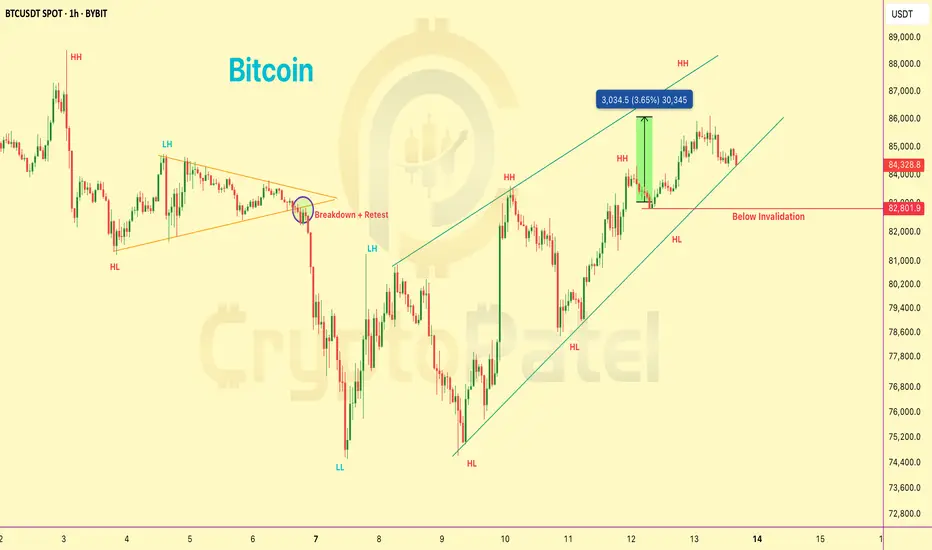
#Bitcoin 30 Minutes Chart Scalp profit Update:#Bitcoin 30 Minutes Chart Scalp Profit Update:
That quick scalp move delivered a clean +3.60% — just as planned. Scalp trades are meant for small, fast targets, and this one hit perfectly. ✅
But If Still holding?
🔹 Move SL to Break Even to protect capital
🔹 Structure looks fine for now, but don’t get greedy — manage your risk.
Always trade with a plan.
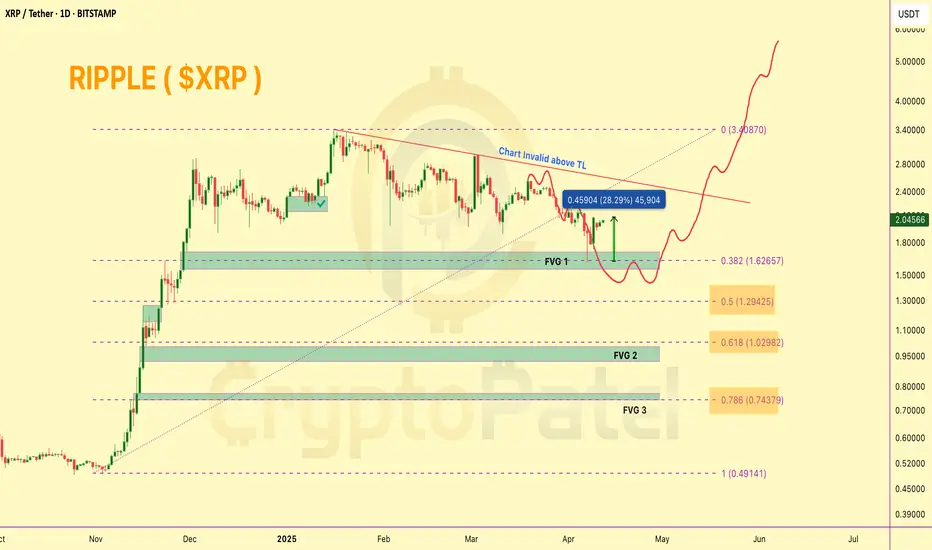
XRP Up 28% From Our Support Call – What’s Next?XRP Up 28% From Our Support Call – What’s Next?
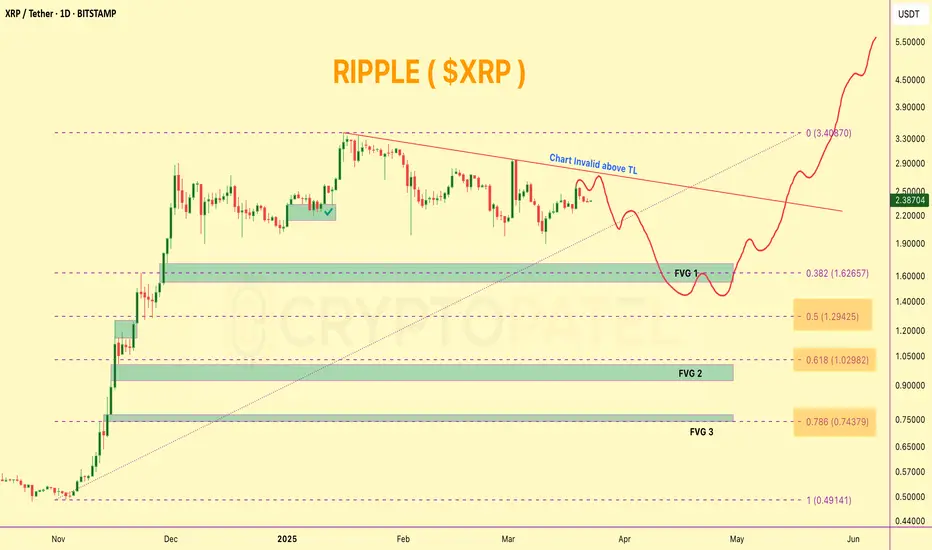
CRYPTOCAP:XRP perfectly respected the FVG 1 zone around $1.60, which we previously marked as a strong support. Since then, price has rebounded over 28% from that level.
Hope you didn’t get caught buying the $2.40–$2.50 zone — as warned, that area showed signs of exhaustion, and price has dropped 30% since.
What’s Next?
If bullish momentum continues, #XRP could revisit the $2.40–$2.50 resistance area. However, this zone may act as a rejection point once again.
From there, we could potentially see a pullback toward $1.30 and $1.00, which aligns with FVG support zones and the 0.5–0.618 Fib retracement levels — key areas where a strong bounce is likely.
🟢 Macro Bias: I remain bullish on XRP/USDT in this cycle and still expect a move toward $7–$10 in the broader bull market. Best entries will likely come during dips into major support zones.
❌ Invalidation Level: This chart setup gets invalidated on an HTF close above $2.50.
Keep it smart — entries on dips, not at tops. 👀
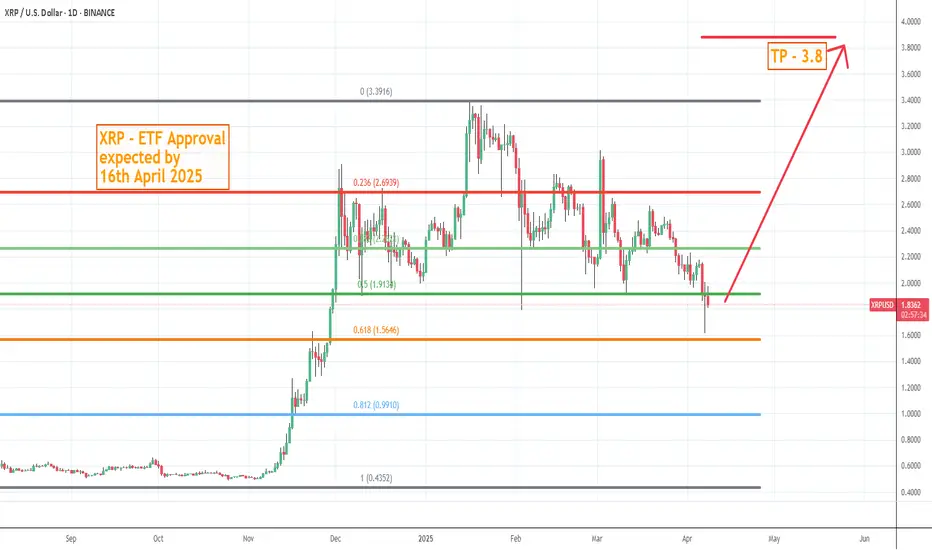
XRP - Bullish due to ETF Approval by 16th April 2025. BuyXRP - Bullish since price is at fib levels for buying and never came below that. ETF Approval by 16th April 2025 is keeping bullish and more accumulation and openly talked in media. ETF Approval means new buyer for XRP. Already Japan using this for govt related payments for its people. Big banks using in big way and having even more bigger plans with US Govt and official websites taking about XRP... This will rise 100 X as well in 2025 or coming years
The Market Looks Brutal Right Now... But Stay With MeThe Market Looks Brutal Right Now... But Stay With Me
It feels like a bloodbath out there… but here’s the truth:
A fast and brutal dump is honestly better than a slow, painful bleed. It shakes out the weak hands quickly—and sets the stage for stronger recoveries.
We've seen this movie before:
▪️ The Covid flash crash
▪️ War shocks like Russia vs Ukraine
▪️ Black swan events like FTX blowing up
▪️ The chaos of the LUNA death spiral
➡️ Each time, fear dominated the feed.
➡️ Each time, the "This time it's different!" crowd got louder.
➡️ And each time, those who stayed calm and DCA’d into real projects walked away with massive wins.
So why should this time—just because of tariffs or macro FUD—be any different?
It’s not.
Zoom out.
The long-term trend is built on strong fundamentals, not headlines.
Stick to the plan: accumulate multi-cycle, high-cap coins. Ride the wave.
The short-term noise fades, but smart strategy compounds.

XRP Technical Breakdown – 3 Key Gaps Identified!🚨 XRP Technical Breakdown – 3 Key Gaps Identified!
Hey fam! 👇
I just spotted 3 major GAPS on the CRYPTOCAP:XRP Daily Chart, and they could play a crucial role in XRP’s next big move!
Gap Zones to Watch:
1️⃣ GAP 1 – $1.712 to $1.546
2️⃣ GAP 2 – $1.00 to $0.9268
3️⃣ GAP 3 – $0.772 to $0.64
My Take (IMO):
✔️ In this current super bullish market, GAP 1 has a high probability of being filled before the next leg up toward $5+.
However, if we rely purely on Technical Analysis + Fibonacci levels, the chart indicates that GAP 2 & GAP 3 might need to be filled first before a sustainable upside.
Based on the Fib retracement, if CRYPTOCAP:XRP revisits the 0.618 - 0.786 zones, it could create a powerful reversal and bounce setup from there. That’s a key confluence level for long-term holders and swing traders.
High Liquidity Zones = Opportunity Zones!
All 3 GAPs align with areas of high liquidity – ideal for setting strategic buy orders if you're playing the safe accumulation game.
📢 What do you think?
Do you believe Ripple can drop below $1 again before a new ATH?
Let’s discuss – drop your TA in the comments 💬👇