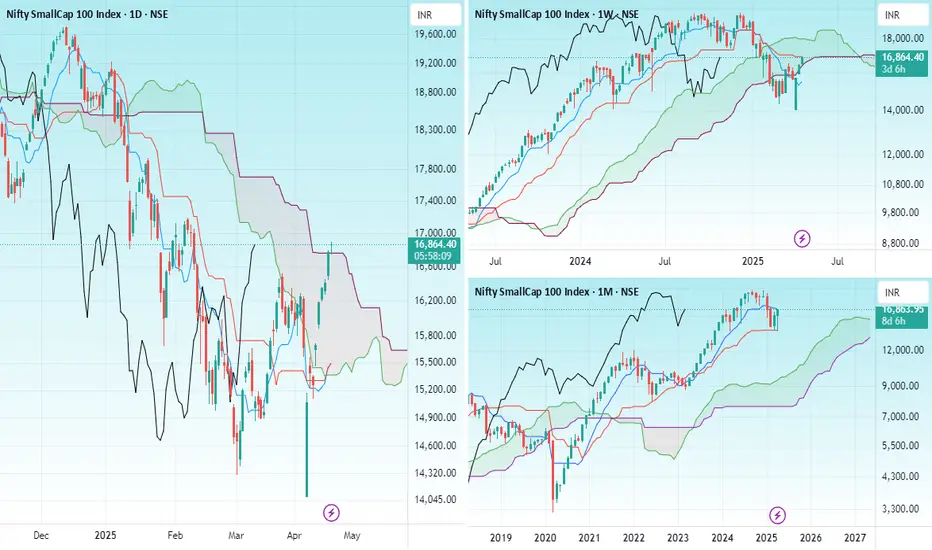
SMALL CAP INDEXHello & welcome to this analysis
The index appears to be ending a wedge pattern near an Ichimoku cloud resistance with future Kumo bearish. It also has a slanting channel upper trendline resistance approaching.
The wedge would be considered broken below 17775, downside levels where it could then retrace to would be the Ichimoku Base line near 17400 and if that fails to hold it could further retrace till 16600 where it would form a Bullish Harmonic Gartley.
The PRZ of the Gartley coincides with a gap up area and the slanting channel lower trendline.
This bearish view would be invalid above 18150
All the best
Ichimokuscholar

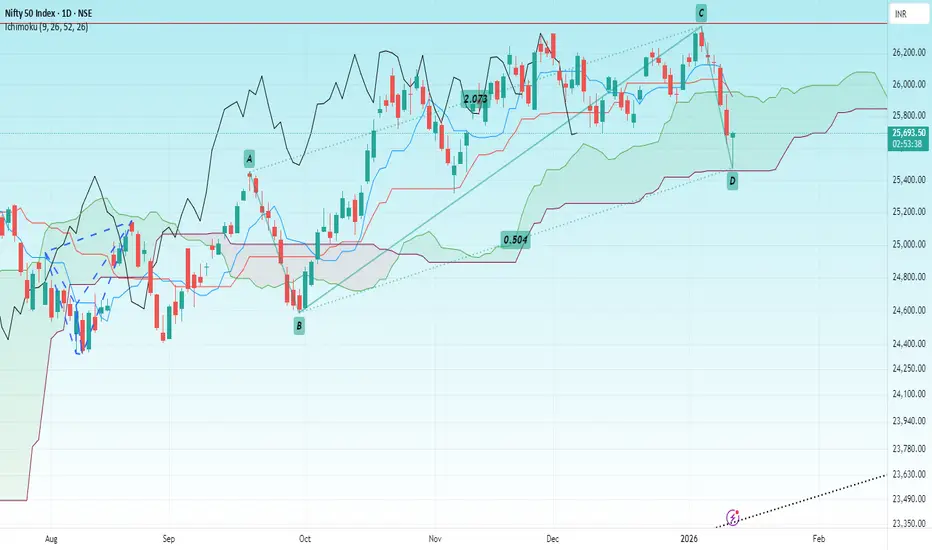
NIFTYHello & welcome to this analysis
Nifty has made a Bullish Harmonic Reciprocal ABCD pattern that coincides with Ichimoku Kumo support
If it sustains above 25650 then a bounce/reversal can be expected till 25800 / 26000 for now.
The view will go wrong below 25375
All the best
CRUDEHello & welcome to this analysis
USOIL / CRUDE (MCX) after a very sharp rally till the slanting channel have now retraced to very strong support levels as per the ICHIMOKU indicator in daily time frame.
One could look for a 4hrs reversal candle confirmation between $64.50 - 63.75 / INR 5625 - 5450 for a resumption of rally till $77 / INR 6900 with resistance on its path at $68.50 & $74 / INR 5825 & INR 6400
Remember enter only after you get a bullish candle confirmation from lower time frame.
All the best

SMALL CAP INDEXHello & welcome to this analysis
The index gave a sharp bounce back like the rest of the market and is now near a cluster resistance - monthly, weekly & daily @ 16900.
It could consolidate in this zone before trying a breakout for 17500 else dip down to 16000 where it has good support.
Fresh buying in small caps at current levels for short term should be done with caution else wait for breakout above 16900 or dip down to 16000 approx.
DLFHello & welcome to this analysis
In the hourly time frame after a steep correction followed by consolidation its now on the verge of an Inverse Head & Shoulder breakout above 695 for probable upward levels of 740 & 800.
It has very good support near 670 as shown by the Ichimoku Kumo
All the best

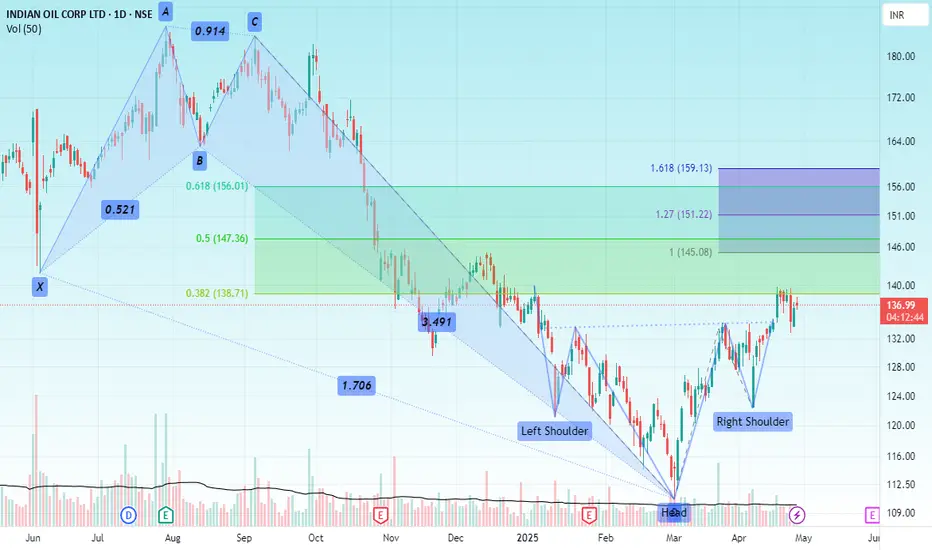
IOCHello & welcome to this analysis
A deep 6 months correction lead to the formation of a Bullish Harmonic Crab pattern in March 2025 post which during accumulation (consolidation) phase formed an Inverse Head & Shoulder.
A 38% retracement of the bullish harmonic pattern has been done and now its completing a pullback of the IHS breakout by retesting the neckline.
Potential upside levels are 145 and 160 for both the IHS & Bullish Harmonic Crab
All the best
Hindustan UnileverHello & welcome to this analysis
FMCG sector appears to be doing better then other sectors after a very long time with Hindustan Unilever having a large weightage in the sector
Strength signal -
Since 2008 it has never violated the Quarterly Ichimoku Base line nor the Monthly Ichimoku Cloud. Near these support levels it becomes a very attractive value buy. This time also in 2024 it did the same.
After giving a Cup & Handle breakout in the weekly time frame its seen a pullback since October 2024 along with the rest of the market. In the last 3 weeks its gone sideways whereas we have seen other sectors continue to see sharp selling. Once again highlighting that current level is seeing consistent buying support. The pullback appears to have been completed as it bounced back from its rising trend line.
A daily falling wedge breakout has also witnessed a pullback now. As long as it now holds the rising trendline at 2350 it has good potential for upside suggesting a decent low risk high reward set up from short to medium term.
Upside levels one can look out for above 2400 are at 2700 / 3100 / 3300 / 3600
All the best for your trading and investing
My last video on the stock link is shared

KOTAK BANKHello and welcome to this analysis
The bank has been an underperformer against both Bank Nifty & Nifty since 2020.
It has been in a sideways range of 1625 - 2000 since the last 40 months.
Short covering above 1760 with a bullish harmonic bat near 1640
Happy Investing

Life Insurance Corporation of IndiaHello & welcome to this analysis
Stock has been very turbulant since its listing.
Initially a sharp disappointment for IPO investors and then a super duper rally from lows giving investors a 100% return.
However in the last few weeks its gone into a sideways zone.
Resistance at 1000-1050 with support at 850-800
Good stock to accumulate if 800 holds for decent upside

SBI CARDSHello & welcome to this analysis
Stock has been a major underperformer continuously making lower high and lower low.
In the immediate short term it needs to start sustaining above 720 to witness short covering and then above 750 it could witness institutional buying.
Failure to hold 690 on daily an 680 on weekly basis could lead to further weakness.
All the best with your investing and trading

UNION BANK OF INDIAHello & welcome to this analysis
Bank stock currently consolidating near a support in short term appears wobbly.
Below 125 it could slip down to 110-90 where it could once again see smart money buying it.
Resistance for now between 145-155, only above that in my opinion it would see any upside momentum
Overall medium to long term outlook appears very bullish, dips would be an opportunity to add.
Happy Investing

Ambuja CementsHello & welcome to this analysis
In the short term resistance is near 685 with support at 640 below that 600
Upside potential for the stock above resistance is at least till 800
Overall a very strong stock with not many deep reversals.
Happy Investing

ACCHello & welcome to this analysis
ACC in weekly and daily is consolidating near its highs.
Breakout if it sustains above 2650 else on decline strong support formation near 2500-2450
Overall strong stock with a great track record
Happy Investing

TARSONS PRODUCTSHello & welcome to this analysis
A small cap stock recently listed in November 2021 has been on a downhill after making a double top in weekly time frame continuously making lower highs & lower lows.
As of now earliest sign of reversal is above 450-475 while any decline till 360-370 could find it at the support of a Bullish Harmonic ABCD pattern.
Happy Investing

Graphite IndiaHello and welcome to this analysis
A likely triangle taking place currently in higher time frame suggesting breakout above 775 or support (likely last leg of triangle) at 550-450.
Overall short term could be sideways, medium to long term appears bullish.
Happy Investing

TAJ GVK HOTELSHello & welcome to this analysis
After a 16 years consolidation the stock has given a breakout.
Any dip could be a wonderful opportunity to add for medium to long term.
Happy Investing

ATUL AUTO LTDHello and welcome to this analysis
In the higher time frame stock has reacted from its all time high zone, if 475-425 is not protected then the possibility of a double top in monthly time frame should not be ruled out.
Current resistance zone 575-625 above that resumption of strong uptrend probable.
Happy Investing

JUBILANT INGREVIAHello & welcome to this analysis
The stock after a strong retracement has gone into a sideways trend mainly due to the sector seeing sharp decline.
Currently in a triangle in weekly time frame, a breakout is probable above 515 while further downside should not be ruled out if it breaches 400.
Overall fundamentally a strong stock one could keep an eye for breakout and or accumulate with proper risk management in case of failure/exit.
Happy investing

IRFCHello & welcome to this analysis
After a super run in 2023 its now in a retracement with support at 130 and below that at 100.
Resistance is at 155 and then 165 - sustaining above these levels it could see a decent upside in the medium to long term
Happy Investing

NBCC (INDIA) LTDHello & welcome to this analysis
The stock after seeing a 90% retracement from 2017 to 2020 and see a strong rally, recently going past its previous ATH made in 2017.
It has resistance around 145 with possibility of strong upside above it and support at 100 and below that near 75.
Happy investing

J KUMAR INFRA PROJECTS LTDHello & welcome to this analysis
JKIL is a small cap infra co which has in higher time frame been making higher highs and higher lows since its listing.
Currently trading around a resistance.
Fresh breakout above 715 with strong support near 550
All the best with your investing and trading strategies

NIFTY IT INDEXHello & welcome to this analysis
IT Index looks v strong, this phase of consolidation would be a great opportunity to add more.
Breakout above 38100 for 38500-39500-45000 with immediate support at 37300, below that next major support near 36500.
Happy investing

KOTAK MAHINDRA BANKHello and welcome to this analysis
India's large private bank has been in a sideways trend for over 2 years now.
It appears that this sideways trend could continue further until it breaks above 1850 on the upside or 1750 on the downside.
The Relative Strength of the stock with its parent index Bank Nifty and with Nifty is not showing any signal as of now for any outperformance.
Happy Investing
