ICICIBANK - Inverted Head & Shoulder suggests 1450ICICI Bank has completed a clean Inverted Head and Shoulders pattern on the 4H chart, signalling a possible trend reversal after the recent downtrend. The left shoulder formed near 1360 , the head at 1317 , and the right shoulder at 1354 . All three points reflect stronger structure and consistent buying interest on dips. The stock has now crossed the neckline around 1387–1390 , a zone where it faced repeated rejection earlier. This breakout shows that buyers have finally taken control.
If the price continues to hold above the neckline, momentum is likely to push it toward the projected target of 1440–1450 , which matches the “final destination” zone shown on your chart. The breakout would lose strength only if the price falls back below 1387 , but unless that happens, the pattern suggests the move still has room to extend higher.
Icici

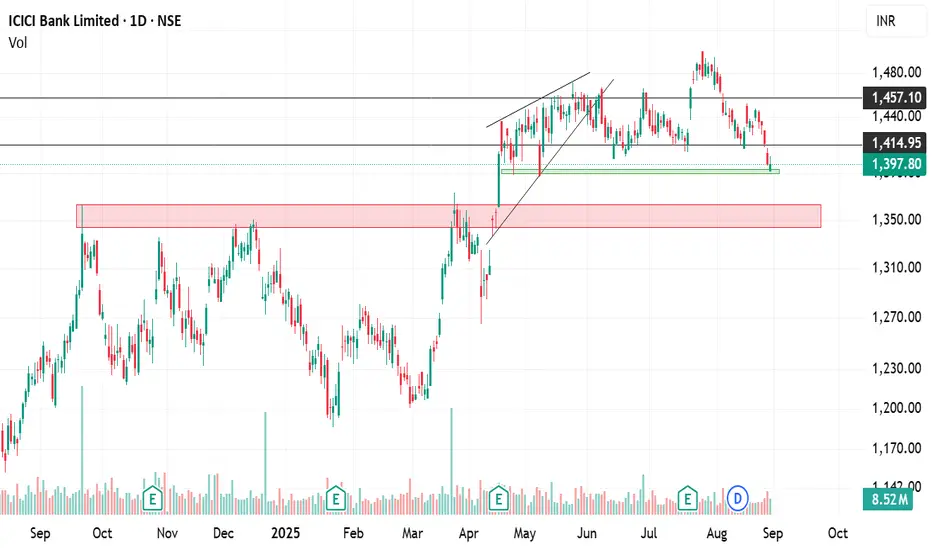
ICICI Bank Under Pressure: Breakdown Could Open ₹1,360–1,340ICICI Bank has been exhibiting persistent weakness over the past few sessions, underperforming relative to the broader market and showing clear signs of profit-booking. Despite being one of the stronger banking names in the past, the stock has recently struggled to sustain upward momentum, reflecting near-term bearish undertones.
Currently, ICICI Bank is trading around a crucial support band of ₹1,400–1,390. This zone has historically acted as a strong base, where buying interest has emerged in the past. However, repeated testing of this support without a meaningful bounce raises concerns about its sustainability.
A decisive breakdown below ₹1,390 could accelerate weakness and potentially drag the stock towards ₹1,360 and ₹1,340 levels, which are the next major support zones. These levels are important markers that could determine the medium-term trend.
On the upside, for sentiment to improve, the stock must sustain above ₹1,400–1,420 with strong volumes. Until then, caution is advised, as the undertone remains weak, and any breakdown may invite further selling pressure.
Part 4 Learn Institutional Trading Introduction to Options
Financial markets provide several instruments to trade and invest. Among equities, futures, commodities, and currencies, options trading has gained significant popularity worldwide, including India. Options are not just speculative tools; they are also powerful instruments for hedging, income generation, and risk management.
An option is essentially a derivative contract—its value is derived from an underlying asset like a stock, index, commodity, or currency. Unlike direct stock ownership, an option gives the buyer rights but not obligations. This unique feature makes them versatile but also complex for beginners.
To truly master options, one must understand not only the basic definitions but also pricing, market psychology, and strategies.
Basic Terminology
Before diving deeper, let’s go through the essential terms:
Option Contract: Agreement between buyer and seller based on an underlying asset.
Underlying Asset: Stock, index, commodity, or currency.
Strike Price: Pre-decided price at which the option can be exercised.
Expiry Date: The last date on which the option can be exercised.
Premium: Price paid by the buyer to acquire the option.
Lot Size: Minimum quantity for which an option can be traded.
European vs. American Options: European can be exercised only on expiry; American anytime before expiry.
How Options Work in Practice
Option buyers have limited risk (premium paid) but unlimited profit potential (in calls if stock rises, in puts if stock falls).
Option sellers have limited profit (premium received) but potentially unlimited risk.
This asymmetric payoff structure creates a market where traders, hedgers, and institutions interact.

5 Defensive & Growth Sectors Perfect for Dip Buying1. Pharmaceuticals & Healthcare
Why It’s Defensive
Healthcare is a necessity, not a luxury. People need medicines, hospitals, and diagnostic services regardless of economic conditions. That’s why pharma and healthcare stocks are considered defensive – they remain resilient even during recessions, global slowdowns, or financial crises.
For example, during the COVID-19 crash of March 2020, while many sectors collapsed, pharma stocks quickly recovered and even surged due to global demand for medicines, vaccines, and hospital services.
Why It’s Growth-Oriented
Rising global healthcare spending: Aging populations in developed countries and increasing middle-class income in emerging markets boost demand.
Innovation in biotech & generics: Indian pharma companies are global leaders in generic drugs and are expanding into biosimilars, CRAMS (Contract Research and Manufacturing Services), and specialty medicines.
Telemedicine & digital health: Healthcare is undergoing digital transformation, creating new growth avenues.
Dip Buying Opportunities
Pharma stocks often face sharp corrections due to regulatory concerns, USFDA observations, or temporary pricing pressures. These dips are usually opportunities because:
Core demand for healthcare doesn’t vanish.
Once regulatory issues are resolved, stocks bounce back strongly.
Defensive nature ensures limited downside risk.
Example: Sun Pharma, Dr. Reddy’s, and Cipla often correct 15–20% due to quarterly margin pressures, but these are great accumulation zones for long-term investors.
Investment Strategy
Focus on large-cap pharma for stability and mid-cap specialty companies for higher growth.
Accumulate in phases during 10–20% marketwide corrections.
Diversify across hospitals, diagnostics, and pharma manufacturing for balanced exposure.
2. FMCG (Fast-Moving Consumer Goods)
Why It’s Defensive
FMCG companies sell essentials – food, beverages, personal care, and household products. Even in recessions, people continue buying soaps, biscuits, and packaged goods. This makes FMCG stocks highly resilient.
Historically, FMCG stocks like Hindustan Unilever (HUL), Nestlé, and Dabur have delivered steady returns regardless of market cycles. Their low volatility and strong brand loyalty make them classic defensive plays.
Why It’s Growth-Oriented
Rural consumption growth: Government spending on infrastructure and rising rural incomes increase demand for everyday goods.
Premiumization: Consumers are upgrading from basic to premium products.
Export opportunities: Many Indian FMCG firms are expanding into Southeast Asia, Africa, and the Middle East.
E-commerce & D2C channels: Online retail is boosting FMCG distribution and margins.
Dip Buying Opportunities
FMCG stocks rarely see sharp falls, but when markets correct heavily, they too trade at attractive valuations. These dips are perfect to accumulate:
High dividend yields add to returns.
Sector is less affected by inflation and currency swings.
Low-beta nature reduces portfolio volatility.
Example: ITC was ignored for years due to regulatory risks in its cigarette business, but patient investors who accumulated during dips saw multi-fold returns once FMCG growth kicked in.
Investment Strategy
Look for market leaders with strong distribution networks.
FMCG works best for long-term compounding, so use SIP-style accumulation.
Mix large brands (HUL, Nestlé) with emerging challengers (Marico, Emami).
3. Information Technology (IT) & Digital Services
Why It’s Defensive
At first glance, IT may not seem defensive, but global outsourcing and digitization trends provide resilience. Indian IT companies like TCS, Infosys, and HCL Tech derive a majority of revenues from recurring service contracts with global clients, ensuring steady cash flows.
Even during global slowdowns, IT spending often shifts from discretionary projects to cost-saving digital initiatives – keeping demand steady.
Why It’s Growth-Oriented
Digital transformation: Cloud computing, AI, data analytics, and cybersecurity are high-growth areas.
Global outsourcing demand: Companies worldwide seek cost efficiency, benefiting Indian IT firms.
New-age verticals: FinTech, healthtech, and e-commerce drive additional IT services demand.
High free cash flow: IT majors regularly return cash to shareholders through buybacks and dividends.
Dip Buying Opportunities
IT is cyclical and often corrects sharply when:
The US or Europe signals a slowdown.
Clients cut IT budgets temporarily.
Currency fluctuations impact quarterly results.
But these dips are ideal for accumulation because long-term demand for digitization is irreversible.
Example: During 2022, IT stocks corrected 30–40% due to global slowdown fears. Investors who accumulated Infosys and TCS during the correction are sitting on solid gains as digital spending picked up again.
Investment Strategy
Large-caps for stability (TCS, Infosys).
Mid-cap IT for higher growth (LTIMindtree, Persistent Systems).
Accumulate during 20–30% corrections in IT index.
Avoid chasing small-cap IT unless fundamentals are strong.
4. Banking & Financial Services
Why It’s Defensive
Banking is the backbone of any economy. Regardless of cycles, credit, deposits, and payments continue. In India, the financialization of savings and increasing credit penetration make banking a structural growth story.
Defensive elements include:
Strong regulatory framework by RBI.
Essential role in supporting all other industries.
Diversification across retail, corporate, and digital lending.
Why It’s Growth-Oriented
Credit expansion: India’s credit-to-GDP ratio is still low compared to global averages, leaving massive room for growth.
Digital finance: UPI, fintech partnerships, and mobile banking expand customer reach.
Insurance & asset management: BFSI sector is diversifying into wealth management and insurance.
Consolidation: Strong banks gain market share when weaker NBFCs or PSU banks face stress.
Dip Buying Opportunities
Banking stocks are volatile due to:
Rising interest rate cycles.
NPA concerns.
Global macroeconomic risks.
But dips often reverse quickly because banking demand is long-term.
Example: In 2020, HDFC Bank corrected sharply due to lockdown fears, but within a year, it made new highs as loan growth revived. Similarly, SBI’s turnaround post-2018 NPA cycle rewarded patient investors.
Investment Strategy
Private banks (HDFC Bank, ICICI Bank) for stability.
Select PSU banks (SBI, Bank of Baroda) during dip cycles.
NBFCs like Bajaj Finance for higher growth.
Accumulate gradually since BFSI can be volatile.
5. Energy & Power (with Renewable Focus)
Why It’s Defensive
Energy is a basic necessity. Industries, households, and transportation all rely on it. Demand for electricity, fuel, and energy infrastructure rarely collapses, making this sector defensive.
Why It’s Growth-Oriented
Renewable revolution: Solar, wind, and green hydrogen are the future, creating massive growth opportunities.
Government push: India targets net-zero emissions by 2070, meaning long-term policy support.
Rising demand: India’s power consumption grows consistently with urbanization and industrialization.
Energy diversification: Companies are shifting from traditional coal-based power to renewables, ensuring sustainability.
Dip Buying Opportunities
Energy and power stocks often correct due to:
Regulatory tariff changes.
Fuel cost fluctuations.
Global crude oil price swings.
But long-term demand remains intact, making dips valuable entry points.
Example: NTPC and Tata Power corrected during coal price hikes but bounced back as renewable capacity additions boosted valuations.
Investment Strategy
Balance between traditional leaders (NTPC, Power Grid) and renewable-focused players (Adani Green, Tata Power).
Accumulate during dips linked to global crude swings.
Long-term horizon needed, as renewable projects take time to scale.
How to Approach Dip Buying in These Sectors
Phased Buying: Don’t invest all at once. Break your investment into tranches and buy during market-wide or sector-specific corrections.
Valuation Discipline: Even defensive sectors can be overvalued. Wait for P/E multiples to come back to reasonable levels.
Diversification: Spread investments across all five sectors to balance risk and growth.
Use ETFs/Mutual Funds: If stock-picking is tough, sectoral ETFs or actively managed funds provide easier access.
Stay Patient: Dip buying works when you hold through recovery cycles. Avoid panic selling.
Conclusion
Market dips are uncomfortable but essential for building wealth. Instead of fearing corrections, smart investors use them to accumulate quality sectors. The five sectors we discussed – Pharma & Healthcare, FMCG, IT & Digital Services, Banking & Financials, and Energy with Renewables – combine the best of both worlds: resilience during downturns and strong growth potential during expansions.
By adopting a disciplined dip-buying approach, investors can build a portfolio that not only weathers volatility but also compounds steadily over time. Remember, corrections are temporary, but the growth stories of these defensive sectors are structural and long-term.
If you position yourself well, every market dip can become your wealth-building opportunity.

India’s Growing Derivatives Market & Weekly Expiries1. Introduction
Financial markets act as the lifeblood of an economy, channelizing savings into productive investments. Within these markets, derivatives have emerged as a vital instrument for managing risk, enhancing liquidity, and providing opportunities for speculation and arbitrage. India, which once lagged behind developed economies in terms of derivatives trading, has today become one of the most vibrant derivative markets in the world.
A unique feature of India’s equity derivatives market is the introduction of weekly expiries, which has not only boosted participation but also changed trading patterns significantly. Weekly options, in particular, have become extremely popular, contributing to record-breaking turnover in Indian exchanges.
This essay explores the growth of India’s derivatives market, the mechanics of weekly expiries, their impact on market behavior, and what lies ahead for India in the global derivatives landscape.
2. Understanding Derivatives
Derivatives are financial contracts whose value is derived from an underlying asset such as equities, indices, commodities, currencies, or interest rates. The main types of derivatives include:
Futures – Contracts obligating the buyer to purchase or the seller to sell an asset at a future date at a predetermined price.
Options – Contracts that give the buyer the right, but not the obligation, to buy (Call) or sell (Put) the underlying asset at a set price before or on expiration.
Swaps – Agreements to exchange cash flows or other financial instruments, often linked to interest rates or currencies.
Forwards – Customized contracts similar to futures but traded over-the-counter (OTC).
Derivatives are used for:
Hedging risk against adverse price movements.
Speculation to profit from price volatility.
Arbitrage opportunities from price discrepancies across markets.
In India, the primary focus has been on exchange-traded derivatives, particularly index futures, stock futures, index options, and stock options.
3. Historical Evolution of Derivatives in India
The Indian derivatives market has grown in phases:
Pre-2000s: Derivatives trading was virtually non-existent, with forward contracts and informal hedging practices dominating.
2000: NSE introduced index futures, followed by stock futures and options. This marked the formal beginning of exchange-traded derivatives.
2001-2010: Rapid growth with increasing investor participation. Index options gained popularity, especially on Nifty 50.
2010-2015: Introduction of new products, including currency derivatives and commodity derivatives, deepened the market.
2016-Present: Weekly options expiries on Bank Nifty (later Nifty and FINNIFTY) fueled a new wave of retail and institutional interest.
Today, India ranks among the largest derivatives markets globally in terms of contracts traded, with a massive rise in retail participation driven by technology, mobile trading, and lower transaction costs.
4. Structure of India’s Derivatives Market
Key Exchanges
National Stock Exchange (NSE): Dominates equity derivatives trading with over 90% market share.
Bombay Stock Exchange (BSE): A smaller share but gaining traction through products like Sensex options.
MCX & NCDEX: Commodity derivatives platforms.
Key Products
Index Derivatives: Nifty 50, Bank Nifty, and FINNIFTY options are the most liquid.
Stock Derivatives: Futures and options on large-cap and mid-cap stocks.
Currency Derivatives: Dollar-Rupee and other currency pairs.
Commodity Derivatives: Gold, crude oil, agri commodities, etc.
Participants
Retail traders (rapidly growing, especially in weekly options).
Institutional investors (mutual funds, FIIs, insurance companies).
Hedgers (corporates and banks).
Speculators & arbitrageurs (seeking short-term opportunities).
5. Weekly Expiries in India: The Game Changer
What are Weekly Expiries?
Traditionally, derivatives contracts had monthly expiries. For example, Nifty options would expire on the last Thursday of every month. However, NSE introduced weekly expiries in 2016 for Bank Nifty options, later extending to Nifty 50 and FINNIFTY.
Bank Nifty Options: Expire every Thursday.
Nifty Options: Expire every Thursday (with monthly still available).
FINNIFTY Options: Expire every Tuesday.
Sensex Options (BSE): Expire every Friday.
This means traders now have contracts expiring almost every day of the week, providing more flexibility and opportunities.
Why Weekly Options Became Popular?
Low Premiums: Since weekly options have a shorter time to expiry, they trade cheaper, attracting retail traders.
Quick Turnover: Traders don’t have to wait an entire month; they can capture short-term moves.
High Liquidity: Bank Nifty and Nifty weekly options see some of the highest daily turnover in the world.
Speculative Opportunities: High leverage and volatility near expiry days create big profit (and loss) potential.
Hedging Short-Term Events: Earnings announcements, policy decisions, and global events can be hedged with weekly contracts.
6. Impact of Weekly Expiries on Indian Markets
Positive Impacts
Liquidity Surge: Weekly expiries brought unprecedented liquidity to Indian options markets.
Retail Participation: The affordability of weekly premiums made derivatives accessible to small traders.
Revenue for Exchanges: Explosive growth in contracts traded significantly increased exchange turnover.
Efficient Hedging: Corporates and institutions can hedge short-term risks more precisely.
Negative Impacts
Rise in Speculation: Retail traders often take excessive risks, leading to high losses.
Increased Volatility on Expiry Days: Option writers adjust positions aggressively near expiries, causing intraday swings.
Behavioral Issues: Many retail traders view weekly options as “lottery tickets,” leading to unhealthy trading habits.
Conclusion
India’s derivatives market has transformed from a fledgling sector in the early 2000s into a global leader in contract volumes. The introduction of weekly expiries revolutionized participation, making derivatives more accessible, liquid, and event-driven.
While weekly options have opened doors for small traders, they also bring higher risks due to speculation, volatility, and leverage. For India, the challenge lies in nurturing this growth while safeguarding investors through education, regulation, and innovation.
If managed well, India’s derivatives ecosystem will not only support domestic financial stability but also position the country as a leading hub for global derivatives trading.
Trading Master Class With ExpertsHistory & Evolution of Options
Options are not a modern invention. Their roots go back thousands of years.
Ancient Greece: The earliest recorded use of options was by Thales, a philosopher who secured the right to use olive presses before harvest. When olive yields turned out abundant, he profited by leasing the presses at higher prices.
17th Century Netherlands: Options became popular in the Dutch tulip mania, where people speculated on tulip bulb prices.
Modern Options: Organized option trading as we know it started in 1973 with the creation of the Chicago Board Options Exchange (CBOE). Alongside, the Black-Scholes model for option pricing was introduced, which gave traders a scientific framework to value options.
Today, options are traded globally — from U.S. exchanges like CBOE, CME, and NASDAQ to Indian platforms like NSE’s Options Market. They’ve also expanded into forex, commodities, and even cryptocurrencies like Bitcoin.
Why Traders Use Options
Options serve different purposes:
Investors: Hedge portfolios (e.g., protective puts).
Traders: Speculate on price moves (buying calls/puts).
Institutions: Manage risk exposure across assets.
Market Makers: Provide liquidity and earn spreads.
Risk Management in Options Trading
Options can wipe out capital if not managed properly. Key practices include:
Position Sizing: Never risk more than a fixed % of capital.
Stop Loss & Exit Rules: Define risk before entering.
Diversification: Avoid concentrating all trades on one asset.
Understanding Margin: Selling options requires large margin because risks are unlimited.
Hedging: Use spreads to limit risk.

Day Trading Secrets1. Understanding Market Structure: The Foundation of Day Trading
A critical secret in day trading is a thorough understanding of market structure. Day traders succeed by identifying trends, reversals, and consolidation patterns in the price action.
1.1 Trends, Ranges, and Volatility
Trending Markets: Prices move in a clear direction (up or down). Trading with the trend increases probability of winning trades. Common tools to identify trends include moving averages (e.g., 20 EMA, 50 EMA) and trendlines.
Ranging Markets: Prices oscillate between support and resistance levels. Here, traders often adopt mean-reversion strategies, buying near support and selling near resistance.
Volatile Markets: Characterized by large intraday swings. High volatility can provide opportunities for quick profits but increases risk. Traders should reduce position size during extreme volatility.
1.2 Support and Resistance
Support and resistance are fundamental in intraday trading. Key secrets include:
Multiple Confluences: Look for levels supported by prior price action, moving averages, and pivot points.
Breakouts vs. Fakeouts: True breakouts are accompanied by strong volume; fakeouts trap traders who enter prematurely.
1.3 Price Action Analysis
Reading price action is a secret skill that most beginners overlook. Candlestick patterns such as engulfing candles, pin bars, and inside bars provide high-probability setups. Intraday traders also pay attention to wick size and rejection patterns, which indicate potential reversals.
2. Risk Management: The Trader’s True Secret Weapon
The most overlooked secret in day trading is disciplined risk management. Without it, even the best strategy will fail.
2.1 Position Sizing
Never risk more than 1-2% of your trading capital on a single trade.
Example: If your capital is ₹1,00,000, maximum risk per trade should be ₹1,000-2,000.
2.2 Stop-Loss Discipline
Always use a stop-loss to limit losses.
Move stops only to reduce risk, not to give trades more room to breathe.
Intraday traders often use volatility-based stops, e.g., ATR (Average True Range) multiples, to adapt to changing market conditions.
2.3 Reward-to-Risk Ratio
Target at least 2:1 or higher.
Example: Risk ₹1,000 to make ₹2,000. This ensures profitability even with a 50% win rate.
2.4 Avoid Overtrading
Trading too frequently increases transaction costs and emotional fatigue.
Stick to high-probability setups and ignore low-confidence trades.
3. Timing the Market: Session Secrets
Day trading isn’t just about picking the right stock or asset; it’s about trading at the right time.
3.1 Market Sessions
Opening Hour: Most volatile. First 30-60 minutes see rapid price movements due to overnight news and order imbalances.
Midday: Lower volatility. Traders often reduce positions or avoid trading.
Closing Hour: The last hour (3:00–3:30 PM in India) often sees trend continuation or reversals, useful for final profit-taking or scalping.
3.2 Economic & News Catalysts
Earnings announcements, RBI rate decisions, and geopolitical news often create predictable intraday volatility.
Secret: Align trades with expected volatility; avoid trading before major news without proper hedging.
4. Technical Tools & Indicators: Using Them Wisely
While no indicator is a secret shortcut, smart day traders use them selectively to increase confidence in trades.
4.1 Volume Analysis
Confirms breakout strength.
High volume during a breakout often signals continuation, while low volume signals potential failure.
4.2 Moving Averages
Short-term MAs (9 EMA, 20 EMA) help spot intraday trend changes.
Long-term MAs (50 EMA, 200 EMA) provide dynamic support/resistance and trend direction.
4.3 VWAP (Volume Weighted Average Price)
VWAP helps determine intraday market value.
Secret: Price above VWAP = bullish bias; price below VWAP = bearish bias.
4.4 RSI & MACD
RSI helps identify overbought/oversold levels, especially in ranging markets.
MACD aids in spotting momentum shifts, but avoid using it in isolation.
5. Psychological Edge: Mastering Emotions
The biggest secret in day trading is controlling your mind. Emotional discipline separates profitable traders from losers.
5.1 Fear and Greed
Fear causes missed opportunities; greed causes overtrading.
Secret: Develop a calm, rule-based approach to reduce emotional interference.
5.2 Patience
Wait for confirmation before entering trades.
Avoid chasing moves or averaging down impulsively.
5.3 Focus on Probabilities
No trade is guaranteed. Focus on high-probability setups and statistical edges, not outcomes.
5.4 Journaling and Reflection
Track every trade: entry, exit, reasoning, emotional state, and result.
Secret: Reviewing mistakes is faster learning than practicing more trades blindly.
6. Advanced Day Trading Secrets
Beyond basic strategies, professional intraday traders employ advanced techniques to gain an edge.
6.1 Order Flow Analysis
Analyzing Level II market data reveals big players’ intentions.
Watching how bid-ask sizes change can indicate potential support/resistance flips.
6.2 Scalping
Involves taking quick, small profits repeatedly.
Requires high focus, fast execution, and low latency platforms.
6.3 Algorithmic Assistance
Some traders use automated strategies to identify setups or execute trades faster than manual execution.
Secret: Automation reduces emotional mistakes and ensures discipline in repetitive strategies.
6.4 Multi-Timeframe Analysis
Secret: Confirm intraday trades using multiple timeframes. For instance, a 5-minute trend aligned with a 15-minute trend increases probability of success.
6.5 Market Sentiment
Track news sentiment, social media trends, and institutional flows.
Secret: Extreme optimism or pessimism often precedes intraday reversals.
7. Common Mistakes and How to Avoid Them
Even seasoned traders fall into traps. Awareness of these common pitfalls is a secret advantage.
Chasing the Market: Entering late after a strong move often leads to losses.
Overleveraging: High leverage increases risk exponentially.
Ignoring Market Context: Technical setups fail if macro conditions are unfavorable.
Lack of Routine: Consistency comes from structured preparation, not luck.
8. Crafting Your Day Trading Blueprint
A practical secret to success is having a routine:
Pre-Market Preparation: Analyze key support/resistance, trending sectors, and news catalysts.
Market Open Strategy: Focus on high-volume setups, avoid impulsive trades.
Intraday Adjustments: Use technical confirmations, maintain strict stop-loss discipline, scale positions cautiously.
Post-Market Review: Analyze trades, document lessons, and adjust strategy.
9. Tools, Platforms, and Resources
Successful day traders rely on the right tools:
Trading Platforms: Fast execution and Level II data are essential.
Charting Software: High-quality charts for price action and indicators.
News Feeds: Real-time news helps anticipate intraday volatility.
Backtesting Tools: Test strategies using historical data to understand edge.
Conclusion
Day trading secrets are not about shortcuts; they are about disciplined habits, market understanding, and continuous improvement. The “secrets” professional traders use include:
Mastering market structure and price action
Strict risk management and position sizing
Timing trades around market sessions and news
Selective use of indicators
Psychological control and journaling
Advanced techniques like order flow analysis and scalping
Consistent profitability comes from following these principles day after day, maintaining discipline, and adapting to market conditions. While there is no guaranteed formula, applying these secrets systematically can give traders a real edge in the highly competitive world of intraday trading.
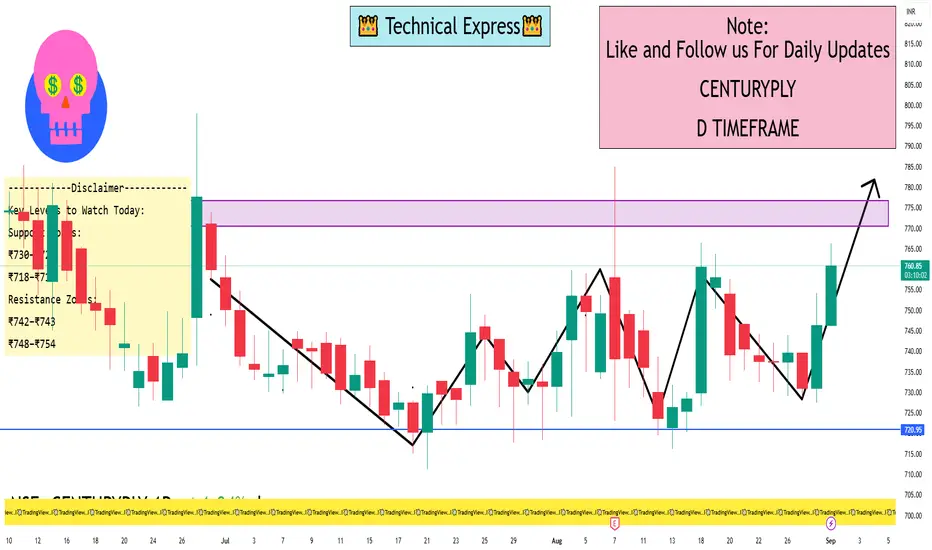
CENTURYPLY 1 Day ViewPrice Levels:
The stock was trading around ₹734.60, slightly down from the previous close of ₹735.60 (–0.14%)
Another snapshot shows ₹736.25 (with a range of ₹731.65 to ₹743.05)
These minor differences reflect changes across different timestamps and data sources—typical for live market quotes.
Daily Technical Indicators:
TradingView indicates a “Strong Sell” for moving averages and an overall “Sell” signal today on a 1-day timeframe
Investing.com mirrors this, also showing a “Strong Sell” on daily technicals
Investing.com India (Investing India) recently noted that on the daily frame, moving averages present a “Strong Buy” outlook (10 Buy vs. 2 Sell signals), but overall the daily technical status is Neutral—Oscillators and indicators were mixed
Moneycontrol's daily technical rating is again Neutral with classic pivot levels suggesting:
Resistance (Classic pivot):
R1: ₹742.90
R2: ₹748.45
R3: ₹754.90
Support:
S1: ₹730.90
S2: ₹724.45
S3: ₹718.90
Key Levels to Watch Today:
Support Zones:
₹730–₹724 (key range where buyers may emerge)
₹718–₹719 (lower buffer if weakness continues)
Resistance Zones:
₹742–₹743 (initial cap, also R1 pivot)
₹748–₹754 (secondary resistance levels)
These include pivot points and typical price-level touchpoints for intraday traders
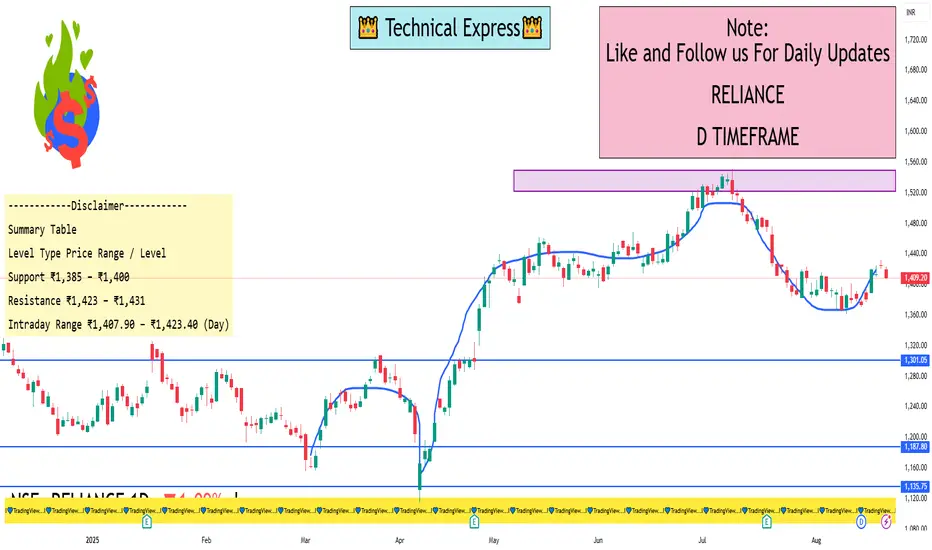
Reliance 1 Day View Key Levels (1-Day Time Frame)
Based on data from Investing.com and Moneycontrol:
Day’s Range: ₹1,407.90 – ₹1,423.40
Recent Daily High (Aug 21): ₹1,431.90
Recent Daily Low (Aug 11): ₹1,361.20
From chart commentary (TradingView):
Support Zone: ₹1,385–1,400
Resistance Level: Around ₹1,423–1,431
Interpretation & Notes
Intraday activity shows movement between roughly ₹1,408 to ₹1,423.
A daily low near ₹1,408 may serve as short-term support; breaking below could test the ₹1,385–1,400 zone.
On the upside, a close above ₹1,423–1,431 might open potential to push higher.
Remember: technical levels provide guidance, not guarantees—market dynamics and fundamentals can shift price action quickly. Always cross-check with live charts and broader analysis.
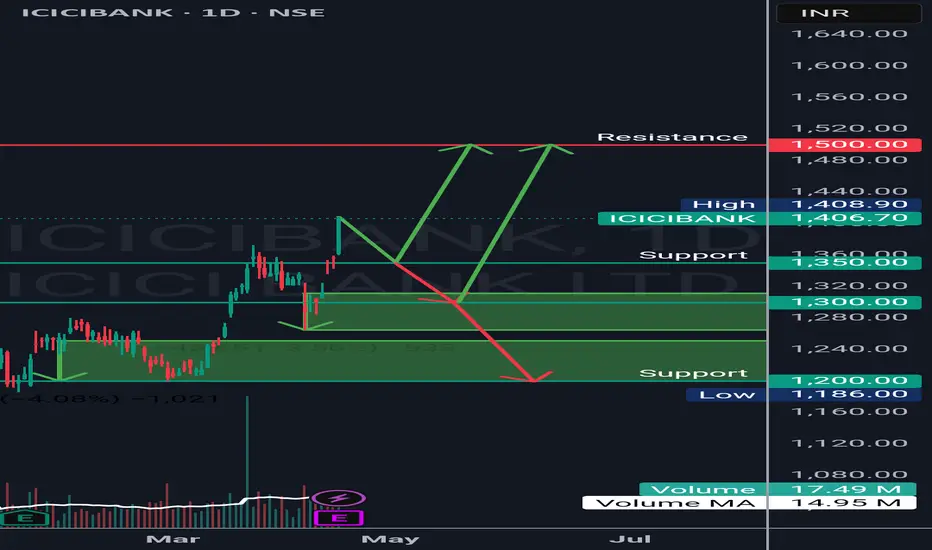
ICICI Bank A New Life Time HighICICI has made a new life time high.
It's now 1406
Its target could be 1500
But who ever wants to enter the rally should wait for it to retrace till 1350 and then check the price action.
If it gives bullish view enter with SL 1300 Target 1400 and Trail till 1500
If it gives bearish view then wait till 1200
ICICI Correction Nearby , Weaker Volumes with Price increase May retest the 1290 Zone , with upward potential upto 10% from current price 1345 , as consolidation of one week and sudden surge on the last day of the week seems a bit unusual thing .

25th Oct 2024 - IndusInd lower circuit, ICICI Bank will save us?BankNifty Stance Bearish ️⬇️
BN has fallen only 2.46% ~ 1283 points and is much better than Nifty on a relative basis. IndusInd Bank took a huge beating on Friday as it fell ~ 18.63% due to poor quarterly results. Indian stock markets are not used to such wild reactions, but if our markets start punishing stocks for bad results, I guess it is much better for the future. Ideally, such reactions on stock prices will keep the management on their toes to avoid poor results thereby helping them put in the necessary hard work to achieve the desired results.
ICICI Bank will react to its results today, since we are in a bearish hold, would like to see if Sell on Rise is applicable on this scrip. The main point to consider is that ICICI has more than 27% weightage on BankNifty and is single handedly capable of bringing out BN from the Bear hold.
51101 is my first resistance level above which I will change the stance to neutral. For real bearish momentum to pick up, we need to fall below 49704.

Whats Next for Nifty and Bank Nifty ? More Gains Ahead ? Both Indexes have finally moved together and have given massive breakouts!!
Nifty Next journey 26300-26450 level
Bank Nifty above 54150 level should see 57250 level
Over indexes have great strength.

ICICI Prudential 850 ?After forming a good corrective ABC pattern and forming a head and shoulder pattern ICICI Prudential are ready for long at current price.
I have mention the impulsive Elliot wave counts projection

ICICIBANK can turn bearish can turn heavy bearish if 62 RSI is broken on a monthly time frame, please do not miss this opportunity and keep the stocck in watchlist.
Wait for RSI to dip below 60 and watch how the trend reverses because the support has been taken on 60 around 3 times

20 Feb ’24 — Stance revised to bullish for BankNifty ⬆️⬆️⬆️BankNifty Analysis - Stance Bullish ⬆️
Yesterday we discussed the possibility of HDFC Bank making a move and quite fortunately that came true today. We rallied an impressive 769pts ~ 1.66% today to take out the first resistance (bearish trendline break). Would you believe the elephant jumped 2.63% today along with AXIS Bank 2.41%, Kotak Bank 1.8%. ICICI Bank & SBI was not that stimulated today, even then we managed to rally hard today. Notice the blue-encircled regions where we spent time today trying to break out. The momentum from 14.03 to close was the main and the only reason we had that break through today, otherwise we would have spent the time following the resistance slope.
4mts chart
On the higher timeframe, the break above the bearish channel is loud and clear. But we are below the 47465 resistance line (orange color). Since we have an expiry tomorrow and because BN attained the bullish stance today, we expect those levels to be tested and broken by tomorrow itself. Being in trading, we cannot always remain optimistic and expect things to happen our way - that's why we engineer stop losses and fix reversal levels. In case something like that happens tomorrow, we will see if the bears are keeping BN below the blue channel line - if yes, we will reverse our stance back to neutral and wait for the next trigger.
63mts chart
Algo Trading
Our algo trades ended today with a gain of Rs6904. We stopped the algo at 14.24 as a breakout was looking imminent. We will have to backtest it tomorrow to see if it was the right decision.

19 Feb ’24 — A New All-Time Highs - 22186 Nifty50 ⬆️⬆️⬆️Nifty Analysis - Stance Bullish ⬆️
Recap from yesterday: “From 15th Dec 2023 to 15th Feb 2024 — Nifty was in a narrow range of 21491 to 21913 with a couple of false breakouts/breakdowns. So we are keeping our fingers crossed this time to validate whether it works out. One way to do that is to check for follow-through price action. Blips do not last that long and we usually fall below the resistance (just like what happened on the last 2 occasions).”
4mts chart
The price action today was totally predictable. The break above the resistance of 21913 had an impact on Indian stock markets. Even though SPX & NDQ ended their last session with a loss of 0.48 & 0.9% respectively, it did not stop us from hitting a new all-time high of 22186 today. We even started gap-up followed by sensible price action to close the gap, get the footing, and then rally to new highs. Once we hit the HOD, there was a minor profit booking and we ended the day only with a gain of 81 points.
BankNifty did not show its strength today, ICICI Bank looked in top-class form but none of the other major banks supported it. BankNifty as an index is still not bullish, on top of that NiftyIT was in the RED today. That is something that we don't witness every day, N50 hitting new highs without the support from BankNifty and NiftyIT.
On the 63 mts time frame, Nifty looks strong and pumped up. We continue to hold on to our bullish stance, if BN or IT index joins N50 - the build-up in momentum will be a treat to watch. Having said that we are not quite sure if we have enough firepower to take out 22500 in this weekly series.
63mts chart

BANKNIFTY VIEW : WEEK AHEAD The chart indicates a buy signal for the near term.
given that the market saw a significant consolidation rejection at the lower end
support ! @ 45600-45800
next zone: 47350–47600 aREA
Banks that may support = hdfc bank, icici bank ,
neutral: axis bank
weak: kotak bank

23 Jan ’24 — Almost 1700pts fall + Support break - Bear Attack?BankNifty Analysis - Stance Bearish ⬇️
Banknifty fell an unbelievable 1696pts ~ 3.64% from the HOD to the LOD. As usual, the gap-up of 472pts would have painted the wrong picture today especially when the Traders came ready to play ICICI on the long side. Never in the day, we got a bullish signal today - it was a one way journey from that gap-up to the low of the day.
4mts chart
The candle right at the support level of 45399 was the strongest - 215pts fall. This shows the strength the big-boys exerted today to create momentum. Were FIIs pissed off that we made them work on a Saturday?
Both Nifty and BankNifty have the same stance (bearish) similar to the one we had on 17th Jan. When Both the indices are in the same direction, it should be a treat to watch.
63mts chart
The next support comes at 44542 followed by 44068. The odd thing is that Global markets are so positive except China and Hong-Kong. And we do not have any bad local macro news except for the Sony-Zee saga and Govt. decision to increase the import duty on Gold & Silver. We strongly feel these positions are for the Budget 2024, If you have a better valid point - do mention it in the comments below. Also, we do not have an expiry tomorrow as both BN and N50 will have the monthly expiry on 25th. Strangely in Jan month, BankNifty’s last working day is the 31st on which it has a weekly expiry, but its monthly expiry is on 25th because Nifty’s on 25th. Some things you see only in India.

20 Jan ’24 — Will Quarterly results help the BankNifty bulls?BankNifty Analysis - Stance Bearish ⬇️
For some or the other reason, the 4mts & 63mts charts are not visible on TradingView. It may be due to this unscheduled working day and they might be facing issues with data feeds from vendors. We had a bearish view yesterday also and despite BN ending the day today with 357pts ~ 0.78% we are still maintaining the bearish stance.
16mts chart
A shallow support and resistance zone has formed between 45609 and 46025. The first critical support is unchanged at 45399 and the critical resistance at 47465. BankNifty was single-handedly responsible for limiting the losses on Nifty today - so we need to give due credit for that. But take a look at the chart - The fall from 48000+ levels did not just come because HDFCBK had poor results, it may be unwinding by FIIs considering the fiscal policy changes or reforms expectations for Budget 2024. So even if we have super duper results like the KOTAKs and ICICIs - we may not scale up that quickly. Honestly, we prefer if BN could reclaim the ATHs and support Nifty to crawl back into the channel. The US market hit a new ATH yesterday - SPX and the mood is euphoric.

18th Dec ’23 - BankNifty stance changed from bullish to neutral BankNifty Analysis
We got some interesting moves today by BankNifty. During pre-open ICICI bank was looking very weak but other banks were looking okay. But once markets opened - BN fell to 47810 by 09.19. The 2 horizontal blue lines I have drawn are the weak support and resistance lines from the last 2 days of action. BN went above the 47873 and was trading above that for most of the time.
4mts chart link - click here
We got one hit at 13.11 and the 2nd one by 14.43. After the 2nd hit, BN briefly fell below the support level and the final closing was at 47862. The LOD was broken 15.23 - so it is like we closed into weakness. The distance to my target of 47754 remained at just 52pts. And that is the main reason why I prefer to change my stance from long to neutral for tomorrow.
63 mts chart link - click here
If BN builds back momentum by tomorrow afternoon (FinNifty’s expiry could help), then it has to take out the ATH - only then I would prefer to switch back to bullish mode. To go bearish, the first step BN has to do is take out the top boundary of the ascending channel pretty quickly.

ICICI BANK ( Looking to invest 💥)Add this to watchlist and wait for entry.👁️🗨️
For short term investment ;
Leave a " Like If you agree ".👍
.
Wait for small retracement & daily candle to close above - "972" .
Trade carefully untill ENTRY level.
.
Entry: 972
target: 975 - 985
sl: 965 -960
major stoploss/ support: 960
.
.
Enter only if market Breaks
"Yellow box" mentioned.
.
.
Don't make complicated trade set-up.📈📉
Keep it " simple, focus on consistency "💹
Refer our old ideas for accuracy rate🧑💻
Follow for daily updates👍
.
Refer over old posted idea attached below.

23rd Oct ’23 - BankNifty is well below the 28th June levelsBankNifty Analysis
BankNifty on the other hand had a gap up open, thanks to the excellent results from ICICI Bank. To a great extent, BankNifty resisted the down move on Nifty. Even till 13.55, it was only 0.17% below the previous close.
But right after that, it fell like a house of cards. Whatever support ICICI gave till then was undone. ICICI ended up closing negative 0.3%, remember that it stayed green till 14.55. An intraday swing of 2.06%.
BankNifty also broke 2 supports today, 43404 and 43253, both of them after 14.55. These supports offered no protection today, the momentum to cruise through was that strong. Fortunately, the 43012 support (3rd support) was held today.
On the daily time frame, BankNifty has already undone the 28th June adventure. We are now trading at levels seen in the first week of May. The next major support after 43012 comes at 42576 and then at 42130. Going by the depth of the red candle today - it is quite likely that we retest those levels quickly.
