Breakout and Retest | 1000 + Soon Breakout reistance level of 950 which is now retest level of of this stock .Retest is now going good and stock is ready for four digit move and more after the new high .
ICICIBANK

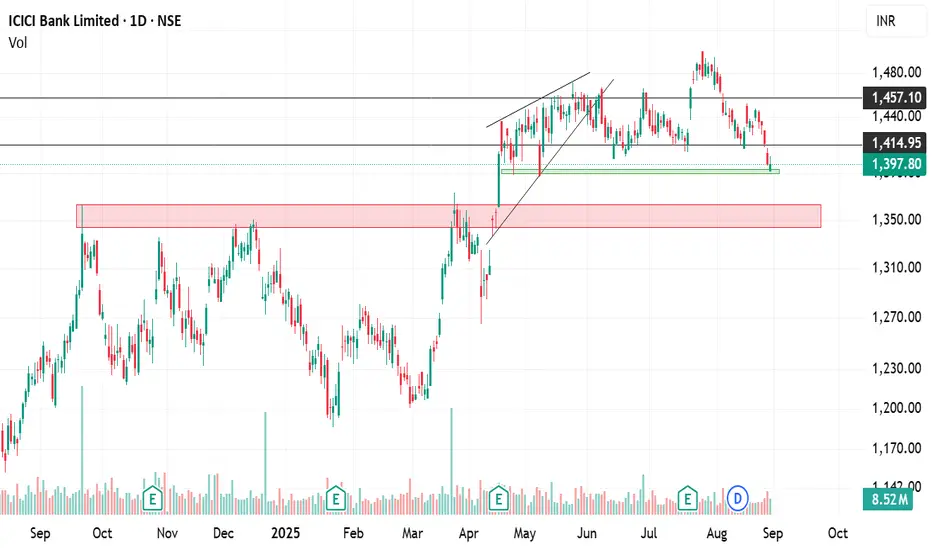
ICICIBANK - Inverted Head & Shoulder suggests 1450ICICI Bank has completed a clean Inverted Head and Shoulders pattern on the 4H chart, signalling a possible trend reversal after the recent downtrend. The left shoulder formed near 1360 , the head at 1317 , and the right shoulder at 1354 . All three points reflect stronger structure and consistent buying interest on dips. The stock has now crossed the neckline around 1387–1390 , a zone where it faced repeated rejection earlier. This breakout shows that buyers have finally taken control.
If the price continues to hold above the neckline, momentum is likely to push it toward the projected target of 1440–1450 , which matches the “final destination” zone shown on your chart. The breakout would lose strength only if the price falls back below 1387 , but unless that happens, the pattern suggests the move still has room to extend higher.

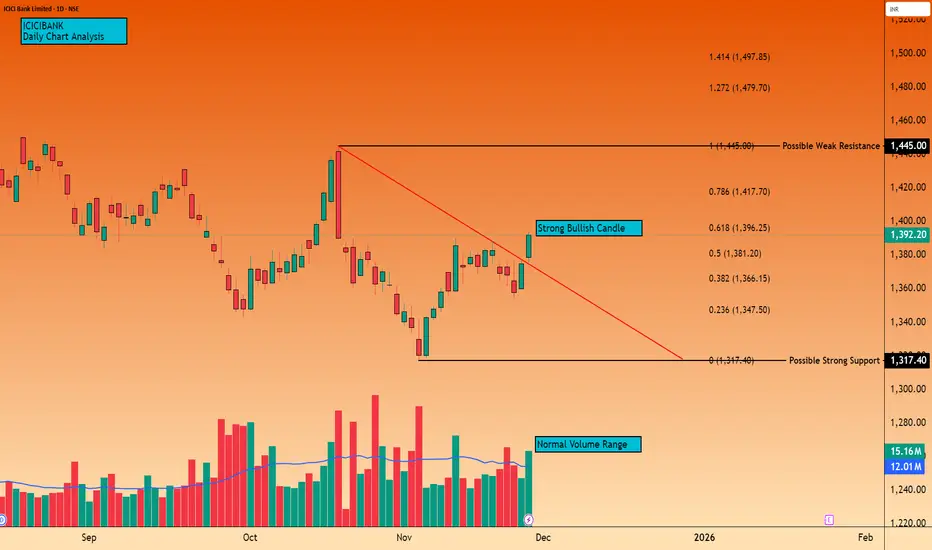
ICICIBANK - Fibonacci Reversal + Trendline Breakout Attempt💹 ICICI Bank Ltd (NSE: ICICIBANK)
Sector: Banking & Financial Services | CMP: 1392.20 | View: Fibonacci Reversal + Trendline Breakout Attempt
Chart Pattern: Descending Trendline Breakout
Candlestick Pattern: Strong Bullish Momentum Candle
Swing High: 1445
Swing Low: 1317.40
STWP Trade Analysis:
Bullish Breakout Level: 1394
Stop Loss: 1353
Momentum: Strong
Volume: High participation buildup
The price has bounced sharply from the 0.382–0.5 Fibonacci retracement pocket, breaking above the descending trendline with a strong bullish candle. Volume expansion confirms active buying interest, signalling institutional accumulation from lower levels. The shift from contraction (falling structure) to expansion (breakout candle) indicates buyers reclaiming dominance and defending higher lows consistently.
Resistances:
1398.9 | 1405.6 | 1417.2
Supports:
1380.6 | 1369 | 1362.3
STWP Stock Analysis:
Final Outlook:
Momentum: Strong | Trend: Bullish Bias Developing | Risk: Moderate | Volume: High
ICICI Bank has rebounded strongly from the Fibonacci retracement structure, reclaiming key levels and breaking above the trendline that previously controlled price action. This confirms the transition from corrective movement into a fresh upward attempt. Volume strength shows that this move is not a random spike but a coordinated push from stronger hands.
RSI has turned upward from the balanced zone, CCI is strengthening above the positive threshold, and MACD is close to a momentum confirmation crossover — all indicating internal strength building behind the price. EMA compression across the last several sessions is easing, suggesting the early stage of a directional move.
The series of controlled declines over the past month resemble VCP-like contractions, followed by today’s momentum expansion candle. Sustaining above the 1381–1366 zone keeps the bullish structure intact and opens the path toward the resistance band at 1398 → 1405 → 1417, with 1445 acting as the extended resistance if momentum continues.
Overall, ICICI Bank stands at the onset of a potential continuation leg, backed by strong volume, clean Fibonacci structure, and a clear breakout from its corrective trendline. Holding the demand zones below will strengthen follow-through possibilities and create additional opportunities for traders on dips.
Traders should watch how the stock behaves on minor dips or pullbacks toward the 1381–1366 demand band. Healthy retests within this zone often provide strong secondary entries in momentum setups.
This document is strictly for educational and informational purposes. This analysis is purely observational and does not qualify as investment research under SEBI regulations. All examples, charts, levels, and structures discussed are illustrative and are not intended as buy, sell, or hold recommendations. STWP does not provide investment advice, trading tips, signals, or personalized financial guidance of any kind, nor is it a SEBI-registered intermediary or research analyst. The analyses and risk–reward structures included here are generic in nature and based on publicly available information, which may change without notice. Financial markets involve significant risk; derivatives in particular carry the potential for substantial losses. Readers are solely responsible for their trading decisions, capital management, and risk assessment.
Always consult a SEBI-registered investment advisor before making any financial decisions. STWP and its team shall not be liable for any direct or indirect losses arising from the use of this material. Historical patterns never guarantee future outcomes.
Position Status: No active position in ICICIBANK at the time of analysis.
Data Source: TradingView & NSE India.
💬 Found this useful?
🔼 Boost this post to support structured learning
✍️ Share your thoughts or questions in the comments
🔁 Forward this to traders who value clean technical studies
👉 Follow for disciplined, structured, STWP-style analysis
🚀 Stay Calm. Stay Clean. Trade With Patience.
Trade Smart | Learn Zones | Be Self-Reliant 📊
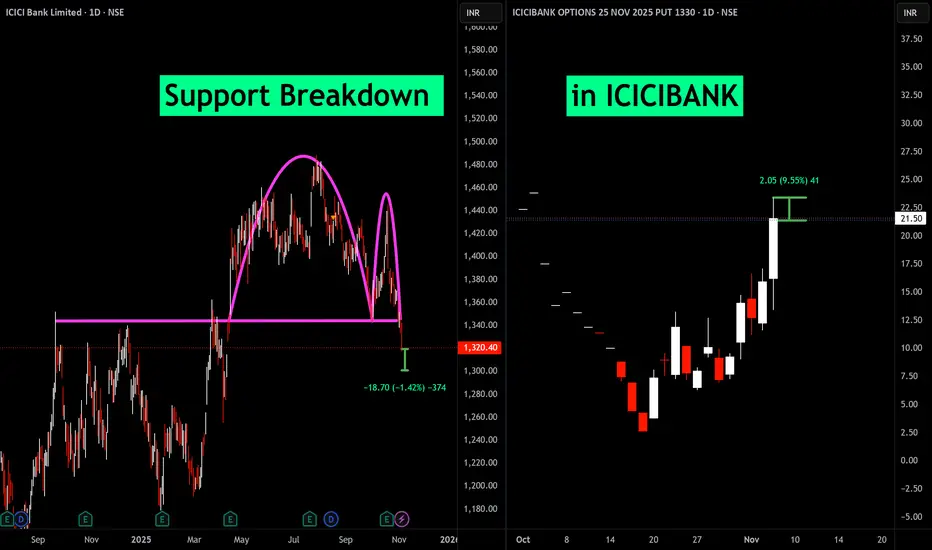
Support Breakdown in ICICIBANKThe breakdown of a key support level typically signals that sellers have gained control over the stock, which often leads to further declines.
The chart shows ICICI Bank's daily price slipping below strong support, which traders watch carefully to time short or protective put option trades.
Buying puts here benefits from the falling stock price causing put premiums to rise.
The suggested profit targets and stop-loss levels are based on technical price levels derived from the previous support turned resistance and the magnitude of the breakdown move.
This trade idea is best suited for traders comfortable with short-term bearish plays using direct short selling or options strategies that capitalize on falling prices.
STWP Analysis | ICICI Bank Showing Classic Breakout Behavior________________________________________
💼 ICICI BANK (NSE: ICICIBANK) | CMP ₹1436.60 (+1.36%)
Sector: Banking & Financial Services | Date: 19 Oct 2025
________________________________________
📊 Chart Summary
ICICI Bank closed strong at ₹1436.60, gaining +1.36% from its previous close of ₹1417.30.
Price made a high of ₹1439.60 — exactly around the Fibonacci resistance zone of ₹1439.85.
Volumes surged to 1.76x the average, with 1.70 crore shares traded against an average of 1.35 crore — indicating strong participation and renewed interest.
________________________________________
🟡 Technical Indicators Summary (Yellow Label Insight)
The chart highlights Bullish Momentum supported by a Strong Bullish Candle, indicating renewed buying interest.
A clear RSI breakout (68.36) confirms strengthening momentum, while the Bollinger Band breakout signals expanding volatility — often a precursor to a sharp directional move.
MACD at 8.33, CCI at 203.06, and Stochastic at 96.91 collectively point to short-term strength, while VWAP at 1427.77 serves as immediate support.
This confluence of volume + structure + volatility aligns perfectly for a potential breakout continuation.
________________________________________
📈 Price Action & Key Levels
The stock has been moving within a base range of ₹1342.6 – ₹1500, and has now approached the upper resistance band.
Immediate Resistance: 1447 / 1458 / 1476
Immediate Support: 1418 / 1400 / 1390
VWAP: 1427.77
A sustained close above 1439.60–1440 can confirm a bullish breakout, with upside potential toward 1466.30 → 1500 zone.
________________________________________
🧭 STWP Trade Analysis
Bias: Bullish
Breakout Level: Above 1439.60
Intraday Support: 1428
Swing Support: 1384
Intermediate Support: 1342
Momentum: Moderate
Trend: Bullish
Risk: Low
Volume: High
📌 Observation: The candle structure suggests a “volume-backed breakout” that may see short-term profit-booking near 1447 but remains structurally bullish if above VWAP.
________________________________________
🧾 Quick View: Q2 FY26 Results Snapshot
ICICI Bank reported a 5% YoY rise in PAT to ₹12,359 crore, supported by a 7.4% rise in Net Interest Income (₹21,529 crore) and improved asset quality.
Lower provisions and healthy loan growth kept the bottom line stable, while core operating profit rose 6.5% YoY.
With a clean balance sheet and improving credit metrics, the results complement the ongoing bullish technical setup — reinforcing confidence in trend continuation.
________________________________________
🧩 Final Outlook
ICICI Bank exhibits bullish momentum with low-risk positioning.
The current move represents a technical + fundamental confluence breakout, supported by strong volumes and improving financial health.
Traders may watch for price action near 1439–1447 zone for confirmation and potential swing continuation toward ₹1500 in the coming sessions.
________________________________________
🧠 Learning Note (Educational Purpose)
This setup perfectly demonstrates how volume expansion + momentum oscillator alignment + earnings strength often precedes meaningful breakouts in large-cap banking stocks.
Always track VWAP & RSI stability post-breakout — they often determine whether the move sustains or fades.
________________________________________
⚠️ Disclosure & Disclaimer (SEBI-Compliant)
This content is created solely for educational and informational purposes to help readers understand technical analysis and market structure.
It does not constitute investment advice, research recommendation, or a solicitation to buy or sell any security.
The author is not a SEBI-registered investment adviser or research analyst.
All charts, patterns, and levels are based on personal study and historical data available from public sources such as TradingView and NSE India.
Position Status: No active position in ICICIBANK at the time of publication.
Trading and investing involve risk. Market movements can be unpredictable, and losses may exceed invested capital.
Readers are strongly advised to consult a SEBI-registered investment adviser before making any trading or investment decisions.
By engaging with this post, you acknowledge that you take full responsibility for your own trades, decisions, and outcomes.
________________________________________
💬 Found this useful?
🔼 Boost this post to support structured learning content.
✍️ Share your thoughts, questions, or observations — let’s grow together!
🔁 Share with learners and traders to promote responsible market education.
👉 “If you liked this breakdown, follow for more disciplined, educational trade setups.”
🚀 Stay Calm. Stay Clean. Trade With Patience.
Trade Smart | Learn Zones | Be Self-Reliant 📊

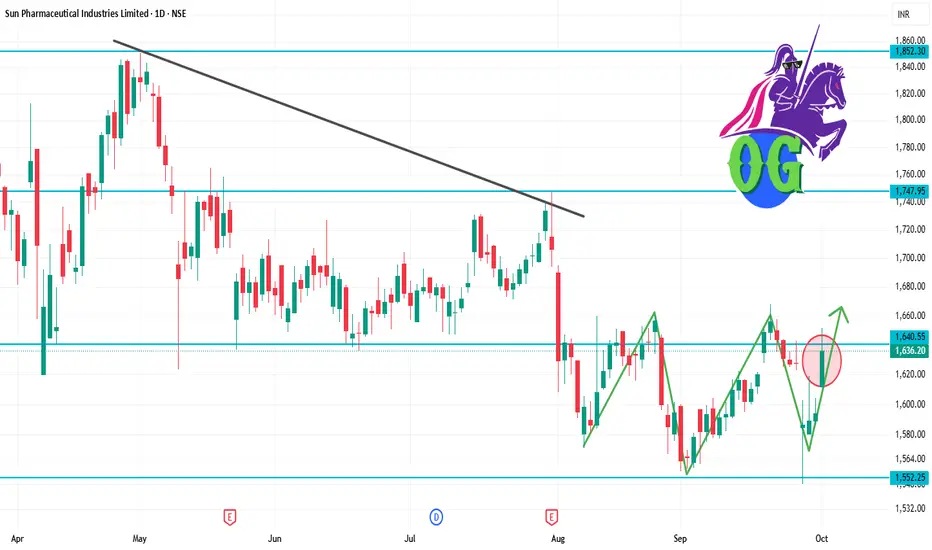
SUNPHARMA 1D Time frameCurrent Snapshot
Current Price: ₹1,636.20
52-Week High: ₹1,952.25
52-Week Low: ₹1,548.00
Strategy & Outlook
Bullish Bias: The stock is in a short-term uptrend with positive momentum indicators.
Buying Opportunity: Consider entering near support zones (₹1,600–₹1,610) with a target towards ₹1,650–₹1,670.
Risk Management: Place stop-loss orders below the support levels to manage potential downside risks.
BRITANNIA 1D Time frameCurrent Price: ~₹5,953.50
Day’s Range: ₹5,939.50 – ₹6,036.00
52-Week Range: ₹4,506.00 – ₹6,469.90
📏 Key Levels
Immediate Resistance: ~₹6,300
Next Resistance: ~₹6,470 (52-week high)
Immediate Support: ~₹5,800
Next Supports: ~₹5,600 and ₹5,300
🧠 Insights
If Britannia breaks above ₹6,300 with volume, it may push toward ₹6,470+ (new highs).
If it fails to break resistance, expect sideways movement or a pullback toward ₹5,800.
A break below ₹5,800 would signal weakness and can drag it down toward ₹5,600–₹5,300 levels.

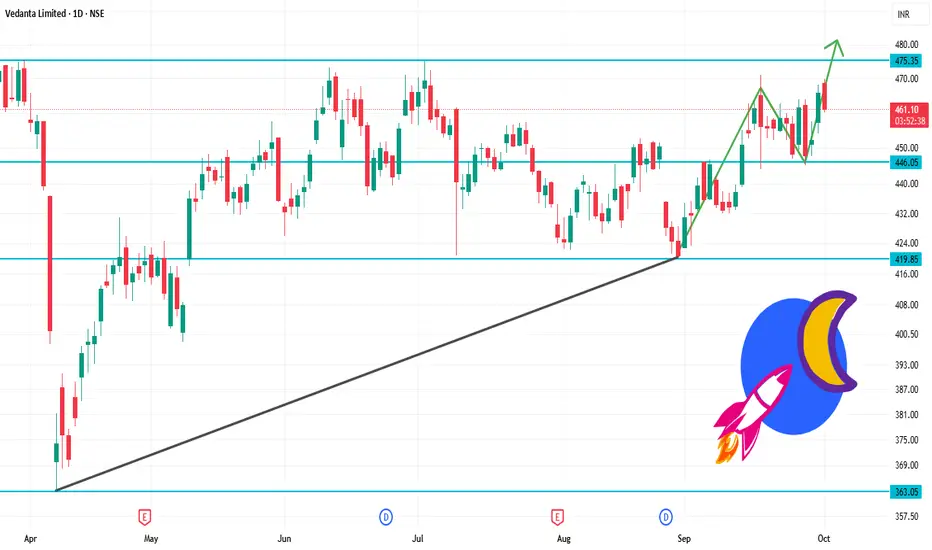
VEDL 1D Time frameOpening Price: ₹468.55
Closing Price: ₹461.40
Day Range: ₹463.00 – ₹469.85
Volume: 2,730,213 shares traded
📉 Trend Analysis
Short-Term Trend: Bearish – The stock is trading below key moving averages, confirming the bearish trend.
Medium-Term Trend: Neutral – The stock is in a consolidation phase, characterized by lower highs and lower lows.
Long-Term Trend: Neutral – No significant trend identified; the stock is trading within a range.
🔮 Conclusion
Vedanta Ltd. is in a bearish trend with weak momentum.
Break below ₹460.00 could lead to further decline toward ₹455.00.
Break above ₹475.00 would indicate a potential trend reversal.
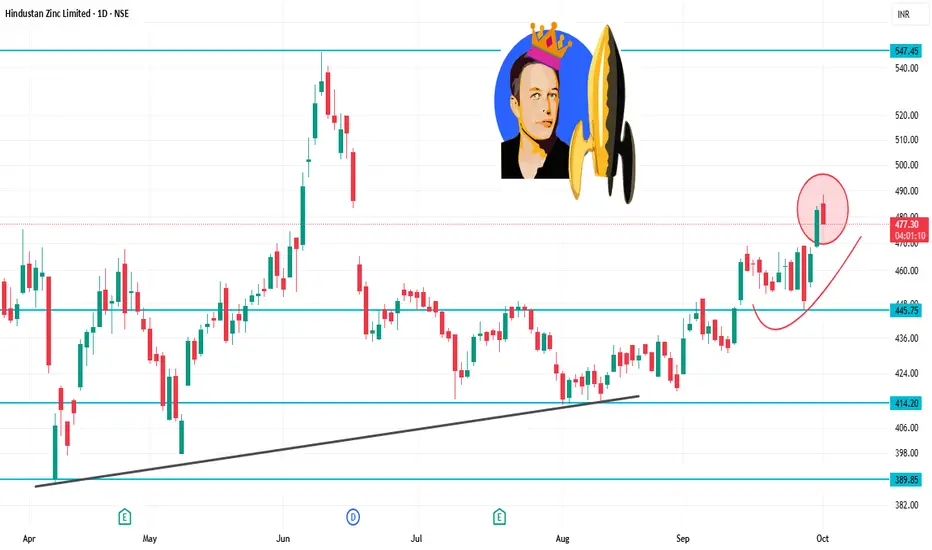
HINDZINC 1D Time frameDay Range: ₹478.35 – ₹488.40
52-Week Range: ₹378.15 – ₹575.40
Volume: 284,459 shares traded
📉 Trend Analysis
The stock is in a downtrend, characterized by:
Lower highs and lower lows.
Failure to break above resistance levels.
The short-term trend remains bearish.
🔮 Conclusion
Hindustan Zinc is in a downtrend with weak momentum.
Break below ₹470.00 could lead to further decline toward ₹460.00.
Break above ₹495.00 would indicate a potential trend reversal.
KOTAKBANK 1D Time frameCurrent Price Snapshot
Current Price: ₹1,991.60
Day’s Range: ₹1,990.50 – ₹2,015.00
52-Week Range: ₹1,679.05 – ₹2,301.90
Technical Indicators
RSI (14-day): 46.61 — indicates a neutral momentum.
MACD: -7.62 — suggests bearish momentum.
Moving Averages: Mixed signals — short-term averages are bearish, while long-term averages are bullish.
Technical Summary: Predominantly Sell signals across various indicators.
Summary
Above ₹2,015: Potential rise toward ₹2,050 – ₹2,100.
Below ₹1,990: Potential fall toward ₹1,950 – ₹1,900.
Between ₹1,950 – ₹2,010: Likely range-bound movement.

BAJFINANCE 1D Time frameCurrent Price Snapshot
Current Price: ₹999.00
Day’s Range: ₹989.45 – ₹1,002.30
52-Week Range: ₹645.10 – ₹1,036.00
Technical Indicators
RSI (14-day): 59.37 — indicates a neutral to slightly bullish momentum.
MACD: -4.010 — suggests bearish momentum.
Moving Averages: Mixed signals — short-term averages are bearish, while long-term averages are bullish.
Technical Summary: Predominantly Buy signals across various indicators.
Summary
Above ₹1,002.30: Potential rise toward ₹1,020 – ₹1,030.
Below ₹989.45: Potential fall toward ₹980 – ₹970.
Between ₹980 – ₹1,010: Likely range-bound movement.
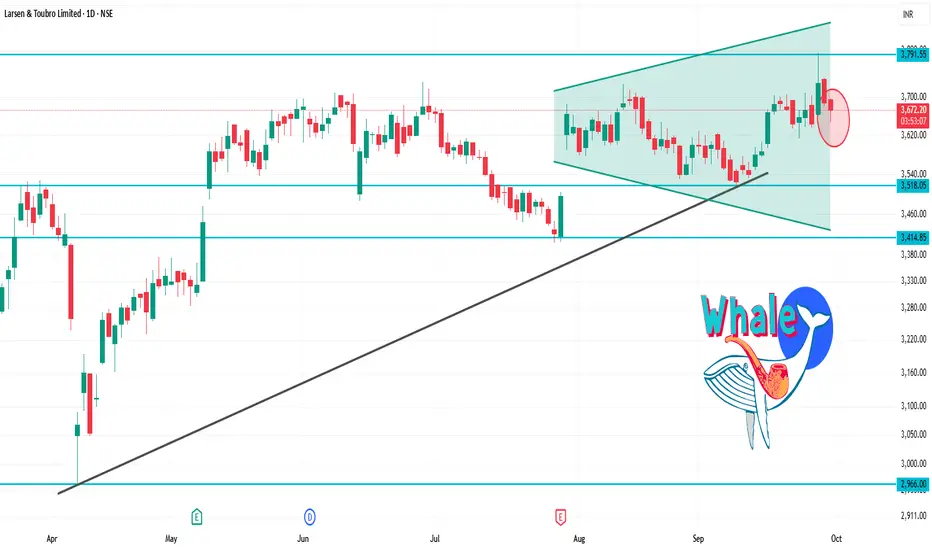
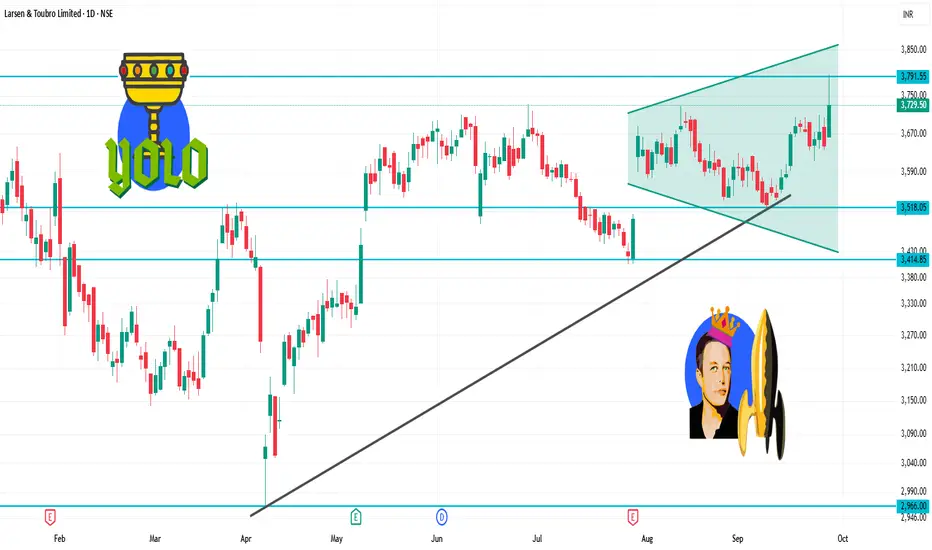
LT 1D Time frameCurrent Price: ₹3,655.30
Day’s Range: ₹3,648.00 – ₹3,696.60
52-Week Range: ₹2,965.30 – ₹3,963.50
Technical Indicators
RSI (14-day): 41.19 — indicates a neutral to slightly bearish momentum.
MACD: -1.47 — suggests bearish momentum.
Moving Averages: Mixed signals — short-term averages are bearish, while long-term averages are bullish.
Technical Summary: Predominantly Sell signals across various indicators.
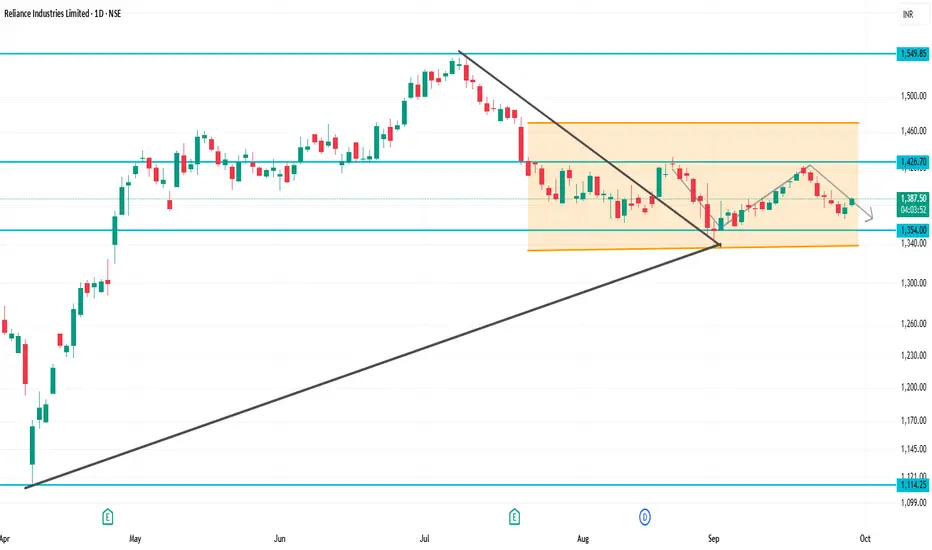
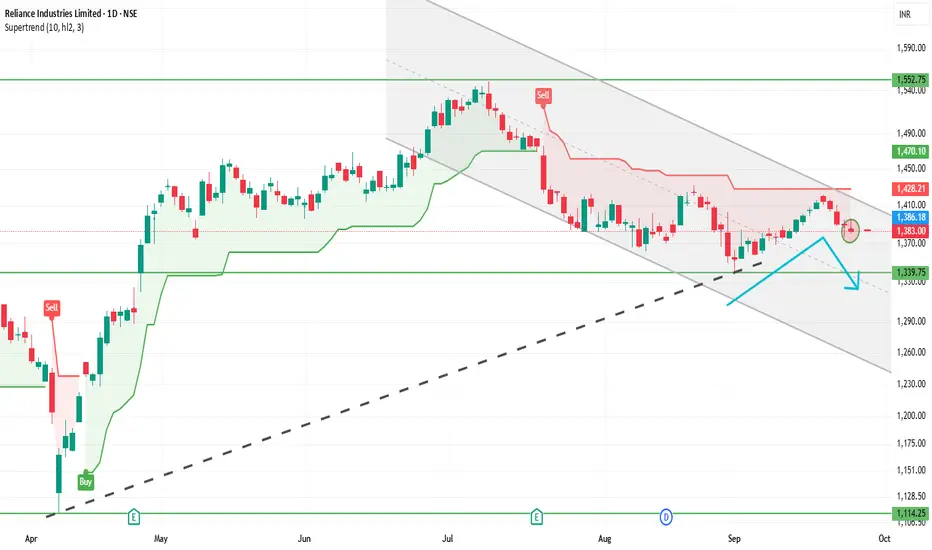
RELIANCE 1D Time frameCurrent Market Snapshot
Current Price: ₹1,383.30
Opening Price: ₹1,381.60
Day’s Range: ₹1,379.00 – ₹1,386.90
Previous Close: ₹1,377.60
🔑 Technical Indicators
Relative Strength Index (RSI): 49.76 – indicating a neutral condition.
Moving Average Convergence Divergence (MACD): -3.20 – suggesting bearish momentum.
Moving Averages: Mixed signals; trading slightly below the 50-day and 200-day moving averages, indicating a neutral to bearish trend.
📈 Key Support & Resistance Levels
Immediate Support: ₹1,379
Immediate Resistance: ₹1,387
Pivot Point: ₹1,383
📉 Market Sentiment
Recent Performance: Reliance Industries experienced a decline of 0.82% on September 25, 2025, underperforming the broader market.
Volume: Trading volume is higher than average, suggesting increased investor activity.
📈 Strategy (1D Timeframe)
1. Bullish Scenario
Entry: Above ₹1,387
Stop-Loss: ₹1,379
Target: ₹1,395 → ₹1,400
2. Bearish Scenario
Entry: Below ₹1,379
Stop-Loss: ₹1,387
Target: ₹1,370 → ₹1,365
⚠️ Risk Management
Limit risk to 1% of capital per trade.
Always use stop-loss to protect against unexpected market movements.
Monitor broader market trends and sector-specific news that may impact stock performance.
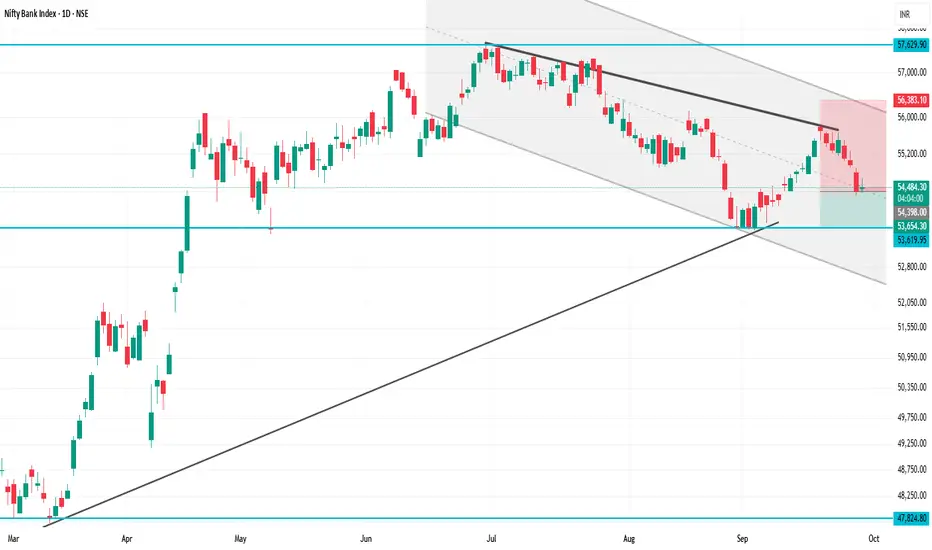
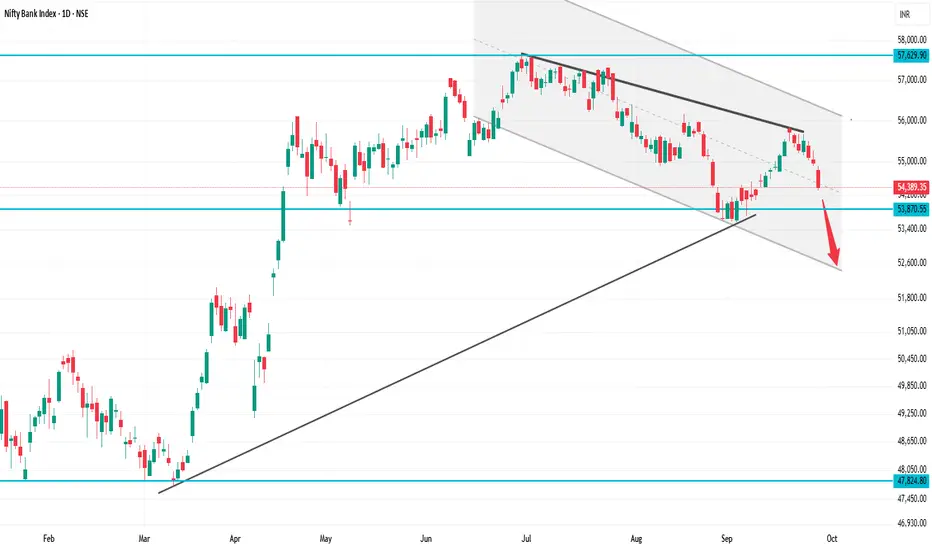
BANKNIFTY 1D Time frameCurrent Level: ₹54,651
Opening Level: ₹54,460
Day’s Range: ₹54,366 – ₹54,686
🔑 Key Support & Resistance
Immediate Support: ₹54,500
Immediate Resistance: ₹54,800
Pivot Point: ₹54,651
📈 Strategy (1D Timeframe)
1. Bullish Scenario
Entry: Above ₹54,800
Stop-Loss: ₹54,500
Target: ₹55,100 → ₹55,300
2. Bearish Scenario
Entry: Below ₹54,500
Stop-Loss: ₹54,800
Target: ₹54,300 → ₹54,100
⚠️ Risk Management
Limit risk to 1% of capital per trade.
Always use stop-loss to protect against unexpected market moves.
Watch sector news and broader market trends that can impact BANKNIFTY.
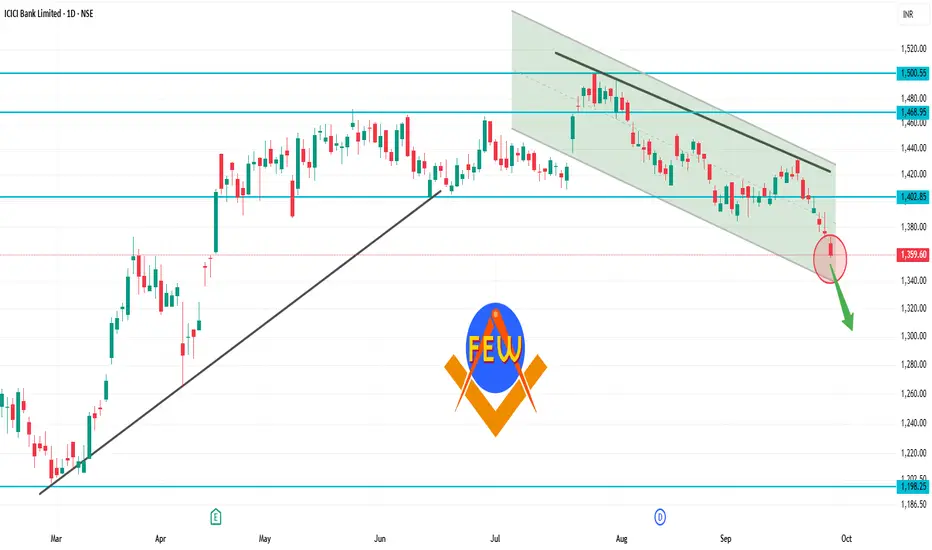
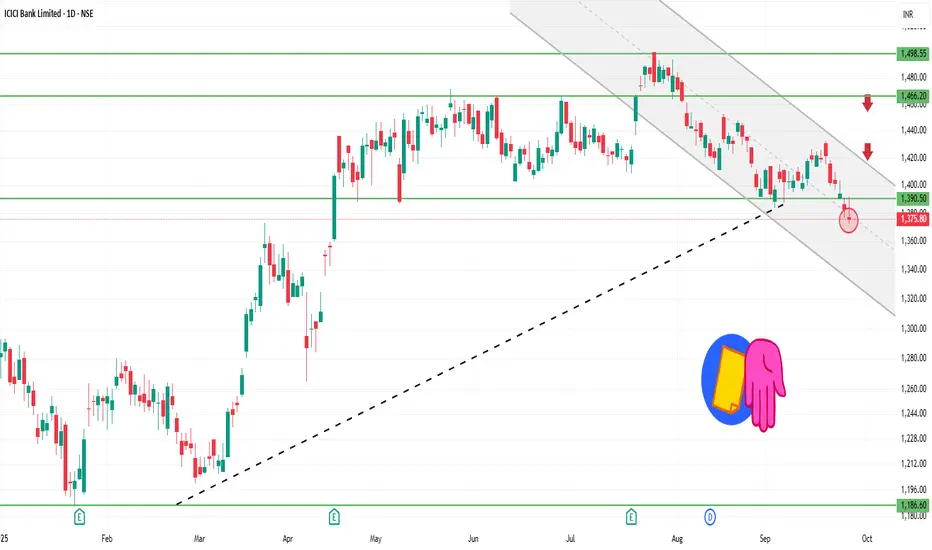
ICICI Bank Under Pressure: Breakdown Could Open ₹1,360–1,340ICICI Bank has been exhibiting persistent weakness over the past few sessions, underperforming relative to the broader market and showing clear signs of profit-booking. Despite being one of the stronger banking names in the past, the stock has recently struggled to sustain upward momentum, reflecting near-term bearish undertones.
Currently, ICICI Bank is trading around a crucial support band of ₹1,400–1,390. This zone has historically acted as a strong base, where buying interest has emerged in the past. However, repeated testing of this support without a meaningful bounce raises concerns about its sustainability.
A decisive breakdown below ₹1,390 could accelerate weakness and potentially drag the stock towards ₹1,360 and ₹1,340 levels, which are the next major support zones. These levels are important markers that could determine the medium-term trend.
On the upside, for sentiment to improve, the stock must sustain above ₹1,400–1,420 with strong volumes. Until then, caution is advised, as the undertone remains weak, and any breakdown may invite further selling pressure.
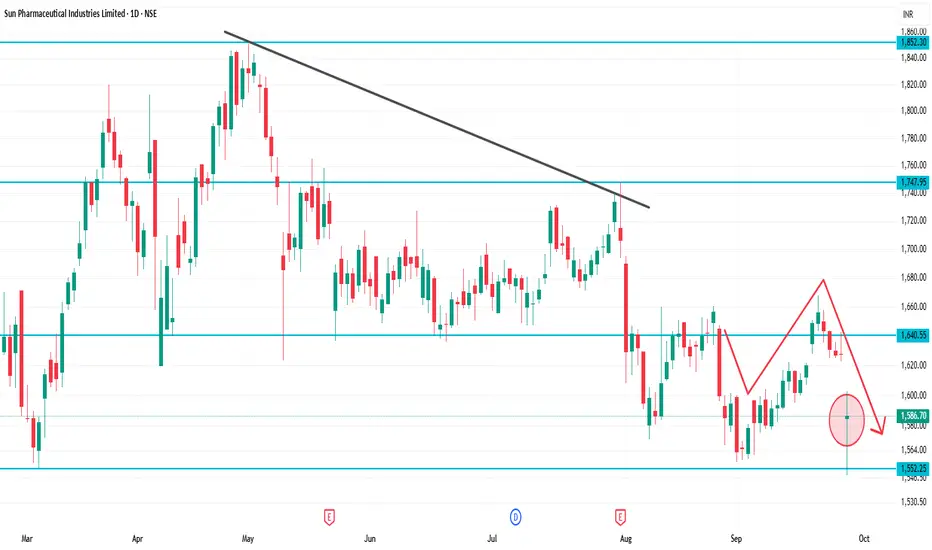
SUNPHARMA 1D Time frameCurrent Price: ~₹1,586
Day Range: ~₹1,582 – ₹1,600
52-Week High: ~₹1,960
52-Week Low: ~₹1,553
📈 Technical Outlook
Immediate Support: ₹1,580 (very close to current price)
Strong Support: ₹1,553 – ₹1,560 (52-week low zone)
Immediate Resistance: ₹1,600 – ₹1,620
Major Resistance: ₹1,650 – ₹1,670
Trend Bias:
Stock is weak, testing lower supports.
If it breaks below ₹1,580, then ₹1,553 may be tested.
A bounce is only possible if it sustains above ₹1,600.
📌 Step-by-Step Market View
Above 1,600: Chance for small recovery toward ₹1,620 – ₹1,650.
Stays between 1,580 – 1,600: Consolidation zone.
Breaks below 1,580: Weakness may extend to ₹1,553.
ICICIBANK 1D Time frameClosing Price: ₹1,363.00
Day's Range: ₹1,357.00 – ₹1,372.70
Previous Close: ₹1,375.80
Volume: 18,342,280 shares traded
Market Cap: ₹971,186 crore
52-Week High: ₹1,500.00
52-Week Low: ₹1,186.00
Face Value: ₹2.00
Beta: 0.90
🧾 Financial Highlights
P/E Ratio (TTM): 18.36
P/B Ratio: 3.12
EPS (TTM): ₹74.04
Dividend Yield: 0.81%
ROE: 17.05%
Book Value: ₹436.56
📈 Technical Insights
Trend: The stock is approaching its 200-day moving average, a key technical indicator. A bounce from this level could signal a buying opportunity, while a breakdown may suggest further downside risk.
Support Levels: ₹1,357.00, ₹1,350.00
Resistance Levels: ₹1,375.00, ₹1,400.00
📌 Key Takeaways
Recent Performance: ICICI Bank's stock declined by 0.91%, underperforming the broader market.
Analyst Sentiment: Despite recent volatility, ICICI Bank remains a top pick among analysts for long-term investment.
BANKNIFTY 1D Time frame
Previous Close: 55,121
Today Open: 55,061
Day’s High: 55,276
Day’s Low / Last: 54,389
⚡ Strategy
For Intraday / Short-Term Traders:
If BankNIFTY holds above 54,400 – 54,500, a small bounce toward 54,800 – 55,000 is possible.
If it fails to hold 54,400, expect more downside toward 54,000 – 53,800.
Bullish View (Only if recovery): Buy above 54,800 for targets 55,100 – 55,250, SL below 54,500.
Bearish View (Preferred): Sell on rise near 54,700 – 54,900 with SL above 55,000, targets 54,300 → 54,000.
LT 1D Time framePrevious Close: ₹ 3,644
Today Open: ₹ 3,664
Day’s High: ₹ 3,795
Day’s Low: ₹ 3,661
Current / Last Traded Price: around ₹ 3,730
⚡ Strategy
Bullish Side:
Buy on dips near ₹ 3,700 – 3,720 with stop loss below ₹ 3,660. Target ₹ 3,760 → ₹ 3,795.
Bearish Side (Only if Weakness):
If price falls below ₹ 3,660, short opportunities may open toward ₹ 3,600.
ICICIBANK 1D Time frame📊 Daily Snapshot
Closing Price: ₹1,375.50
Day’s Range: ₹1,371.80 – ₹1,391.50
Previous Close: ₹1,382.70
Change: Down –0.52%
52-Week Range: ₹1,018.85 – ₹1,494.10
Market Cap: ₹9.7 lakh crore
P/E Ratio: 20.5
Dividend Yield: 1.2%
EPS (TTM): ₹67.00
Beta: 1.05 (moderate volatility)
🔑 Key Technical Levels
Support Zone: ₹1,370 – ₹1,375
Resistance Zone: ₹1,390 – ₹1,400
All-Time High: ₹1,494.10
📈 Technical Indicators
RSI (14-day): 34.1 – approaching oversold territory, suggesting potential for a rebound.
MACD: Negative, indicating bearish momentum.
Moving Averages: Trading below the 150-day moving average, indicating a bearish trend.
Candlestick Patterns: Recent formation of a Bearish Engulfing pattern, suggesting potential for further downside.
📉 Market Sentiment
Recent Performance: ICICI Bank has experienced a decline for the fifth consecutive session, underperforming the broader market.
Sector Performance: The NIFTY BANK index also closed lower, reflecting sector-wide weakness.
📈 Strategy (1D Timeframe)
1. Bullish Scenario
Entry: Above ₹1,390
Stop-Loss: ₹1,370
Target: ₹1,405 → ₹1,420
2. Bearish Scenario
Entry: Below ₹1,370
Stop-Loss: ₹1,390
Target: ₹1,355 → ₹1,340
RELIANCE 1D Time frame📊 Reliance Daily (1D) Snapshot
Close: Around ₹1,382
Range of the Day: High near ₹1,396, Low near ₹1,380
Trend: Slight weakness on daily chart (mild red candle)
Stock is consolidating between support and resistance zones.
🎯 Key Daily Levels
Support Zone: ₹1,350 – ₹1,365
Strong Support: ₹1,330
Resistance Zone: ₹1,405 – ₹1,425
Strong Resistance: ₹1,430
📝 Strategy on 1D Chart
Bearish View
If price goes near ₹1,405 – ₹1,425 and fails to sustain, you can short.
Entry: ₹1,410 approx
Stop-loss: ₹1,430
Target: ₹1,365 → ₹1,350
Bullish View
If Reliance holds above ₹1,350 and shows reversal, you can buy.
Entry: ₹1,360 – ₹1,365 zone
Stop-loss: ₹1,330
Target: ₹1,405 → ₹1,425
Breakout Trade
If it closes above ₹1,430 with strong candle, expect momentum upside.
Target: ₹1,460+
Breakdown Trade
If it closes below ₹1,330, selling pressure can push it to ₹1,300 or lower.
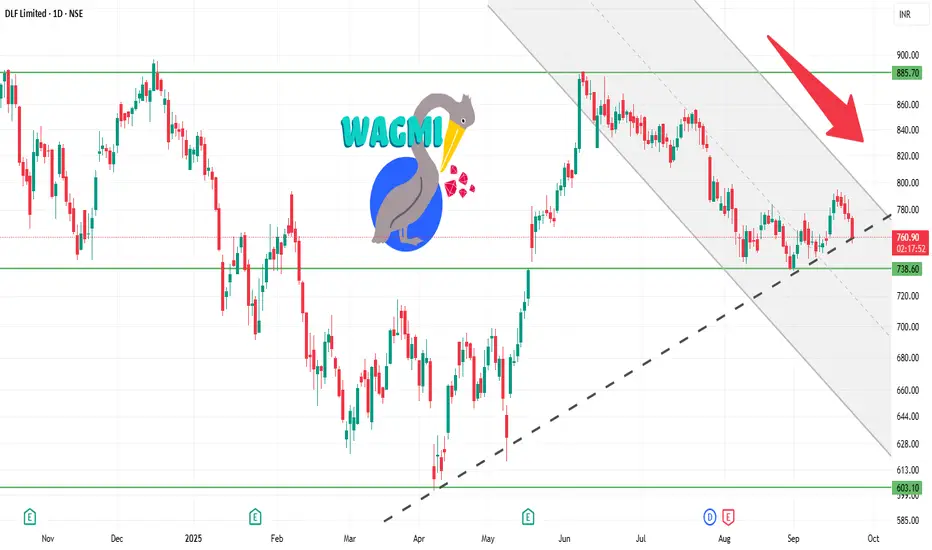
DLF 1D Time frame📍 Today’s Expected Range (Intraday Approximation)
Expected High: ₹767–₹775
Expected Low: ₹756–₹750
These are approximate intraday levels. Actual prices may fluctuate slightly due to market volatility.
🔍 Key Points
Current price: ₹760–₹761, trading near the middle of the day’s range.
If price breaks above ₹767–₹775 with strong volume → bullish momentum likely.
If price falls below ₹756–₹750 → short-term correction or pullback possible.
📊 Suggested Trading Strategy
Bullish Scenario
If DLF breaks ₹767–₹775, you can buy, targeting ₹780–₹785.
Stop-loss: ₹755
Bearish Scenario
If DLF drops below ₹756–₹750, you can sell/short, targeting ₹740–₹735.
Stop-loss: ₹760
Range-Bound / Sideways
If price trades between ₹756–₹767, it’s better to wait and avoid trading until a clear breakout occurs.
💡 Summary
Resistance Zone: ₹767–₹775
Support Zone: ₹750–₹756
Strategy: Trade in the direction of the breakout, and always use stop-loss to manage risk.
SBIN 1D Time frame📍 Today’s Expected Range (Intraday Approximation)
Expected High: ₹861–₹865
Expected Low: ₹855–₹850
These are approximate intraday levels. Actual prices may fluctuate slightly due to volatility.
🔍 Key Points
Current price: ₹860–₹861, close to resistance.
If price breaks above ₹861–₹865 with strong volume → bullish momentum likely.
If price drops below ₹855–₹850 → short-term correction or pullback possible.
📊 Suggested Trading Strategy
Bullish Scenario
If SBIN breaks ₹861–₹865, you can buy, targeting ₹870–₹875.
Stop-loss: ₹855
Bearish Scenario
If SBIN drops below ₹855, you can sell/short, targeting ₹850–₹845.
Stop-loss: ₹860
Range-Bound / Sideways
If SBIN trades between ₹855–₹861, it’s better to wait and avoid trading until a clear breakout occurs.
💡 Summary
Resistance Zone: ₹861–₹865
Support Zone: ₹855–₹850
Strategy: Trade in the direction of the breakout, and always use stop-loss to manage risk.
