Part 1 Ride The Big Moves Call and Put Options in Action
Call Option Example
Reliance is trading at ₹2500.
You buy a 1-month call option with strike price ₹2550, premium ₹50, lot size 505.
If Reliance rises to ₹2700 → Profit = (2700 - 2550 - 50) × 505 = ₹50,500.
If Reliance falls below 2550 → You lose only the premium (₹25,250).
Put Option Example
Nifty is at 20,000.
You buy a 1-month put option, strike 19,800, premium 100, lot size 50.
If Nifty falls to 19,200 → Profit = (19,800 - 19,200 - 100) × 50 = ₹25,000.
If Nifty rises above 19,800 → You lose premium (₹5,000).
Participants in Options Trading
Option Buyer – Pays premium, has limited risk and unlimited profit potential.
Option Seller (Writer) – Receives premium, has limited profit and potentially unlimited risk.
Example:
Buyer of call: Unlimited upside, limited loss (premium).
Seller of call: Limited profit (premium), unlimited loss if stock rises.
ICICIBANK

Part 2 Master Candlestick PatternKey Terms in Options Trading
Before diving into strategies, let’s master some core concepts:
Underlying Asset: The stock/index/commodity on which the option is based.
Strike Price: The price at which the option can be exercised.
Expiration Date: The date on which the option contract ends.
Premium: The price paid by the option buyer to the seller (writer) for the contract.
In-the-Money (ITM): Option has intrinsic value (profitable if exercised).
At-the-Money (ATM): Underlying price = Strike price.
Out-of-the-Money (OTM): Option has no intrinsic value yet (not profitable to exercise).
Lot Size: Options are traded in lots (e.g., Nifty option has a fixed lot of 50 units).
Leverage: Options allow control of large positions with smaller capital.
How Options Work
Options are like insurance. Imagine you own a house worth ₹50 lakh and buy insurance. You pay a small premium so that if the house burns down, you can recover your value. Similarly:
A call option is like paying for the right to buy a stock cheaper later.
A put option is like insurance against stock prices falling.

Part 1 Master Candlestick PatternIntroduction to Options Trading
Options trading is one of the most powerful tools in the financial markets. Unlike traditional stock trading, where you buy or sell shares directly, options allow you to control an asset without owning it outright. This gives traders flexibility, leverage, and a wide range of strategies for both profits and risk management.
At its core, an option is a contract that gives the buyer the right, but not the obligation, to buy or sell an underlying asset at a specific price (called the strike price) on or before a certain date (the expiration date).
The beauty of options lies in choice: you can profit whether markets are rising, falling, or even staying flat—if you know how to use them.
What is an Option?
An option is a derivative instrument, meaning its value is derived from the price of another asset (the “underlying”), such as:
Stocks (e.g., Reliance, Apple)
Indexes (e.g., Nifty, S&P 500)
Commodities (e.g., Gold, Oil)
Currencies
Two Main Types of Options:
Call Option – Gives the right to buy the underlying asset.
Put Option – Gives the right to sell the underlying asset.
Example:
A call option on Reliance with a strike price of ₹2500 expiring in one month gives you the right (not the obligation) to buy Reliance shares at ₹2500, regardless of the market price.
A put option with a strike of ₹2500 gives you the right to sell at ₹2500.

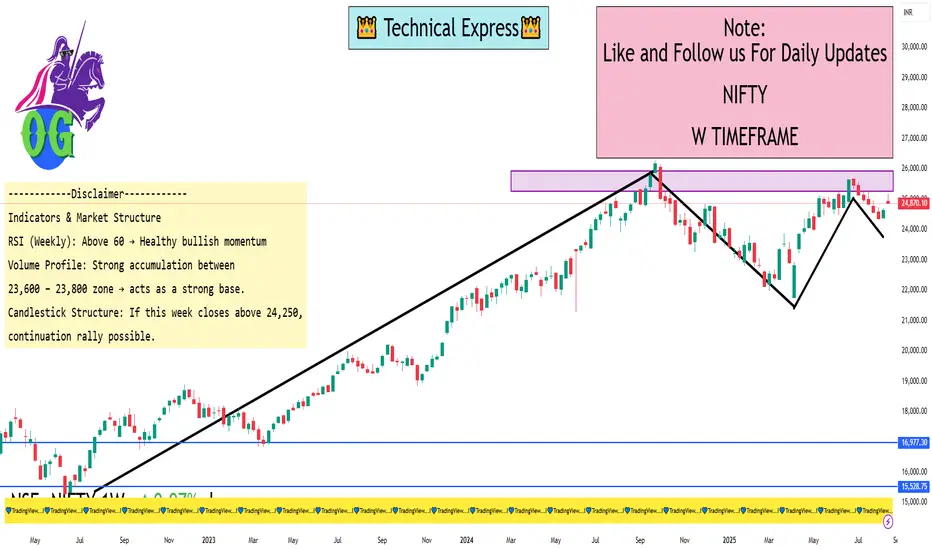
Nifty 1 Week ViewKey Levels (Weekly Time Frame)
Resistance Zones (Upside):
24,250 – 24,300 → Immediate supply zone / resistance
24,500 – 24,600 → Next major resistance (if breakout sustains)
24,850 – 25,000 → Psychological round level + possible profit booking
Support Zones (Downside):
23,950 – 24,000 → Immediate weekly support
23,700 – 23,750 → Strong demand zone (previous breakout level)
23,400 – 23,450 → Deeper support; trend reversal only if broken
Indicators & Market Structure
RSI (Weekly): Above 60 → Healthy bullish momentum, but slightly overbought.
Volume Profile: Strong accumulation between 23,600 – 23,800 zone → acts as a strong base.
Candlestick Structure: If this week closes above 24,250, continuation rally possible. If rejection happens, sideways to mild correction.
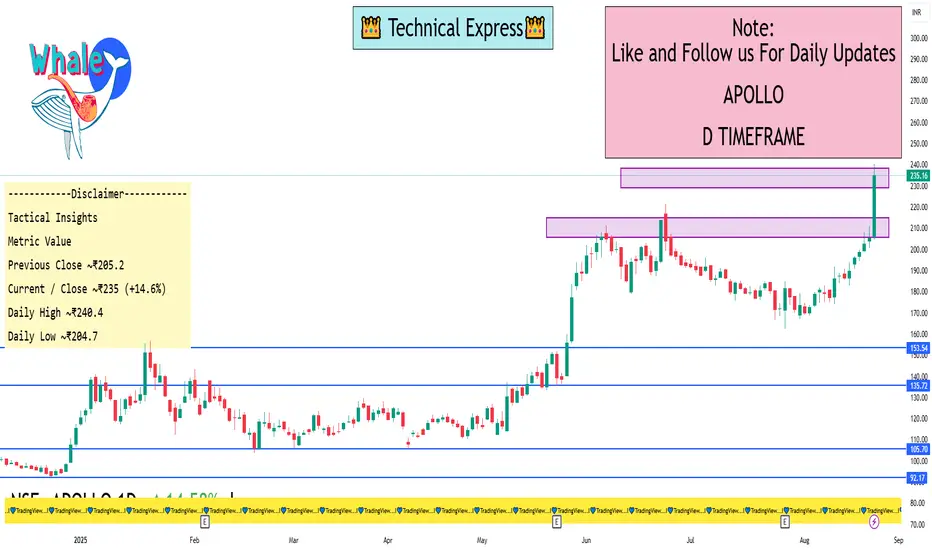
APOLLO 1 Day ViewRecent Catalysts
Apollo Micro Systems saw a significant price spike recently, following an announcement of securing defense contracts worth ₹25.12 crore from DRDO and other public sector undertakings. This triggered a ~15.4% jump in share price and contributed to the new high.
Based on the most recent data:
The current/closing price was around ₹235, up 14.6%, setting a 52-week high of ₹240.40 on August 22, 2025.
Daily high: approximately ₹240.4
Daily low: around ₹204.7
VWAP (Volume-Weighted Average Price): ₹231.79
Volume traded: reported as 88,960,249 shares
Summary Table
Metric Value
Previous Close ~₹205.2
Current / Close ~₹235 (+14.6%)
Daily High ~₹240.4
Daily Low ~₹204.7
VWAP ₹231.79
Volume ~88.96 million shares
Important Trigger Defense order win announcement
Indicators & Oscillators in Trading1. Introduction
In the world of financial markets, traders are constantly searching for ways to gain an edge. While fundamental analysis looks at company earnings, news, and economic trends, technical analysis focuses on price action, patterns, and market psychology.
At the core of technical analysis lie Indicators and Oscillators. These are mathematical calculations based on price, volume, or both, designed to give traders insights into the direction, momentum, strength, or volatility of a market.
In simple words, Indicators help you see the invisible — they take raw price data and transform it into something more structured, often plotted on a chart to highlight opportunities. Oscillators, on the other hand, are a special category of indicators that move within a fixed range (like 0 to 100), helping traders identify overbought and oversold conditions.
Understanding them is crucial because they:
Improve trade timing.
Help confirm signals.
Prevent emotional decision-making.
Allow traders to recognize trends earlier.
2. What Are Indicators?
Indicators are mathematical formulas applied to a stock, forex pair, commodity, or index to make market data easier to interpret.
For example, a simple indicator is the Moving Average. It takes the average of closing prices over a set number of days and smooths out fluctuations. This makes it easier to see the underlying trend.
Indicators can be broadly categorized into two groups:
Leading Indicators – Predict future price movements.
Example: Relative Strength Index (RSI), Stochastic Oscillator.
These give signals before the trend actually changes.
Lagging Indicators – Confirm existing price movements.
Example: Moving Averages, MACD.
They follow price action and confirm that a trend has started or ended.
3. What Are Oscillators?
Oscillators are a subcategory of indicators that fluctuate within a defined range. For example, the RSI ranges from 0 to 100, while the Stochastic Oscillator ranges from 0 to 100 as well.
Traders use oscillators to identify:
Overbought conditions (when prices may be too high and due for correction).
Oversold conditions (when prices may be too low and due for a bounce).
The key difference between indicators and oscillators is that while all oscillators are indicators, not all indicators are oscillators. Oscillators usually appear in a separate window below the price chart.
4. Types of Indicators
Indicators can be classified based on their purpose:
A. Trend Indicators
These show the direction of the market.
Moving Averages (SMA, EMA, WMA)
MACD (Moving Average Convergence Divergence)
ADX (Average Directional Index)
B. Momentum Indicators
These measure the speed of price movements.
RSI (Relative Strength Index)
Stochastic Oscillator
CCI (Commodity Channel Index)
C. Volatility Indicators
These show how much prices are fluctuating.
Bollinger Bands
ATR (Average True Range)
Keltner Channels
D. Volume Indicators
These use traded volume to confirm price moves.
OBV (On-Balance Volume)
VWAP (Volume Weighted Average Price)
Chaikin Money Flow
5. Popular Indicators Explained
Let’s break down some of the most commonly used indicators:
5.1 Moving Averages
Simple Moving Average (SMA): Average of closing prices over a period.
Exponential Moving Average (EMA): Gives more weight to recent data, reacts faster.
Use: Identify trend direction, support, and resistance.
Example: If the 50-day EMA crosses above the 200-day EMA (Golden Cross), it’s a bullish signal.
5.2 MACD (Moving Average Convergence Divergence)
Consists of two EMAs (usually 12-day and 26-day).
A signal line (9-day EMA of MACD) generates buy/sell signals.
Use: Trend-following, momentum strength.
Example: When MACD crosses above signal line → Buy signal.
5.3 RSI (Relative Strength Index)
Range: 0 to 100.
Above 70 = Overbought.
Below 30 = Oversold.
Use: Identify reversals, divergence signals.
Example: RSI above 80 in a strong uptrend may still rise, so context matters.
5.4 Stochastic Oscillator
Compares a closing price to a range of prices over a period.
Range: 0 to 100.
Signals:
Above 80 = Overbought.
Below 20 = Oversold.
Special feature: Generates crossovers between %K and %D lines.
5.5 Bollinger Bands
Consist of a moving average and two standard deviation bands.
Bands expand during volatility, contract during consolidation.
Use:
Price near upper band = Overbought.
Price near lower band = Oversold.
5.6 Average True Range (ATR)
Measures volatility, not direction.
Higher ATR = High volatility.
Lower ATR = Low volatility.
Use: Set stop-loss levels, position sizing.
5.7 OBV (On-Balance Volume)
Combines price movement with volume.
Rising OBV = buyers in control.
Falling OBV = sellers in control.
6. Combining Indicators
No single indicator is perfect. Traders often combine two or more indicators to filter false signals.
Example Strategies:
RSI + Moving Average: Identify oversold conditions only if price is above the moving average (trend filter).
MACD + Bollinger Bands: Use MACD crossover as entry, Bollinger Band touch as exit.
Volume + Trend Indicator: Confirm trend direction with volume support.
7. Advantages of Using Indicators & Oscillators
Clarity – Simplifies raw data into easy-to-read signals.
Discipline – Reduces emotional trading.
Confirmation – Supports price action with mathematical evidence.
Adaptability – Works across stocks, forex, commodities, crypto.
8. Limitations
Lagging nature: Most indicators follow price, not predict it.
False signals: Especially in sideways markets.
Over-reliance: Blind faith in indicators leads to losses.
Conflicting results: Different indicators may show opposite signals.
9. Best Practices for Traders
Keep it simple: Use 2–3 reliable indicators instead of clutter.
Understand context: RSI at 80 in a strong bull run may not mean “sell.”
Combine with price action: Indicators are tools, not replacements for reading charts.
Backtest strategies: Always test on historical data before applying in live trades.
Adapt timeframe: What works in daily charts may not work in 5-minute charts.
10. Real-World Example
Suppose a trader is analyzing Nifty 50 index:
50-day EMA is above 200-day EMA → Trend is bullish.
RSI is at 65 → Market is not yet overbought.
OBV is rising → Strong buying volume.
Bollinger Bands are expanding → High volatility.
Conclusion: Strong bullish momentum. Trader may enter long with stop-loss below 200-day EMA.
Conclusion
Indicators & Oscillators are like navigation tools for traders. They don’t guarantee profits but improve decision-making, discipline, and timing. The real skill lies in knowing when to trust them, when to ignore them, and how to combine them with price action and market context.
To master them:
Learn their math and logic.
Practice on historical charts.
Combine with market structure analysis.
Keep evolving as markets change.
A professional trader treats indicators not as magical prediction machines, but as assistants in understanding market psychology.
Common Mistakes New Traders Make1. Jumping into Trading Without Education
Many beginners dive into trading after watching a few YouTube videos, following tips from social media, or hearing success stories of others. But trading isn’t about luck — it’s about skill, discipline, and strategy.
Mistake: Believing trading is just buying low and selling high.
Reality: Trading requires understanding technical analysis, risk management, psychology, and market structure.
Example: A new trader hears about a stock that doubled in a week. They buy without research, but by the time they enter, the stock has already peaked. The price crashes, and they lose money.
Solution: Treat trading like a profession. Just as a doctor or engineer studies for years, a trader needs structured learning — books, courses, simulations, and practice before putting real money at risk.
2. Trading Without a Plan
Imagine playing a cricket match without a game plan — chaos is guaranteed. Similarly, trading without a clear plan leads to impulsive decisions.
Mistake: Buying and selling based on emotions or news without rules.
Reality: Successful traders have a written trading plan that defines entries, exits, position size, and risk per trade.
Example: A beginner sees a stock rising sharply and enters. But when it drops, they don’t know whether to cut losses or hold. Confusion results in bigger losses.
Solution: Build a trading plan that answers:
What markets will I trade?
What timeframes will I use?
What setups will I look for?
How much capital will I risk?
When will I exit with profit/loss?
3. Overtrading
New traders often fall into the trap of taking too many trades, thinking more trades mean more profits. In reality, overtrading drains both money and mental energy.
Mistake: Trading every small market move, chasing excitement.
Reality: Professional traders wait patiently for high-probability setups.
Example: A trader makes 15 trades in a single day, paying high brokerage and making impulsive decisions. Even if a few trades win, commissions and losses wipe out gains.
Solution: Quality over quantity. Focus on one or two good setups a day/week instead of chasing every move.
4. Lack of Risk Management
This is perhaps the biggest mistake new traders make. They risk too much on a single trade, hoping for quick riches.
Mistake: Betting 30–50% of capital on one stock/option.
Reality: Risk per trade should usually be 1–2% of total capital.
Example: A trader with ₹1,00,000 puts ₹50,000 into one stock. The stock falls 20%, wiping out ₹10,000 in one trade. After a few such losses, the account is destroyed.
Solution: Use stop-loss orders, risk only small amounts per trade, and accept losses as part of the game.
5. Revenge Trading
After a loss, beginners often feel the need to “make back money quickly.” This emotional reaction leads to revenge trading — entering bigger trades without logic.
Mistake: Trading emotionally after a loss.
Reality: Losses are normal; chasing them increases damage.
Example: A trader loses ₹5,000 in the morning. Angry, they double their position size in the next trade. The market goes against them again, and they lose ₹15,000 more.
Solution: Step away after a loss. Review what went wrong. Never increase position size just to recover money.
6. Lack of Patience
Trading rewards patience, but beginners crave fast profits. They exit winners too early or hold losers too long.
Mistake: Taking profits too soon, cutting winners; holding losers, hoping they turn.
Reality: Let profits run, cut losses quickly.
Example: A stock moves up 2%, and the trader books profit, missing a 10% rally. But when a trade goes down 5%, they refuse to sell, and the loss grows to 20%.
Solution: Trust your trading system. Follow stop-loss and target levels.
7. Following Tips & Rumors
Many new traders blindly follow WhatsApp tips, Twitter posts, or “friend’s advice” without analysis.
Mistake: Relying on others for buy/sell calls.
Reality: Tips may work occasionally but are not reliable long-term.
Example: A trader buys a “hot stock” from a group. The stock spikes briefly but crashes because big players offload positions.
Solution: Do your own research. Build conviction based on analysis, not rumors.
8. Ignoring Trading Psychology
The market is a battle of emotions — fear, greed, hope, and regret. Beginners often underestimate psychology.
Mistake: Thinking trading is 100% about strategy.
Reality: Psychology is often more important than strategy.
Example: Two traders have the same system. One sticks to rules, the other panics and exits early. The disciplined trader profits; the emotional one doesn’t.
Solution: Practice emotional control. Meditation, journaling, and self-awareness help.
9. No Record Keeping
Many beginners don’t track their trades, so they repeat mistakes.
Mistake: Trading without keeping a log.
Reality: A trading journal reveals strengths and weaknesses.
Example: A trader keeps losing in intraday trades but doesn’t realize it because they don’t track results.
Solution: Maintain a trading journal with details: entry, exit, reason for trade, result, and lessons learned.
10. Unrealistic Expectations
Movies, social media, and success stories create a false impression of overnight riches. Beginners expect to double their account in weeks.
Mistake: Believing trading is a shortcut to wealth.
Reality: Trading is a long-term skill, and returns grow with discipline.
Example: A trader starts with ₹50,000 and expects to make ₹10,000 a day. They take huge risks, lose capital, and quit.
Solution: Aim for consistent small profits. Even 2–3% monthly growth compounds into wealth.
11. Poor Money Management
Beginners often don’t allocate capital wisely. They put most money in risky trades, leaving nothing for better opportunities.
Solution: Diversify across trades, keep emergency funds, and never put all money into one asset.
12. Not Understanding Market Conditions
Markets change — trending, ranging, or volatile. Beginners apply the same strategy everywhere.
Example: A breakout strategy may work in trending markets but fail in sideways ones.
Solution: Learn to read market context (volume profile, trend, volatility). Adapt strategies accordingly.
13. Overconfidence After Wins
A few successful trades can make beginners feel invincible. They increase position sizes drastically, only to face big losses.
Solution: Stay humble. Stick to your plan regardless of wins or losses.
14. Fear of Missing Out (FOMO)
FOMO is powerful in trading. Beginners see a stock rallying and jump in late, only to catch the top.
Solution: Accept that missing trades is normal. The market always offers new opportunities.
15. Lack of Continuous Learning
Markets evolve. Strategies that worked last year may fail now. Beginners often stop learning after early success.
Solution: Keep learning — read books, backtest strategies, and follow market news.
16. Mixing Investing with Trading
Beginners often hold losing trades, calling them “long-term investments.” This blurs strategy.
Solution: Separate trading and investing accounts. Stick to timeframes and plans.
17. Ignoring Risk-Reward Ratio
Many beginners take trades where the potential reward is smaller than the risk.
Example: Risking ₹1,000 for a possible profit of ₹200. Even if right most times, losses eventually dominate.
Solution: Take trades with at least 1:2 or 1:3 risk-reward ratio.
18. Not Practicing in Simulation
Jumping into live markets without demo practice is costly.
Solution: Use paper trading or demo accounts first to build skills without losing money.
19. Not Respecting Stop-Loss
Beginners often remove or widen stop-losses, hoping the trade will reverse.
Solution: Treat stop-loss like a safety belt. It protects you from disasters.
20. Quitting Too Soon
Many traders quit after a few losses, never giving themselves a chance to grow.
Solution: Accept that trading mastery takes years. Losses are tuition fees for market education.
Conclusion
Trading is not a sprint but a marathon. Almost every beginner repeats these mistakes: overtrading, poor risk management, revenge trading, following tips, and ignoring psychology. The good news is that mistakes are stepping stones to mastery — if you learn from them.
By approaching trading with education, discipline, patience, and humility, new traders can avoid the traps that wipe out most beginners and build a path toward consistent profits.

Commodities & Currency TradingIntroduction
Financial markets are not limited to stocks and bonds. Beyond equity trading, two of the most important and widely traded asset classes are commodities and currencies (forex). These markets are essential for global trade, economic stability, and investment diversification. They are vast, liquid, and influenced by macroeconomic, geopolitical, and natural factors.
Commodities represent real physical goods like gold, crude oil, wheat, or natural gas.
Currencies represent the exchange rate between two different countries’ monetary systems, like USD/INR or EUR/USD.
Both markets attract traders, investors, speculators, and hedgers. While commodities protect against inflation and provide opportunities during supply-demand imbalances, currency trading allows participants to profit from fluctuations in exchange rates, driven by international trade, interest rates, and monetary policy.
In this guide, we will explore these markets in depth, covering fundamentals, participants, trading mechanisms, strategies, risks, and practical tips for success.
Part 1: Understanding Commodities Trading
What are Commodities?
Commodities are raw materials or primary goods used in commerce. They are standardized, meaning one unit of a commodity is interchangeable with another unit of the same grade and quality. For example, one barrel of crude oil or one ounce of gold is the same everywhere.
Types of Commodities:
Metals – Gold, silver, platinum, copper, aluminum.
Energy – Crude oil, natural gas, coal, gasoline.
Agricultural Products – Wheat, corn, coffee, sugar, cotton.
Livestock – Cattle, hogs, poultry.
Why Trade Commodities?
Hedging: Farmers, oil producers, and companies hedge against price fluctuations.
Speculation: Traders bet on rising or falling prices for profit.
Diversification: Commodities often move differently than stocks and bonds.
Inflation Hedge: Gold and oil, for example, rise when currency value falls.
Commodity Exchanges
Trading takes place on global exchanges such as:
Chicago Mercantile Exchange (CME) – US-based futures and derivatives.
London Metal Exchange (LME) – Specializes in metals.
Multi Commodity Exchange (MCX) – India’s largest commodity exchange.
Intercontinental Exchange (ICE) – Covers energy, agricultural, and financial products.
Forms of Commodity Trading
Spot Trading – Buying or selling the physical commodity for immediate delivery.
Futures Trading – Contracts to buy/sell at a predetermined price on a future date.
Options on Commodities – Gives the right, not obligation, to buy or sell futures.
Commodity ETFs – Exchange-traded funds that track commodity prices.
CFDs (Contracts for Difference) – Speculating on price without owning the commodity.
Key Influences on Commodity Prices
Supply & Demand – Fundamental factor; drought affects wheat, OPEC decisions affect oil.
Geopolitics – Wars, sanctions, and trade disputes impact energy and metals.
Weather & Natural Disasters – Hurricanes affect crude oil; droughts impact crops.
Currency Movements – Commodities priced in USD; weaker USD makes commodities cheaper globally.
Technology & Alternatives – Renewable energy can reduce demand for oil and coal.
Example: Gold Trading
Gold is considered a safe-haven asset. When equity markets are uncertain, investors flock to gold. It is traded both physically and via futures contracts. Factors affecting gold include inflation, central bank policies, and geopolitical risks.
Part 2: Understanding Currency Trading (Forex)
What is Forex?
Forex (Foreign Exchange) is the world’s largest and most liquid financial market, with daily turnover exceeding $7 trillion (BIS 2022). It involves trading one currency against another, such as USD/JPY or EUR/INR.
Currency Pairs
Currencies are quoted in pairs:
Major Pairs – USD paired with EUR, GBP, JPY, CHF, AUD, CAD.
Minor Pairs – Non-USD pairs like EUR/GBP or AUD/NZD.
Exotic Pairs – Emerging market currencies like USD/INR, USD/TRY.
Example:
EUR/USD = 1.1000 means 1 Euro = 1.10 US Dollars.
Why Trade Currencies?
Speculation: Profiting from price movements.
Hedging: Companies hedge against foreign exchange risks in trade.
Arbitrage: Exploiting differences between currency markets.
Global Trade: Facilitates international business transactions.
Participants in Forex
Central Banks – Control monetary policy and intervene in markets.
Commercial Banks – Provide liquidity.
Corporations – Hedge foreign earnings or payments.
Hedge Funds & Investors – Large speculators.
Retail Traders – Small participants trading via brokers.
Trading Mechanisms
Spot Forex – Immediate exchange of currencies.
Forward Contracts – Agreement to exchange at a future date.
Futures & Options – Standardized exchange-traded contracts.
CFDs – Retail traders speculate without owning currencies.
Factors Affecting Currency Prices
Interest Rates – Higher rates attract foreign capital.
Inflation – High inflation weakens a currency.
Economic Indicators – GDP, employment, trade balance.
Geopolitical Events – Elections, wars, sanctions.
Central Bank Policies – Quantitative easing, intervention.
Risk Sentiment – “Risk-on” favors emerging currencies, “Risk-off” favors safe-havens like USD/JPY/CHF.
Example: USD/INR
If the US Federal Reserve raises interest rates, demand for USD increases, and INR weakens. Conversely, strong Indian GDP data could strengthen INR.
Part 3: Strategies in Commodities Trading
Trend Following – Trade in direction of price momentum.
Seasonal Trading – Agricultural commodities follow cycles.
Spread Trading – Long one commodity, short another (e.g., WTI vs Brent crude).
Hedging – Farmers lock prices using futures.
Technical Analysis – Using charts, candlestick patterns, indicators.
Part 4: Strategies in Currency Trading
Carry Trade – Borrow in low-interest-rate currency, invest in high-yielding one.
Scalping & Day Trading – Small, quick profits in liquid pairs like EUR/USD.
Swing Trading – Capture medium-term currency trends.
News Trading – Trading around economic releases (NFP, CPI, Fed rate decisions).
Hedging – Companies use forwards to protect against currency risk.
Part 5: Risks in Commodities & Currency Trading
Leverage Risk: Both markets offer high leverage, magnifying losses.
Price Volatility: Sudden moves due to geopolitical or natural events.
Liquidity Risk: Exotic currencies and less-traded commodities may have low liquidity.
Counterparty Risk: In OTC forex and CFD markets.
Regulatory Risk: Government bans, restrictions, and policy shifts.
Emotional Risk: Greed and fear drive many traders into poor decisions.
Part 6: Risk Management & Best Practices
Position Sizing – Never risk more than 1–2% of capital on a single trade.
Stop-Loss Orders – Protect against unexpected volatility.
Diversification – Trade multiple commodities/currencies, not just one.
Stay Informed – Follow economic calendars, OPEC meetings, and weather reports.
Technical + Fundamental Mix – Balance chart reading with economic analysis.
Avoid Over-Leverage – Excessive borrowing leads to margin calls.
Keep a Trading Journal – Track mistakes and learn from them.
Part 7: Future Trends in Commodities & Currencies
Digital Currencies (CBDCs & Cryptocurrencies) may influence forex.
Green Energy Transition will shift commodity demand from oil/coal to lithium, copper, and renewable resources.
Algorithmic & AI Trading is expanding in both markets.
Geopolitical Fragmentation will continue to impact global trade and currency alignments.
Conclusion
Commodities and currency trading are the lifeblood of the global economy. They are more than speculative arenas—they enable trade, protect producers and consumers, and balance international financial systems.
For traders, these markets provide immense opportunities, but also demand discipline, knowledge, and risk management. A successful trader must understand both macroeconomic fundamentals and technical signals, while maintaining emotional control.
In the end, whether trading gold futures or EUR/USD pairs, the principles remain the same: manage risk, stay informed, follow discipline, and trade with a plan.
Trading Plan & JournalingIntroduction
The financial markets are often described as a battlefield where only the disciplined survive. Traders from all walks of life enter this arena, each armed with different strategies, mindsets, and risk appetites. However, history shows that the majority of traders lose money in the long run—not because the markets are unbeatable, but because they lack structure and discipline.
Two of the most powerful tools for achieving consistency and long-term profitability are:
A Trading Plan – the strategic blueprint that guides every action in the market.
A Trading Journal – the mirror that reflects one’s behavior, decisions, and growth as a trader.
Together, they form the foundation of professional trading. Without them, traders are prone to emotional decision-making, impulsive trades, and recurring mistakes.
This guide will deeply explore both concepts in detail, breaking them into digestible parts, supported by examples, techniques, and psychological insights.
Part I – The Trading Plan
1. What is a Trading Plan?
A trading plan is a written, structured framework that outlines how a trader will approach the market. It defines entry and exit strategies, risk management rules, trading goals, and performance evaluation metrics.
Think of it as the business plan of a trader. Just like a company can’t run without a business plan, a trader cannot succeed long term without a trading plan.
2. Why Do You Need a Trading Plan?
Eliminates guesswork – prevents random or impulsive trades.
Brings consistency – ensures that you execute your strategy the same way every time.
Controls emotions – reduces the impact of fear and greed.
Improves risk management – avoids catastrophic losses.
Helps evaluation – allows you to track results and refine your strategy.
Without a trading plan, traders end up chasing tips, rumors, and news blindly—leading to inconsistent results.
3. Components of a Trading Plan
A solid trading plan should cover the following areas:
A. Personal Assessment
Before crafting strategies, a trader must understand themselves.
Risk tolerance – how much can you afford to lose per trade?
Time availability – are you a full-time day trader, part-time swing trader, or long-term investor?
Psychological strengths and weaknesses – are you patient, disciplined, or easily distracted?
B. Market Selection
Define which markets and instruments you will trade:
Equities (large-cap, mid-cap, small-cap)
Forex
Commodities
Indices
Options & derivatives
Focusing on a limited set of instruments helps you specialize rather than becoming a jack of all trades.
C. Trading Strategy
This section answers the “How” of trading.
Technical approach (candlestick patterns, moving averages, volume profile, market structure).
Fundamental analysis (earnings reports, macroeconomic data).
Hybrid approach (combining both).
Each setup should be clearly defined:
Conditions for entry.
Stop-loss placement.
Profit targets or trailing stops.
Position-sizing rules.
D. Risk & Money Management
The most crucial element. Decide:
Maximum risk per trade (commonly 1–2% of account size).
Maximum daily/weekly drawdown before stopping.
Position sizing formula (e.g., fixed percentage, volatility-based sizing).
Risk-reward ratio (minimum 1:2 or better).
E. Trade Management
Scaling in and out of trades.
Adjusting stop-loss as price moves in your favor.
Handling trades that gap overnight.
F. Trading Schedule
Decide when you’ll trade:
Day trading → during market hours.
Swing trading → end-of-day analysis.
Long-term investing → weekly/monthly review.
G. Performance Evaluation
Set measurable goals:
Win rate (%)
Average profit per trade
Risk-reward ratio
Monthly return target
Maximum acceptable drawdown
4. Example of a Simple Trading Plan
Trader Type: Swing trader
Market: Nifty 50 stocks
Strategy: Trade only bullish engulfing & hammer candlestick patterns near support zones.
Entry Rule: Buy at confirmation candle with above-average volume.
Stop-loss: Below support or candle low.
Target: 2x risk.
Risk Management: 1% per trade, max 3 trades per day.
Review: Weekly journal analysis to refine entries/exits.
5. Mistakes Traders Make with Trading Plans
Not writing it down (keeping it “in the head”).
Overcomplicating strategies.
Ignoring rules when emotions take over.
Constantly changing the plan after small losses.
A plan only works if you follow it with discipline.
Part II – The Trading Journal
1. What is a Trading Journal?
A trading journal is a written or digital record of all trades taken, along with notes on reasoning, emotions, and outcomes. It’s like a diary for traders, where every action in the market is logged for review.
2. Why Keep a Trading Journal?
Identifies strengths & weaknesses – shows what’s working and what isn’t.
Tracks emotional state – helps detect patterns of impulsive trades.
Improves accountability – forces you to justify every trade.
Sharpens discipline – prevents repeating mistakes.
Boosts confidence – reinforces good habits by showing progress.
3. Components of a Trading Journal
A good journal records both quantitative and qualitative data.
Quantitative Data (Numbers):
Date & time of trade
Asset traded
Entry price, exit price, stop-loss, target
Position size
Profit/loss in % and amount
Risk-reward ratio
Qualitative Data (Thoughts & Emotions):
Reason for taking trade
Market conditions (trend, volatility, news)
Emotional state (confident, fearful, greedy)
Mistakes made (if any)
Lessons learned
4. Tools for Trading Journaling
Excel/Google Sheets – customizable, easy to analyze.
TradingView screenshots – annotate charts for visual learning.
Dedicated software – Edgewonk, TraderSync, or simple Notion templates.
Pen & paper – traditional, but effective for emotional notes.
5. Example Trading Journal Entry
Date: 20 Aug 2025
Stock: Infosys
Setup: Bullish engulfing near 200 DMA + support zone.
Entry: ₹1550
Stop-loss: ₹1530
Target: ₹1590 (2:1 RR)
Result: Exited at ₹1585, profit ₹35/share.
Emotion: Felt confident but exited early due to fear of reversal.
Lesson: Stick to plan; don’t book profits too soon.
6. Reviewing Your Journal
The real power of journaling lies in reviewing it regularly.
End of week → review all trades taken.
End of month → calculate win rate, average RR, emotional mistakes.
Quarterly → refine strategy based on data.
Patterns will emerge. For example:
You may find most profits come from trend-following trades, while counter-trend trades lose money.
You may notice losses increase when you trade after 3 consecutive wins (overconfidence).
You may realize that impulsive entries happen more often when you skip morning preparation.
7. Common Mistakes with Journals
Not recording losing trades (only writing about wins).
Writing vague reasons (“felt good about this trade”).
Not reviewing the journal frequently.
Treating it as a chore instead of a learning tool.
Part III – Psychology, Discipline & Growth
A trading plan and journal are useless without the right mindset.
1. Emotional Control
Markets constantly test patience, greed, and fear. A plan provides structure, while a journal helps spot recurring psychological pitfalls.
2. The Role of Discipline
Discipline is simply the act of sticking to your plan regardless of temptation. The journal is your accountability partner.
3. Growth Mindset
Losses are inevitable. Journaling turns losses into lessons, making them investments in education rather than failures.
4. The Feedback Loop
Execute trades according to plan.
Record them in the journal.
Review & identify improvements.
Refine the trading plan.
This cycle creates continuous improvement.
Part IV – Practical Tips for Success
Start simple – don’t overload your plan/journal with unnecessary data.
Use screenshots – visual memory is stronger than written notes.
Reward yourself – celebrate when you stick to your plan, even on losing trades.
Keep emotions in check – note them honestly, even if embarrassing.
Backtest strategies – before adding to your plan, test them historically.
Conclusion
A trader without a plan and journal is like a ship sailing without a compass—drifting aimlessly in stormy seas. The combination of a well-structured trading plan and a disciplined journaling practice transforms trading from a gamble into a business.
The plan gives direction.
The journal provides feedback.
Together, they create consistency, accountability, and growth.
Successful trading is not about predicting the market perfectly—it’s about managing risk, executing with discipline, and learning continuously.
If you dedicate yourself to creating and following your trading plan, while diligently maintaining a journal, you’ll find yourself ahead of 90% of traders who rely solely on intuition.

Part3 Trading MasterclassOption Trading vs Stock Trading
Stocks = Ownership, long-term growth, dividends.
Options = Contracts, leverage, flexible strategies.
Stocks = Simpler, but capital-intensive.
Options = Complex, but require less capital and offer hedging.
For example:
Buying 100 shares of Reliance at ₹2500 = ₹2,50,000.
Buying 1 call option of Reliance at ₹100 premium with lot size 250 = only ₹25,000.
This leverage makes options attractive—but also riskier.
Real-Life Examples & Case Studies
Case 1: Bull Market
A trader buys Nifty 20000 Call at ₹200 premium. Nifty rallies to 20500. Profit = ₹300 (500 – 200). Huge return on a small premium.
Case 2: Bear Market
Investor holds TCS shares but fears a fall. Buys a protective put. When stock drops, put increases in value, reducing losses.
Case 3: Neutral Market
Trader sells an Iron Condor on Bank Nifty, betting price will stay range-bound. Premium collected = profit if market stays sideways.

Part 2 Trading MasterclassOption Trading vs Stock Trading
Stocks = Ownership, long-term growth, dividends.
Options = Contracts, leverage, flexible strategies.
Stocks = Simpler, but capital-intensive.
Options = Complex, but require less capital and offer hedging.
For example:
Buying 100 shares of Reliance at ₹2500 = ₹2,50,000.
Buying 1 call option of Reliance at ₹100 premium with lot size 250 = only ₹25,000.
This leverage makes options attractive—but also riskier.
Real-Life Examples & Case Studies
Case 1: Bull Market
A trader buys Nifty 20000 Call at ₹200 premium. Nifty rallies to 20500. Profit = ₹300 (500 – 200). Huge return on a small premium.
Case 2: Bear Market
Investor holds TCS shares but fears a fall. Buys a protective put. When stock drops, put increases in value, reducing losses.
Case 3: Neutral Market
Trader sells an Iron Condor on Bank Nifty, betting price will stay range-bound. Premium collected = profit if market stays sideways.

Part 1 Trading MasterclassRisks & Rewards in Option Trading
Option trading can be thrilling, but it’s not without risks.
For Buyers:
Maximum loss = premium paid.
Maximum profit = potentially unlimited (for calls) or huge (for puts).
For Sellers:
Maximum gain = premium received.
Maximum loss = unlimited (for calls) or very large (for puts).
Risks also come from:
Time decay (options lose value daily).
Volatility crush (sudden drop in implied volatility can reduce premiums).
Liquidity issues (wide bid-ask spreads can hurt execution).
That’s why risk management (stop-losses, proper sizing, hedging) is crucial.
Option Trading vs Stock Trading
Stocks = Ownership, long-term growth, dividends.
Options = Contracts, leverage, flexible strategies.
Stocks = Simpler, but capital-intensive.
Options = Complex, but require less capital and offer hedging.
For example:
Buying 100 shares of Reliance at ₹2500 = ₹2,50,000.
Buying 1 call option of Reliance at ₹100 premium with lot size 250 = only ₹25,000.
This leverage makes options attractive—but also riskier.

Divergence SecretsRisks & Rewards in Option Trading
Option trading can be thrilling, but it’s not without risks.
For Buyers:
Maximum loss = premium paid.
Maximum profit = potentially unlimited (for calls) or huge (for puts).
For Sellers:
Maximum gain = premium received.
Maximum loss = unlimited (for calls) or very large (for puts).
Risks also come from:
Time decay (options lose value daily).
Volatility crush (sudden drop in implied volatility can reduce premiums).
Liquidity issues (wide bid-ask spreads can hurt execution).
That’s why risk management (stop-losses, proper sizing, hedging) is crucial.
Option Trading vs Stock Trading
Stocks = Ownership, long-term growth, dividends.
Options = Contracts, leverage, flexible strategies.
Stocks = Simpler, but capital-intensive.
Options = Complex, but require less capital and offer hedging.
For example:
Buying 100 shares of Reliance at ₹2500 = ₹2,50,000.
Buying 1 call option of Reliance at ₹100 premium with lot size 250 = only ₹25,000.
This leverage makes options attractive—but also riskier.

Option Trading Option Pricing & The Greeks
Options are not priced randomly. Their value comes from several factors:
Intrinsic Value: The real, tangible value (difference between stock price and strike).
Time Value: Extra premium paid for the possibility of future movement.
Volatility: The higher the uncertainty, the higher the option premium.
Option Greeks – the essential toolkit:
Delta – Measures how much an option’s price changes with a change in stock price. (Think: sensitivity to price).
Gamma – Measures how much Delta itself changes.
Theta – Time decay. Shows how much an option loses value each day as expiration approaches.
Vega – Sensitivity to volatility. Higher volatility = higher option price.
Rho – Sensitivity to interest rates (less relevant for short-term traders).
Understanding Greeks is like knowing the gears of a car—they help control risk.
Option Trading Strategies
Here’s where things get exciting. Options are like Lego blocks—you can combine them in different ways to create powerful strategies.
A. Basic Strategies
Buying Calls – Bullish bet.
Buying Puts – Bearish bet.
Covered Call – Holding a stock and selling calls to earn income.
Protective Put – Owning stock and buying puts to insure against loss.
B. Intermediate Strategies
Straddle – Buy a call + put at same strike, betting on big movement (either direction).
Strangle – Similar to straddle but different strikes, cheaper.
Bull Call Spread – Buy one call, sell a higher strike call. Profits capped but cheaper.
Bear Put Spread – Buy a put, sell lower strike put.
C. Advanced Strategies
Iron Condor – Selling an OTM call spread + OTM put spread, betting on low volatility.
Butterfly Spread – Combining multiple options to profit if stock stays near a target price.
Calendar Spread – Exploiting time decay by selling short-term and buying long-term options.
Each strategy has a risk-reward profile and works best in specific market conditions.

PCR Trading StrategyHow Options Work
Let’s break it down simply:
If you buy a call, you are betting that the price of the stock will go up.
If you buy a put, you are betting that the price of the stock will go down.
If you sell (write) a call, you are taking the opposite bet—that the stock won’t rise much.
If you sell (write) a put, you are betting that the stock won’t fall much.
Here’s a quick example:
Stock XYZ trades at ₹100.
You buy a 1-month call option with a strike price of ₹105 by paying a ₹5 premium.
If the stock rises to ₹120, your option is worth ₹15 (120 – 105). Since you paid ₹5, your profit = ₹10.
If the stock stays below ₹105, the option expires worthless, and you lose your premium of ₹5.
This example shows that options can magnify profits if you’re right, but they can also cause losses (limited to the premium paid for buyers, unlimited for sellers).
Types of Options
A. Call Options
Right to buy.
Used when you expect prices to rise.
Buyers have limited risk (premium) but unlimited upside.
Sellers (writers) have limited gain (premium received) but unlimited risk.
B. Put Options
Right to sell.
Used when you expect prices to fall.
Buyers have limited risk but big upside if stock falls sharply.
Sellers have limited gain (premium) but large risk if stock collapses.

Part 2 Support and ResistanceHow Options Work
Let’s break it down simply:
If you buy a call, you are betting that the price of the stock will go up.
If you buy a put, you are betting that the price of the stock will go down.
If you sell (write) a call, you are taking the opposite bet—that the stock won’t rise much.
If you sell (write) a put, you are betting that the stock won’t fall much.
Here’s a quick example:
Stock XYZ trades at ₹100.
You buy a 1-month call option with a strike price of ₹105 by paying a ₹5 premium.
If the stock rises to ₹120, your option is worth ₹15 (120 – 105). Since you paid ₹5, your profit = ₹10.
If the stock stays below ₹105, the option expires worthless, and you lose your premium of ₹5.
This example shows that options can magnify profits if you’re right, but they can also cause losses (limited to the premium paid for buyers, unlimited for sellers).
Types of Options
A. Call Options
Right to buy.
Used when you expect prices to rise.
Buyers have limited risk (premium) but unlimited upside.
Sellers (writers) have limited gain (premium received) but unlimited risk.
B. Put Options
Right to sell.
Used when you expect prices to fall.
Buyers have limited risk but big upside if stock falls sharply.
Sellers have limited gain (premium) but large risk if stock collapses.

Part 1 Support and Resistance1. Introduction to Options
In the world of financial markets, traders and investors use various tools to manage risk, speculate on price movements, or generate additional income. One of the most powerful and flexible tools is options trading.
An option is a financial derivative, which means its value is derived from another underlying asset. This underlying asset could be a stock, an index, a commodity, or even a currency. Unlike stocks, where you own a piece of the company, an option is a contract that gives you certain rights related to buying or selling the underlying asset at a specific price and within a specified time.
Options are incredibly versatile. Traders use them for hedging (protection against loss), speculation (betting on future price moves), or income generation (selling options for premiums). But with great flexibility comes complexity, and that’s why understanding option trading deeply is essential before jumping in.
2. Basic Terminology in Option Trading
Before diving deep, let’s clear some essential terms:
Call Option: A contract giving the right (not obligation) to buy an asset at a predetermined price (strike price) before expiration.
Put Option: A contract giving the right (not obligation) to sell an asset at a predetermined price before expiration.
Strike Price: The fixed price at which the option holder can buy (for calls) or sell (for puts) the underlying.
Premium: The cost of purchasing an option contract. This is the price paid upfront by the buyer to the seller (writer).
Expiration Date: The date when the option contract expires. After this, the option becomes worthless if not exercised.
In the Money (ITM): An option that has intrinsic value. For calls, when the stock price > strike price. For puts, when stock price < strike price.
Out of the Money (OTM): An option with no intrinsic value (only time value). For calls, stock price < strike price. For puts, stock price > strike price.
At the Money (ATM): When the stock price and strike price are roughly equal.
Option Writer: The seller of the option contract. They receive the premium but take on obligation.
Lot Size: Options are traded in fixed quantities called lots (e.g., 50 or 100 shares per contract depending on the market).
Understanding these terms is like learning the alphabet before writing sentences—you need them to progress.

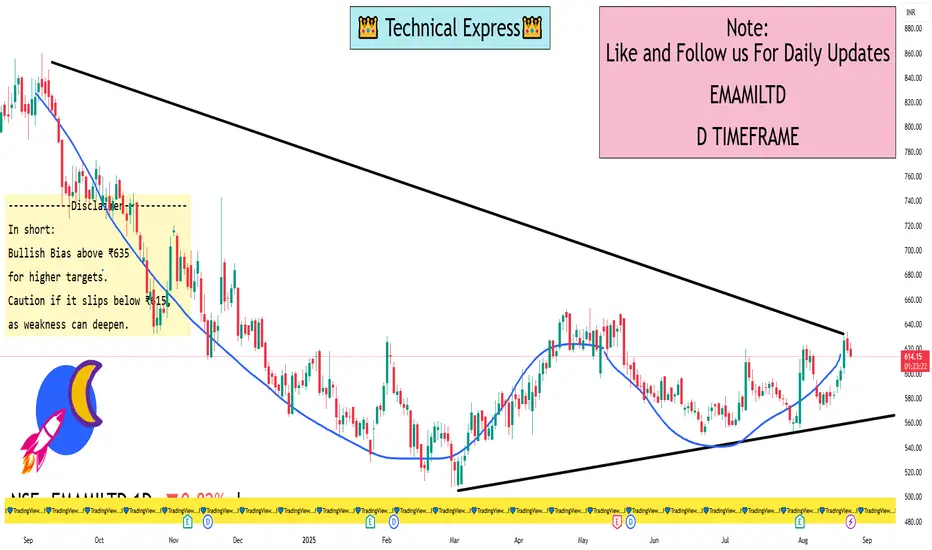
EMAMI 1 Day ViewEmami Ltd – Daily Levels
Current Market Structure: Stock is trading in a consolidation range after a recent upward move. Momentum is steady but showing mild profit-booking near resistance.
🔑 Key Levels
Support Zones
₹615 – Strong near-term support, recent demand zone.
₹600 – Major support, breakdown below may invite weakness.
₹585 – Next cushion if selling extends.
Resistance Zones
₹635 – Immediate resistance (recent supply zone).
₹648 – Breakout level; above this stock may gain momentum.
₹660+ – Next bullish target if breakout sustains.
Trend Outlook
Above ₹635 → Momentum buyers may push toward ₹648–660.
Below ₹615 → Weakness may drag it back toward ₹600–585.
📌 Indicators View
Volume: Decreasing, showing consolidation.
RSI (Daily): Near neutral zone (~50–55), showing balanced momentum.
200 DMA: Stock trading comfortably above it, indicating long-term bullishness intact.
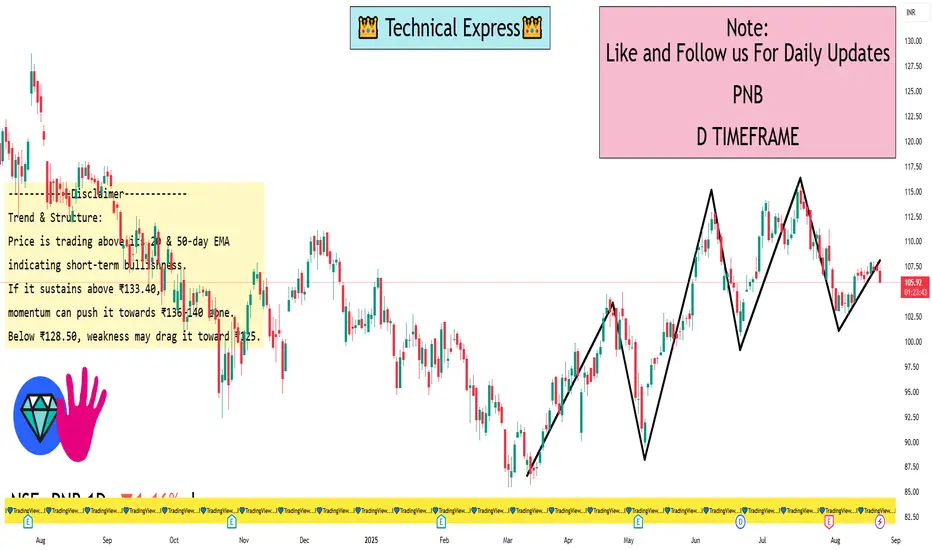
PNB 1 Day ViewSupport Levels:
₹128.50 – Immediate support (recent swing low)
₹125.20 – Strong demand zone
₹121.80 – Major support
Resistance Levels:
₹133.40 – Immediate hurdle
₹136.20 – Strong resistance (recent high area)
₹140.00 – Psychological & breakout level
📈 Trend & Structure:
Price is trading above its 20 & 50-day EMA, indicating short-term bullishness.
If it sustains above ₹133.40, momentum can push it towards ₹136–140 zone.
Below ₹128.50, weakness may drag it toward ₹125.
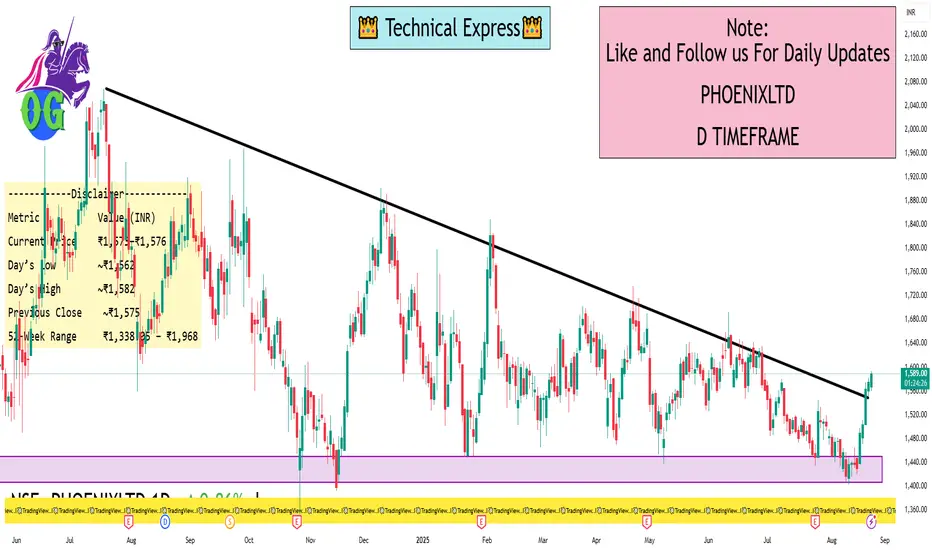
Phoenix 1 Day ViewHere’s a summary of the latest intraday data:
Current price: Approximately ₹1,573.00–₹1,576.00
Daily range: Between ₹1,562.00 (low) and ₹1,582.50 (high)
Previous closing price: Around ₹1,575.50
52-week range: ₹1,338.05 — ₹1,968.00
Specifically:
TradingView reports a current price of ₹1,575.50, showing a gain of ~0.76% in the last 24 hours. Day’s range is consistent with ₹1,562.00–₹1,582.50
Screener shows the price at ₹1,573 as of 10:44 a.m. IST today
Investing.com indicates the stock is trading at ₹1,575.50, with day’s range and 52-week range matching other sources
Financial Times Markets Data confirms intraday trading between ₹1,560.40 and ₹1,582.50, with previous close at₹1,575.00
Suggested Next Steps
Charting Platforms – Sites like TradingView, Investing.com, or Moneycontrol offer real-time intraday charts. These let you analyze key levels such as open, high, low, VWAP, and volume trends.
Technical Indicators – To identify support and resistance, you might want to apply indicators like moving averages (e.g., 20/50 EMA), RSI, or VWAP.
Alerts and Watchlists – Set price alerts around critical levels (e.g., ₹1,562 or ₹1,582) to stay informed of key moves.
Volume Analysis – Intraday volume can confirm the strength behind any move—higher volume on breakouts or dips is particularly telling.
Money and Mind in Trading1. Introduction
Trading is often viewed as a battle between the trader and the market. But in reality, the market is neutral—it doesn’t care about you, your opinions, or your predictions. The true battle is internal, between your money (how you manage your capital) and your mind (how you handle emotions and psychology).
Think about this:
A trader with a brilliant strategy but poor money management will eventually lose all capital.
A trader with enough money but a weak mindset will panic and make irrational moves.
Only when money management and psychological discipline align, can trading become consistently profitable.
Thus, the formula for success in trading can be summarized as:
Trading Success = Money Management × Mind Management × Strategy
2. The Role of Money in Trading
a) Importance of Capital
Money is the fuel of trading. Without adequate capital, even the best strategies can fail.
Undercapitalized traders often take excessive risks to make meaningful returns.
Well-capitalized traders can afford patience, better position sizing, and discipline.
For example, if you only have ₹10,000, risking ₹5,000 on a single trade feels tempting but dangerous. With ₹10 lakh, you can risk just 1% per trade and still earn consistently without emotional stress.
b) Risk Management
Risk management is about protecting capital first and focusing on profits second.
Golden rules:
Never risk more than 1-2% of capital per trade.
Always set a stop-loss before entering.
Diversify trades instead of going “all in.”
This ensures survival. Because in trading, survival = opportunity to win tomorrow.
c) Position Sizing
Position sizing determines how much to trade given your account size and risk tolerance.
Formula example:
If you have ₹1,00,000 capital and risk 1% per trade (₹1,000), and your stop-loss is ₹10 per share, you can buy 100 shares (₹1,000 ÷ ₹10).
This systematic approach removes emotional guessing.
d) Compounding and Capital Growth
The real wealth in trading comes from compounding small gains consistently.
A trader making 1% per week can grow capital by over 67% annually (with compounding).
Patience + consistency beats “get rich quick.”
e) Common Money Mistakes in Trading
Over-leverage (borrowing excessively to trade).
No risk/reward planning.
Chasing losses (“revenge trading”).
Putting all money in one stock/option.
Trading without capital backup (no emergency funds).
Money mistakes often lead to psychological pressure, which worsens decision-making.
3. The Role of Mind in Trading
If money is the fuel, then the mind is the driver. Even with perfect capital management, a weak mindset can wreck results.
a) Psychology of Decision-Making
Trading decisions are influenced by:
Fear – “What if I lose?”
Greed – “Let me hold longer for bigger profit.”
Hope – “Maybe it will recover.”
Regret – “I should’ve sold earlier.”
These emotions distort rational thinking.
b) Common Psychological Biases
Overconfidence Bias – After a few wins, traders feel invincible.
Loss Aversion – People hate losing ₹1 more than they enjoy gaining ₹1.
Confirmation Bias – Seeking news that supports your view while ignoring opposite evidence.
Gambler’s Fallacy – Believing a losing streak must end soon.
Recognizing these biases helps neutralize them.
c) Discipline Factor
Discipline = Following your trading plan no matter what.
Without discipline, traders exit winners too early and hold losers too long.
With discipline, traders follow stop-loss, stick to risk per trade, and wait for setups.
d) Patience vs Impulsiveness
Great trades don’t appear daily. Impulsive traders overtrade, while patient traders wait for high-probability setups.
As Jesse Livermore said: “It was never my thinking that made me money. It was always my sitting.”
e) Building Mental Resilience
Trading is stressful because of uncertainty. To build resilience:
Accept that losses are part of the game.
Detach ego from trades.
Focus on the process, not outcome.
Develop habits outside trading (exercise, meditation, journaling).
4. The Money-Mind Connection
Money and mind are deeply linked in trading:
Lack of money → stress, fear, over-leverage.
Too much greed for money → reckless decisions.
Emotional mind → bad money management.
Example: A trader with ₹20,000 risks ₹10,000 in a single option trade. Why? The mind says: “I need quick profits.” But when the trade goes against him, fear takes over and he exits at maximum loss. This is the money-mind trap.
Thus, the solution is balance:
Adequate capital.
Strict money management.
Calm psychology.
5. Practical Framework: Money + Mind Balance
Here’s a practical blueprint:
Step 1: Define Capital Rules (Money)
Risk per trade: 1% of account.
Risk per day: 3% max.
Keep emergency funds separate.
Step 2: Define Psychological Rules (Mind)
Accept losses without revenge trading.
No overtrading after big wins.
Stick to trading hours and avoid burnout.
Step 3: Journaling
Keep a trading journal tracking not just trades, but also your emotions. Example:
“Exited early due to fear.”
“Didn’t follow plan because of greed.”
This self-awareness improves both money and mind management.
6. Case Studies & Examples
Case 1: The Undisciplined Trader
Rahul starts with ₹50,000. He risks ₹20,000 on a single option trade. It fails. Capital halves. In desperation, he doubles down and loses everything.
Lesson: Poor money management + emotional revenge trading = wipeout.
Case 2: The Disciplined Trader
Meera starts with ₹1,00,000. She risks only 1% per trade. She loses 5 trades in a row, but her account is still ₹95,000. On the 6th trade, she wins 5R (₹5,000). Net balance: profit.
Lesson: Risk control and patience protect the trader until a winning streak comes.
7. Conclusion: The Balanced Trader’s Blueprint
Trading is not just charts, patterns, or strategies. It is a test of two inner resources:
Money – How you allocate, risk, and grow your capital.
Mind – How you manage emotions, discipline, and psychology.
Without money, you can’t trade. Without the right mind, you can’t trade successfully. Together, they form the foundation of long-term trading success.
The secret is not to chase quick riches, but to survive, grow steadily, and let compounding work. And survival comes only when your money rules protect your capital and your mind rules protect you from yourself.
In short: Master the money, master the mind, and the market will reward you.
Types of Financial MarketsIntroduction
Finance is the backbone of any economy, and at the center of this financial ecosystem lie the financial markets. These markets serve as platforms where buyers and sellers engage in the exchange of financial instruments such as stocks, bonds, currencies, derivatives, and commodities. They enable efficient capital allocation, liquidity creation, and wealth distribution in an economy.
Understanding financial markets is crucial for investors, traders, policy makers, and even the general public because these markets influence everything from government policies to personal investment decisions.
Broadly, financial markets can be categorized into several types based on the instruments traded, the maturity of securities, the nature of participants, and the purpose they serve.
In this article, we will explore:
The functions of financial markets
Major types of financial markets
Examples and their relevance in the real economy
Advantages and challenges of each type
How they interconnect to form the global financial system
Functions of Financial Markets
Before diving into the types, let’s understand why financial markets exist and what purpose they serve:
Capital Formation: They channel funds from savers (households, institutions) to borrowers (businesses, governments).
Liquidity: They provide an avenue to convert financial instruments into cash quickly.
Price Discovery: Markets determine the fair value of financial instruments through demand and supply forces.
Risk Management: Through derivatives and insurance-like instruments, investors can hedge against risks.
Efficient Allocation of Resources: Funds flow toward businesses and projects with the most promising prospects.
Economic Growth: They support industrial expansion, innovation, and employment by financing new ventures.
Broad Classification of Financial Markets
Financial markets can be broadly divided into two categories:
Money Market – Deals with short-term funds (less than one year).
Capital Market – Deals with long-term funds (more than one year).
From here, multiple subcategories exist, including stock markets, bond markets, forex markets, derivatives markets, and commodity markets.
1. Money Market
The money market is where short-term borrowing and lending take place, usually for periods of less than one year. It is essential for maintaining liquidity in the financial system.
Instruments in the Money Market
Treasury Bills (T-Bills): Issued by the government to raise short-term funds. They are risk-free and highly liquid.
Commercial Papers (CPs): Short-term unsecured promissory notes issued by corporations.
Certificates of Deposit (CDs): Issued by banks, offering fixed returns over short maturities.
Repurchase Agreements (Repos): Short-term loans where securities are sold with an agreement to repurchase later.
Call Money Market: Interbank lending for very short durations (even overnight).
Importance
Provides liquidity to banks and institutions.
Helps governments manage short-term funding needs.
Facilitates monetary policy operations by central banks.
2. Capital Market
The capital market deals with medium to long-term financing. It is divided into primary markets (new securities issued) and secondary markets (trading of existing securities).
A. Primary Market
Companies issue Initial Public Offerings (IPOs) to raise funds.
Governments issue bonds for infrastructure or development projects.
Investors provide funds directly to businesses.
B. Secondary Market
Existing securities (stocks, bonds) are traded among investors.
Provides liquidity and exit opportunities for investors.
Examples: NSE, BSE, NYSE, NASDAQ, LSE.
Functions
Mobilizes savings into investments.
Provides companies with access to long-term funding.
Encourages corporate growth and expansion.
3. Stock Market (Equity Market)
The stock market is perhaps the most well-known type of financial market. It deals with the buying and selling of company shares.
Types
Primary Stock Market: Where companies issue new shares (IPOs, FPOs).
Secondary Stock Market: Where existing shares are traded.
Key Global Stock Exchanges
New York Stock Exchange (NYSE) – USA
NASDAQ – USA
London Stock Exchange (LSE) – UK
Bombay Stock Exchange (BSE) – India
National Stock Exchange (NSE) – India
Tokyo Stock Exchange (TSE) – Japan
Importance
Helps companies raise equity capital.
Provides investors with wealth creation opportunities.
Reflects economic conditions of a country.
4. Bond Market (Debt Market)
The bond market (or debt market) is where governments, corporations, and institutions issue debt securities to raise capital.
Types of Bonds
Government Bonds (Sovereign Bonds): Risk-free, issued to fund government expenditure.
Corporate Bonds: Issued by companies for long-term financing.
Municipal Bonds: Issued by local governments for projects like schools or infrastructure.
Convertible Bonds: Can be converted into equity at a later date.
Role
Provides predictable returns to investors.
Allows governments to finance fiscal deficits.
Offers diversification to investors who seek lower risk than equities.
5. Derivatives Market
The derivatives market deals with financial contracts whose value is derived from underlying assets such as stocks, bonds, commodities, or currencies.
Types of Derivatives
Futures Contracts: Agreement to buy/sell at a future date at a predetermined price.
Options Contracts: Right, but not obligation, to buy/sell at a specific price.
Swaps: Exchange of cash flows (e.g., interest rate swaps, currency swaps).
Forwards: Customized contracts between two parties.
Importance
Helps manage risk (hedging).
Provides leverage opportunities for traders.
Facilitates price discovery.
6. Foreign Exchange (Forex) Market
The Forex market is the world’s largest financial market, where currencies are traded.
Key Features
Decentralized, operates 24/7 globally.
Daily turnover exceeds $7 trillion (2025 estimate).
Major currency pairs: EUR/USD, GBP/USD, USD/JPY, USD/INR.
Participants
Central banks
Commercial banks
Corporations
Hedge funds
Retail traders
Importance
Facilitates global trade and investment.
Provides a mechanism for hedging currency risks.
Enables speculation on exchange rate movements.
7. Commodity Market
The commodity market deals with raw materials and primary products such as gold, silver, oil, natural gas, agricultural products, and metals.
Types
Hard Commodities: Metals, oil, natural resources.
Soft Commodities: Agricultural products like coffee, wheat, sugar.
Examples of Commodity Exchanges
MCX (Multi Commodity Exchange) – India
NCDEX (National Commodity & Derivatives Exchange) – India
CME (Chicago Mercantile Exchange) – USA
LME (London Metal Exchange) – UK
Importance
Enables producers and consumers to hedge against price fluctuations.
Provides opportunities for traders and investors.
Plays a vital role in inflation and cost-of-living measures.
8. Insurance Market
The insurance market is a specialized financial market that provides risk protection.
Individuals and businesses pay premiums to insurance companies.
Insurers pool risks and pay claims in case of insured events.
Examples: Life insurance, health insurance, property insurance, reinsurance.
9. Mortgage Market
This market deals with loans secured by real estate (housing or commercial properties).
Primary Mortgage Market: Direct lending between banks and borrowers.
Secondary Mortgage Market: Mortgages are bundled and sold as securities (Mortgage-Backed Securities – MBS).
The 2008 Global Financial Crisis highlighted the risks in this market when mortgage-backed securities collapsed.
10. Cryptocurrency Market
A relatively new market, cryptocurrencies operate on blockchain technology.
Examples
Bitcoin (BTC)
Ethereum (ETH)
Ripple (XRP)
Solana (SOL)
Features
Decentralized and borderless.
Volatile but offers high returns.
Increasingly gaining mainstream adoption.
Conclusion
Financial markets are the lifeline of modern economies. They are diverse, ranging from traditional stock and bond markets to emerging cryptocurrency and derivative markets. Each type serves a unique function – from providing short-term liquidity to enabling long-term capital formation, risk management, and global trade facilitation.
For individuals, understanding these markets opens up opportunities for wealth creation, portfolio diversification, and financial security. For nations, well-functioning financial markets are critical to sustaining growth, innovation, and stability.
As economies evolve with digital technologies and globalization, financial markets will continue to expand and innovate, offering both opportunities and challenges.

Day Trading vs Swing Trading: A Deep-Dive ComparisonIntroduction
When it comes to trading in the stock market, there are countless strategies, styles, and approaches that traders adopt. Two of the most popular methods among retail and professional traders are day trading and swing trading. Both strategies aim to generate profits from short-term price fluctuations in stocks, forex, commodities, or cryptocurrencies, but they differ significantly in execution, mindset, risk, and lifestyle requirements.
Choosing between day trading and swing trading is like choosing between sprinting and middle-distance running. Both involve running, but the pace, stamina, and strategies differ. Similarly, both day traders and swing traders thrive on short-term price moves, but the way they participate in the market is fundamentally different.
This article explores day trading vs swing trading in depth, covering definitions, key characteristics, advantages, risks, required skills, tools, psychology, and a balanced conclusion to help traders decide which style suits them best.
Chapter 1: Understanding Day Trading
What is Day Trading?
Day trading is the practice of buying and selling financial instruments within the same trading day, often closing all positions before the market closes. The objective is to capture small but frequent price movements. Day traders rarely hold trades overnight, minimizing exposure to overnight risks such as gaps, earnings announcements, or global events.
Characteristics of Day Trading
High Trade Frequency – Dozens or even hundreds of trades per day.
Small Profit Margins – Aim for a few points, ticks, or basis points per trade.
Intra-Day Charts – 1-minute, 5-minute, 15-minute, and sometimes hourly charts are heavily used.
Fast Execution – Requires speed, precision, and often advanced trading software.
Capital Requirement – Higher margins or regulatory requirements (e.g., pattern day trading rule in the U.S.).
Typical Day Trader Workflow
Pre-market preparation: Analyzing news, earnings reports, and economic data.
Identifying setups: Using technical indicators, price action, or order flow.
Executing trades: Entering and exiting within minutes or hours.
Risk control: Using tight stop-losses, rarely risking more than 1-2% per trade.
Closing all positions: No overnight holdings.
Example
A day trader sees a stock break above a pre-market resistance level. They buy 500 shares at ₹200, sell them within 15 minutes at ₹202, making ₹1,000 profit. They repeat this process multiple times daily.
Chapter 2: Understanding Swing Trading
What is Swing Trading?
Swing trading is the practice of holding trades for several days to weeks to capture medium-term market moves. Swing traders exploit market “swings” caused by supply-demand imbalances, news-driven momentum, or technical setups.
Characteristics of Swing Trading
Lower Trade Frequency – A few trades per week or month.
Larger Profit Targets – Aim for 5–20% moves, sometimes more.
Daily & Weekly Charts – Focus on higher timeframes like 1D, 4H, or weekly charts.
Overnight Exposure – Positions are held through overnight gaps, earnings, or news.
Capital Efficiency – Can trade with smaller accounts due to lower frequency and lower transaction costs.
Typical Swing Trader Workflow
Scanning markets: Identifying trends, consolidations, or breakouts.
Entry timing: Using technical levels (support/resistance, moving averages).
Position holding: Holding trades for days/weeks until targets are hit.
Risk management: Stop-losses wider than day trading, but risk per trade is carefully calculated.
Review & rebalance: Adjusting positions based on new data or chart setups.
Example
A swing trader notices a stock forming a bullish cup-and-handle pattern. They buy at ₹200 with a stop-loss at ₹190 and a target of ₹230. The trade takes 10 days to hit the target, yielding a 15% profit.
Chapter 3: Advantages & Disadvantages
Advantages of Day Trading
No Overnight Risk – No exposure to after-hours events.
Daily Income Potential – Consistent profits if disciplined.
Leverage Opportunities – Brokers often provide higher intraday leverage.
Skill Development – Sharpens quick decision-making and execution.
Disadvantages of Day Trading
High Stress & Intensity – Demanding lifestyle, mentally exhausting.
High Transaction Costs – Frequent trades increase brokerage and taxes.
Steep Learning Curve – Requires years of practice.
Capital Restrictions – Some markets impose minimum balances (e.g., $25,000 in U.S. for PDT rule).
Advantages of Swing Trading
Flexibility – Suitable for part-time traders with jobs.
Bigger Profit Margins – Larger gains per trade.
Less Stress – No need to watch every tick.
Lower Costs – Fewer transactions, lower fees.
Disadvantages of Swing Trading
Overnight & Weekend Risk – Gap risk due to news or global events.
Slower Results – Waiting days/weeks for trade resolution.
Discipline Required – Avoiding emotional exits during volatility.
Dependence on Trends – Works best in trending markets, struggles in choppy sideways markets.
Chapter 4: Required Skills
Skills for Day Traders
Technical Mastery: Reading candlestick patterns, order flow, momentum indicators.
Execution Speed: Entering/exiting trades instantly.
Emotional Control: Avoiding overtrading, revenge trading.
Adaptability: Quickly adjusting strategies based on market conditions.
Skills for Swing Traders
Patience: Waiting for setups and letting trades play out.
Chart Reading: Spotting longer-term patterns, support/resistance.
Risk Management: Wider stops and position sizing.
Fundamental Awareness: Earnings reports, economic cycles, sectoral strength.
Chapter 5: Lifestyle Differences
Day Trader’s Lifestyle
Rigid schedule, glued to screens.
Highly stressful, like a high-pressure job.
Potentially lucrative but exhausting.
Swing Trader’s Lifestyle
Flexible, allows another job or business.
More relaxed, less screen time.
Profit cycles are slower, requiring patience.
Chapter 6: Risk & Money Management
Both day trading and swing trading require strict risk management.
Day Traders: Use very tight stop-losses (0.5–1%). Since trades are frequent, even small losses can add up quickly. They usually risk 1% or less of capital per trade.
Swing Traders: Use wider stop-losses (2–5%), but since trade frequency is lower, they can size positions accordingly.
Golden Rule: In both styles, protecting capital is more important than chasing profits.
Chapter 7: Tools & Technology
Day Trading Tools:
Advanced brokers with fast execution.
Real-time scanners and news feeds.
Level 2 market data and order book.
1-min to 15-min charts with volume analysis.
Swing Trading Tools:
Stock screeners and scanners (fundamental + technical).
End-of-day charting platforms.
Alerts for breakouts or moving averages.
Daily/weekly trend analysis.
Chapter 8: Psychology of Day vs Swing Traders
Day Trader Mindset:
Thrives under pressure.
Short attention span but sharp reflexes.
Accepts small wins and small losses.
Needs strong discipline against greed/fear.
Swing Trader Mindset:
Patient and long-term thinker.
Comfortable with delayed gratification.
Can handle volatility and avoid panic exits.
Strong analytical temperament.
Chapter 19: Which One is Better?
There’s no “better” strategy universally—it depends on the trader’s goals, personality, and lifestyle.
Choose Day Trading if:
You can dedicate full-time hours.
You enjoy fast action and adrenaline.
You have sufficient capital to meet margin requirements.
You’re disciplined and thrive in high-stress environments.
Choose Swing Trading if:
You have a job/business and can’t sit in front of screens all day.
You prefer patience over speed.
You’re looking for bigger gains per trade.
You can handle overnight risk.
Conclusion
Day trading and swing trading are like two sides of the same coin. Both aim to capture short-term profits but differ in approach, holding period, required skills, and lifestyle impact. Day trading is fast, stressful, and capital-intensive but offers quick returns. Swing trading is slower, less stressful, and more flexible but comes with overnight risk.
Ultimately, the best trading style is the one aligned with your personality and goals. Many traders experiment with both before settling into the strategy that suits them. Whether you choose the sprint of day trading or the steady stride of swing trading, success depends less on the strategy itself and more on discipline, risk management, and consistency.