Part 2 Ride The Big MovesBasics of Options
Before jumping into strategies, let’s revisit some fundamentals:
Call Option: Gives the buyer the right to buy the asset at a specific strike price.
Put Option: Gives the buyer the right to sell the asset at a specific strike price.
Option Premium: The price paid to buy an option.
Strike Price: The price at which the underlying can be bought/sold.
Expiry Date: The last date the option can be exercised.
ITM (In-the-Money): Option has intrinsic value (profitable if exercised).
OTM (Out-of-the-Money): Option has no intrinsic value (not profitable if exercised).
ATM (At-the-Money): Strike price is very close to current market price.
💡 Quick Example:
Nifty is at 22,000. You buy a 22,000 Call Option for ₹200 premium. If Nifty rises to 22,500, your option has value (ITM). If Nifty stays flat or goes down, you may lose the premium.
Now, depending on whether you buy or sell Calls/Puts, you can build hundreds of strategies.
Why Traders Use Options
Options are powerful because they can serve three main purposes:
Hedging – Protecting an existing portfolio from adverse price moves.
Example: A long-term investor holding Infosys shares may buy a Put option to protect against a fall.
Speculation – Betting on market direction with limited capital.
Example: Buying a Call if you expect bullish momentum.
Income Generation – Selling options to collect premium regularly.
Example: Writing Covered Calls on stocks you own.
The same instrument (options) can be used very differently by traders with different goals. That’s why strategies matter.
ICICIBANK

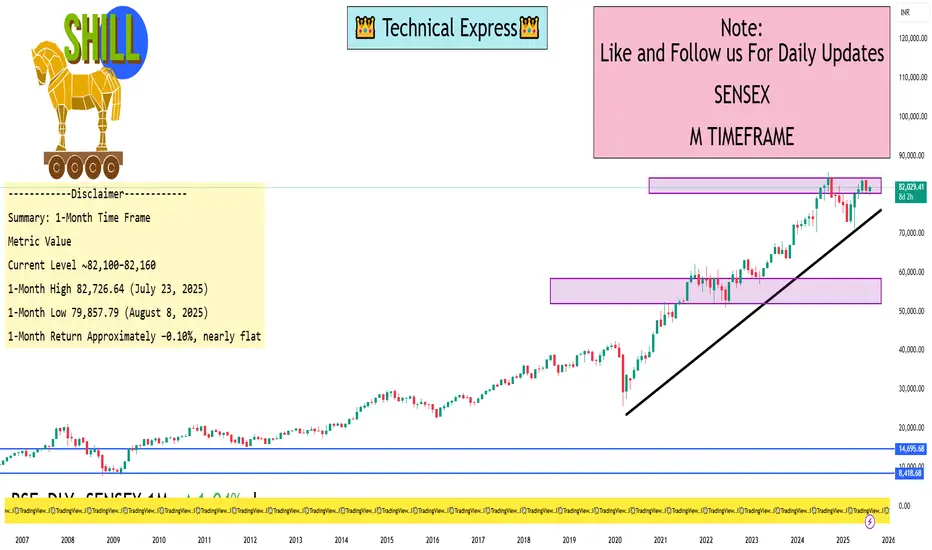
Sensex 1 Month ViewCurrent level: Approximately 82,120–82,160, based on multiple real-time data sources:
82,098.70 (Investing.com)
82,120.55 (Moneycontrol)
One-Month Range & Performance (July 21 – August 21, 2025)
From Investing.com’s detailed historical series:
High (July 23): 82,726.64
Low (August 8): 79,857.79
As for return over the 1-month period:
TradingEconomics reports a –0.10% change
Moneycontrol reports returns of –0.10% for 1 month as well
Summary: 1-Month Time Frame
Metric Value
Current Level ~82,100–82,160
1-Month High 82,726.64 (July 23, 2025)
1-Month Low 79,857.79 (August 8, 2025)
1-Month Return Approximately –0.10%, nearly flat
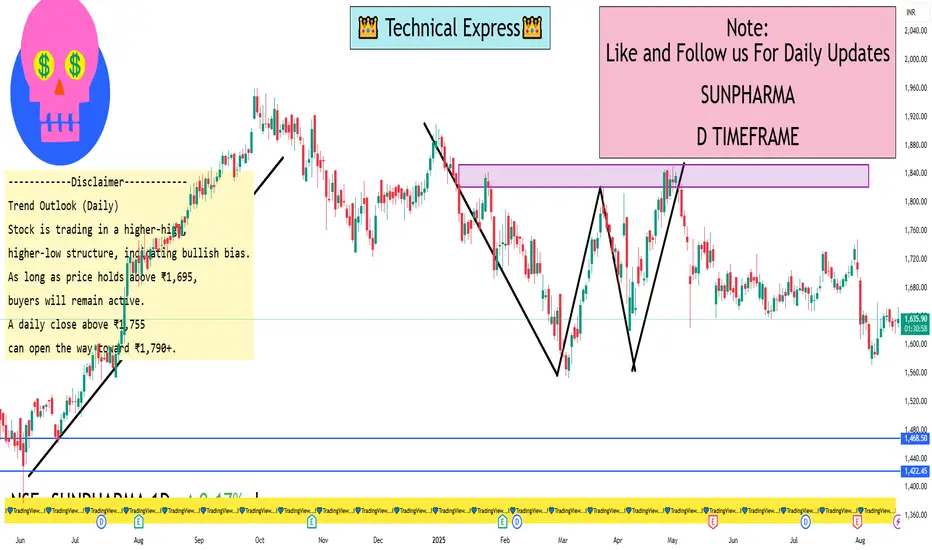
Sunpharma 1 day ViewSun Pharma – Daily Chart Levels
Immediate Resistance: ₹1,745 – ₹1,755
Major Resistance Zone: ₹1,790 – ₹1,810 (breakout zone for further rally)
Immediate Support: ₹1,705 – ₹1,695
Strong Support Zone: ₹1,660 – ₹1,650
Trend Outlook (Daily)
Stock is trading in a higher-high, higher-low structure, indicating bullish bias.
As long as price holds above ₹1,695, buyers will remain active.
A daily close above ₹1,755 can open the way toward ₹1,790+.
A break below ₹1,695 may bring downside toward ₹1,660.
Part 2 Trading Master Class Advantages of Option Trading
Leverage – Small capital controls large positions.
Flexibility – Strategies for any market condition.
Defined Risk (for buyers) – Maximum loss = premium.
Hedging Tool – Protects portfolios from crashes.
Income Generation – Through selling options (covered calls, spreads).
Risks in Option Trading
Time Decay – Value erodes quickly near expiry.
Unlimited Loss for Sellers – Naked option selling is very risky.
Volatility Crush – After events like results, volatility falls and option premiums collapse.
Liquidity Risk – Some contracts are illiquid, making exit difficult.
Psychological Stress – Options move very fast; requires discipline.

Part 1 Trading Master Class Types of Option Strategies
Options allow traders to design strategies based on market view—bullish, bearish, or neutral. Some popular strategies:
A. Bullish Strategies
Long Call – Buy a call option to profit from price rise.
Bull Call Spread – Buy lower strike call, sell higher strike call to reduce cost.
Synthetic Long – Buy call + sell put = behaves like futures long.
B. Bearish Strategies
Long Put – Buy a put option to profit from fall.
Bear Put Spread – Buy higher strike put, sell lower strike put.
Synthetic Short – Sell call + buy put = behaves like futures short.
C. Neutral/Sideways Strategies
Straddle – Buy call and put at same strike (profit from volatility).
Strangle – Buy call and put at different strikes (cheaper than straddle).
Iron Condor – Sell OTM call & put, buy further OTM call & put (profit from low volatility).
D. Income/Theta Strategies
Covered Call – Hold stock + sell call option for extra income.
Cash-Secured Put – Sell put option while keeping cash aside to buy stock if assigned.

Option Trading Option Greeks – The Core of Option Pricing
Options are complex instruments whose prices change with many factors. To understand price behavior, traders rely on Option Greeks.
Delta (Δ)
Measures sensitivity of option price to underlying asset movement.
Call delta ranges 0 to +1; Put delta ranges 0 to -1.
Example: If Delta = 0.5, a ₹10 stock move increases option price by ₹5.
Theta (Θ)
Time decay. Options lose value as expiry approaches.
Bad for buyers, good for sellers.
Vega (ν)
Sensitivity to volatility. Higher volatility increases option premium.
Gamma (Γ)
Measures change in Delta when the stock price moves.
Rho (ρ)
Sensitivity to interest rate changes (less relevant in short-term trading).
👉 Mastering Greeks is key for professional option traders because they help predict how option premiums will behave under changing conditions.

PCR Trading How Option Trading Works
Let’s simplify with an example:
Stock Price: ₹1000
Call Option Strike: ₹1050
Premium: ₹20
Lot Size: 100 shares
If you buy the call option:
Break-even = Strike Price + Premium = ₹1070
If stock goes to ₹1100 → Profit = (1100-1050-20) × 100 = ₹3000
If stock stays below ₹1050 → You lose only the premium = ₹2000
If you sell (write) the call option:
You collect ₹2000 premium upfront.
If stock stays below 1050, you keep the entire premium as profit.
But if stock goes to ₹1100, you face unlimited loss: (1100-1050-20) × 100 = -₹3000.
👉 This shows: Option buyers have limited risk but unlimited profit potential, while sellers have limited profit but unlimited risk.

Divergence SecretsKey Terminologies in Option Trading
Before diving deep, let’s understand some essential terms:
Call Option: A contract that gives the buyer the right (but not the obligation) to buy an asset at the strike price before expiry.
Example: Buying a Reliance ₹2500 Call Option means you can buy Reliance shares at ₹2500 even if the market price rises to ₹2700.
Put Option: A contract that gives the buyer the right (but not the obligation) to sell an asset at the strike price before expiry.
Example: Buying a Nifty 19000 Put Option means you can sell Nifty at 19000 even if the market falls to 18500.
Premium: The price paid to buy the option contract.
Example: If a Nifty 20000 Call is trading at ₹150, that ₹150 is the premium.
Strike Price: The pre-decided price at which the option can be exercised.
Expiry Date: The last date on which the option contract is valid.
In-the-Money (ITM): Option that already has intrinsic value.
Example: Nifty at 20000 → 19500 Call is ITM.
Out-of-the-Money (OTM): Option that has no intrinsic value (only time value).
Example: Nifty at 20000 → 21000 Call is OTM.
At-the-Money (ATM): Option strike price is closest to current market price.
Lot Size: Options are traded in predefined lot sizes, not single shares.
Example: Bank Nifty option lot size = 15 units (as per 2025 rules).
Option Chain: A tabular representation showing available strikes, premiums, open interest, etc. for calls and puts.

Part 2 Support And ResistanceWhy Options Exist?
Options exist to manage risk and to create trading opportunities. Think of them as financial insurance. Just like you pay a premium for car insurance to protect against damage, in options trading, investors pay a premium to protect themselves against adverse price moves.
For Hedgers: Options act as insurance. A stock investor can buy a put option to protect his portfolio if the market falls.
For Speculators: Options provide leverage. With small capital, traders can take large directional bets.
For Arbitrageurs: Options open opportunities to exploit price inefficiencies between the spot, futures, and options markets.
Key Terminologies in Option Trading
Before diving deep, let’s understand some essential terms:
Call Option: A contract that gives the buyer the right (but not the obligation) to buy an asset at the strike price before expiry.
Example: Buying a Reliance ₹2500 Call Option means you can buy Reliance shares at ₹2500 even if the market price rises to ₹2700.
Put Option: A contract that gives the buyer the right (but not the obligation) to sell an asset at the strike price before expiry.
Example: Buying a Nifty 19000 Put Option means you can sell Nifty at 19000 even if the market falls to 18500.
Premium: The price paid to buy the option contract.
Example: If a Nifty 20000 Call is trading at ₹150, that ₹150 is the premium.
Strike Price: The pre-decided price at which the option can be exercised.
Expiry Date: The last date on which the option contract is valid.
In-the-Money (ITM): Option that already has intrinsic value.
Example: Nifty at 20000 → 19500 Call is ITM.
Out-of-the-Money (OTM): Option that has no intrinsic value (only time value).
Example: Nifty at 20000 → 21000 Call is OTM.
At-the-Money (ATM): Option strike price is closest to current market price.
Lot Size: Options are traded in predefined lot sizes, not single shares.
Example: Bank Nifty option lot size = 15 units (as per 2025 rules).
Option Chain: A tabular representation showing available strikes, premiums, open interest, etc. for calls and puts.

Day Trading Techniques1. Introduction to Day Trading
Day trading is one of the most exciting and challenging forms of trading in the financial markets. Unlike long-term investors who hold stocks for months or years, day traders aim to open and close trades within the same trading session. The idea is to capitalize on intraday price movements, whether they are tiny scalps of a few seconds or larger moves over a few hours.
Day trading requires speed, precision, and discipline. It’s not just about clicking buy and sell—it’s about having a structured approach, using the right techniques, and applying strict risk management rules.
Some of the biggest advantages of day trading include:
No overnight risk (you close positions the same day).
Frequent opportunities due to constant price fluctuations.
Ability to compound profits quickly.
But there are also challenges:
High stress and fast decision-making.
Need for strong technical knowledge.
Risk of large losses if discipline is weak.
Now, let’s dive into the core principles that govern successful day trading.
2. Core Principles of Day Trading
Before learning the techniques, every day trader must master these principles:
a) Liquidity
Choose highly liquid stocks or instruments (e.g., Nifty, Bank Nifty, top NSE stocks, S&P500, EUR/USD forex pair) so that you can enter and exit quickly without much slippage.
b) Volatility
Day traders thrive on price volatility. Without movement, there’s no profit. Stocks with daily volatility above 2-3% are ideal.
c) Timeframes
Most day traders use 1-minute, 5-minute, and 15-minute charts for entries, while higher timeframes (30-min, hourly) help in understanding the bigger trend.
d) Risk-Reward Ratio
A golden rule is never to risk more than 1-2% of capital on a single trade. Good setups should ideally have a risk-reward ratio of 1:2 or higher.
e) Discipline
Consistency matters more than one big win. Even professional traders lose trades daily, but their discipline helps them win over the long run.
3. Popular Day Trading Techniques
Now let’s discuss the main strategies and techniques used by day traders:
3.1 Scalping
Scalping is the fastest form of day trading, where traders take multiple trades within seconds or minutes. The goal is to profit from tiny price movements.
Example: Buying Nifty Futures at 24,500.50 and selling at 24,502.00 for a small 1.5-point gain, repeated multiple times.
Tools: 1-min chart, VWAP, Level 2 order book.
Best Suited For: Highly liquid markets (Bank Nifty, Nasdaq, EUR/USD).
Pros: High frequency, quick profits.
Cons: Stressful, requires excellent execution speed.
3.2 Momentum Trading
Momentum traders look for strong moves backed by high volume and ride the trend until momentum weakens.
Example: A stock breaking 5% up with strong volume after positive earnings, and you ride it for another 3-4%.
Tools: RSI, MACD, VWAP, Volume Profile.
Best Suited For: Trending markets.
Pros: Large profits in trending conditions.
Cons: Risk of sudden reversals.
3.3 Breakout Trading
Breakout traders wait for a key support/resistance level to break with volume. They enter in the direction of the breakout.
Example: Reliance stuck between ₹2,900–₹3,000 for hours, then breaking ₹3,000 with high volume → buy for upside momentum.
Tools: Bollinger Bands, Volume analysis, Price Action.
Best Suited For: Stocks consolidating before big moves.
Pros: High reward trades if trend follows through.
Cons: Fake breakouts (false signals).
3.4 Reversal Trading
Reversal trading involves spotting exhaustion in a trend and betting against it.
Example: Bank Nifty rallies from 50,000 → 50,800, forms a double top, RSI diverges → short for pullback to 50,500.
Tools: RSI divergence, Candlestick patterns (hammer, shooting star).
Best Suited For: Overextended moves.
Pros: Excellent risk-reward (small risk, large reward).
Cons: Dangerous if trend continues.
3.5 Range-Bound Trading
Some stocks don’t trend—they move sideways. Traders exploit this by buying at support and selling at resistance.
Example: HDFC Bank bouncing between ₹1,600–₹1,620. Buy near ₹1,600, sell at ₹1,620.
Tools: RSI, Bollinger Bands, Pivot Points.
Best Suited For: Low-volatility phases.
Pros: Works well in sideways markets.
Cons: Breakouts can cause losses.
3.6 News-Based Trading
Markets react violently to news—earnings, economic data, government policies, mergers. News traders take positions immediately after such events.
Example: RBI cuts repo rate unexpectedly → banking stocks rally → enter quickly for intraday gains.
Tools: Live news feeds, Economic calendar.
Best Suited For: High-impact events.
Pros: Big profits in minutes.
Cons: Extremely risky if market overreacts.
3.7 Tape Reading & Order Flow
This old-school technique uses the order book and time & sales data to judge buying/selling pressure.
Example: Sudden increase in bid size at support level → sign of accumulation → go long.
Tools: DOM (Depth of Market), Footprint charts.
Best Suited For: Professional scalpers.
3.8 Algorithmic & Quantitative Day Trading
Algo traders use automated systems and mathematical models to scalp or trade intraday moves.
Example: A mean-reversion algo that buys when RSI < 20 and sells when RSI > 80.
Tools: Python, TradingView Pine Script, MT5 bots.
Best Suited For: Traders with coding/quant skills.
4. Technical Tools for Day Trading
Some essential indicators and tools:
VWAP (Volume Weighted Average Price): Institutional benchmark, used for intraday trend bias.
Moving Averages (EMA 9/20/50): Short-term trend signals.
RSI & MACD: Momentum indicators.
Volume Profile: Shows price levels where heavy trading occurred.
Candlestick Patterns: Pin bars, engulfing candles for entries/exits.
Pivot Points & Fibonacci: Intraday support/resistance.
5. Risk Management & Position Sizing
Without risk control, even the best technique fails. Key rules:
Never risk more than 1-2% of total capital per trade.
Use stop-loss orders strictly.
Apply position sizing formulas based on account size.
Keep risk-reward ratio > 1:2.
6. Trading Psychology
Day trading success is 80% psychology, 20% strategy.
Control emotions—fear and greed kill traders.
Don’t overtrade after losses (revenge trading).
Accept that losses are part of the game.
Stay patient and wait for A+ setups.
7. Practical Example Walkthrough
Imagine you’re day trading Infosys on results day:
Stock opens at ₹1,500, rallies to ₹1,540 with strong volume.
You spot momentum buildup and enter long at ₹1,542.
Place stop-loss at ₹1,530 (12 points risk).
Target ₹1,566 (24 points reward).
Stock hits ₹1,566 → you book profits → 1:2 risk-reward achieved.
This is how disciplined execution works.
8. Common Mistakes in Day Trading
Over-leveraging with margins.
Ignoring stop-loss.
Trading low-volume illiquid stocks.
Following tips blindly.
Emotional decision-making.
9. Advanced Tips & Best Practices
Trade only 2–3 best setups per day.
Maintain a trading journal to track progress.
Specialize in a few instruments instead of chasing everything.
Use hotkeys and advanced charting software for speed.
Always review trades post-market.
10. Conclusion
Day trading is a thrilling but demanding profession. The right combination of techniques, discipline, risk management, and psychology is what separates winners from losers.
Whether you prefer scalping, momentum trading, or breakouts—the key lies in sticking to a plan, managing risk, and learning continuously. Success in day trading doesn’t come overnight—it’s a journey of skill, patience, and persistence.

Fundamental Analysis vs Technical Analysis: Which Strategy Wins?Introduction
In the world of stock market investing and trading, two schools of thought dominate: Fundamental Analysis (FA) and Technical Analysis (TA). Both approaches aim to answer the same question — “Should I buy, hold, or sell this stock?” — but they take entirely different paths to reach their conclusion.
Fundamental analysis focuses on the business behind the stock: revenues, profits, assets, management quality, industry position, and future growth potential.
Technical analysis focuses on the stock’s price and volume behavior, studying patterns and trends to predict short-term and long-term movements.
This debate has existed for decades, with investors like Warren Buffett standing firmly on the side of fundamentals, and traders like Paul Tudor Jones thriving on technicals. But in reality, the answer to “which strategy wins” is more nuanced.
In this guide, we’ll break down both approaches in detail, compare their strengths and weaknesses, and analyze which one works better in different market contexts.
Part 1: Understanding Fundamental Analysis
What is Fundamental Analysis?
Fundamental Analysis (FA) is the study of a company’s intrinsic value. The idea is simple: every stock has a “true worth,” and if its current market price is lower than this intrinsic value, it’s undervalued (a buying opportunity). Conversely, if the market price is higher, it’s overvalued (a selling or shorting opportunity).
Key Components of FA
Financial Statements
Income Statement (profit & loss) → Are revenues and profits growing?
Balance Sheet → Does the company have too much debt?
Cash Flow Statement → Is the company generating real cash or just accounting profits?
Ratios & Metrics
P/E Ratio (Price-to-Earnings) – How much are investors willing to pay for each unit of earnings?
P/B Ratio (Price-to-Book) – Is the stock valued fairly compared to assets?
ROE (Return on Equity) – How efficiently is management using investor capital?
Debt-to-Equity – Is the company financially stable?
Qualitative Factors
Management quality
Competitive advantage (moat)
Industry trends
Government policies and regulations
Macroeconomic Factors
Inflation, interest rates, GDP growth
Global economic conditions
Sectoral growth trends
Example of Fundamental Analysis in Action
Imagine you’re analyzing Infosys.
Revenue and profits have been steadily growing.
P/E ratio is lower than peers like TCS and Wipro.
Strong cash flows, low debt, high ROE.
The IT industry is expected to grow as global businesses continue digital transformation.
Conclusion: Infosys is fundamentally strong, and if its stock is trading at a reasonable valuation, it may be a good long-term buy.
Part 2: Understanding Technical Analysis
What is Technical Analysis?
Technical Analysis (TA) studies price and volume patterns on stock charts to predict future movements. The underlying belief is that “Price reflects everything” — all news, fundamentals, and emotions are already priced into the stock. Thus, by studying charts, traders can anticipate where the price will move next.
Key Components of TA
Price Charts
Line charts, candlestick charts, bar charts
Trends
Uptrend (higher highs, higher lows)
Downtrend (lower highs, lower lows)
Sideways (range-bound)
Support & Resistance Levels
Support = a price level where demand is strong enough to stop decline
Resistance = a level where selling pressure stops price rise
Technical Indicators
Moving Averages (MA, EMA) – Identify trend direction
RSI (Relative Strength Index) – Measures overbought/oversold conditions
MACD (Moving Average Convergence Divergence) – Identifies momentum shifts
Bollinger Bands – Measures volatility and breakout possibilities
Chart Patterns
Head & Shoulders, Double Top, Cup & Handle, Triangles, Flags, etc.
Volume Analysis
Rising price + high volume = strong bullish confirmation
Falling price + high volume = strong bearish confirmation
Example of Technical Analysis in Action
Suppose Reliance Industries is trading at ₹2,500.
The stock has formed strong support at ₹2,450 and resistance at ₹2,600.
RSI shows it’s oversold near 30, suggesting a bounce.
Volume spikes confirm buying interest.
A candlestick reversal pattern (hammer) forms near support.
Conclusion: Reliance may bounce from ₹2,450 towards ₹2,600 in the short term, making it a good trading opportunity.
Part 3: Key Differences Between FA and TA
Aspect Fundamental Analysis Technical Analysis
Focus Business, financials, valuation Price, volume, market psychology
Timeframe Long-term investing (months to years) Short to medium-term trading (minutes to weeks)
Tools Balance sheet, ratios, economy, management analysis Charts, indicators, patterns, support/resistance
Philosophy “Buy good businesses at the right price” “Price discounts everything; trends repeat”
Users Investors, value investors, mutual funds Traders, swing traders, day traders, scalpers
Strengths Identifies undervalued stocks for wealth creation Captures quick moves for profit
Weaknesses Slow, doesn’t time entries well May give false signals, ignores fundamentals
Part 4: Strengths & Weaknesses of Each Approach
Strengths of FA
Helps identify multi-bagger stocks (e.g., Infosys, HDFC Bank, Asian Paints).
Provides long-term conviction, reducing panic selling.
Focuses on wealth creation rather than just trading gains.
Weaknesses of FA
Doesn’t provide precise entry/exit timing.
Market can stay irrational for long (undervalued stocks may stay undervalued).
Requires deep knowledge of finance and economics.
Strengths of TA
Provides timing precision (when to buy/sell).
Useful for short-term profits.
Works in any market — stocks, forex, commodities, crypto.
Weaknesses of TA
Can be subjective (two traders may interpret the same chart differently).
False signals are common.
Doesn’t consider company fundamentals — risky if used blindly.
Part 5: Which Strategy Wins?
The answer isn’t either/or. The real winners are those who know when to use which approach.
For Long-Term Investors
FA is the primary tool.
Example: Warren Buffett uses fundamentals to identify businesses that will compound wealth over decades.
For Short-Term Traders
TA is more effective.
Example: Day traders and swing traders rely on charts, not balance sheets.
For Hybrid Investors (Best of Both Worlds)
The most successful investors often combine both.
Example: Buy fundamentally strong companies (FA) and use TA for better entry/exit timing.
Part 6: Real-Life Examples
Amazon (FA Winner): In 2001, Amazon was loss-making, but fundamental believers in e-commerce saw potential. Long-term holders became millionaires.
Tesla (FA + TA): Initially, Tesla looked overvalued by fundamentals, but TA showed strong momentum and trend-following traders made massive gains.
Yes Bank (FA Ignored): Many traders made profits using TA in short-term swings, but long-term FA showed cracks in fundamentals, leading to eventual collapse.
Part 7: Market Conditions – Who Wins When?
Bull Market → Both FA and TA work. FA finds strong companies, TA helps ride the trend.
Bear Market → TA is more useful for risk management. FA may trap investors in “value traps.”
Sideways Market → TA is superior as it identifies range-bound trades.
Post-Crash Recovery → FA wins by identifying undervalued gems for long-term recovery.
Conclusion
The debate of Fundamental Analysis vs Technical Analysis isn’t about which is superior, but about which fits your goals, personality, and timeframe.
If you want to build long-term wealth → Go with Fundamental Analysis.
If you want to make short-term profits → Technical Analysis is your tool.
If you want the best of both worlds → Combine FA + TA.
Ultimately, markets reward not those who argue which strategy is better, but those who apply the right strategy at the right time.
Part 3 Learn Institutional TradingCall Options & Put Options Explained
Options are of two types:
🔹 Call Option
Gives the right to buy an asset at a fixed price.
Buyers of call options are bullish (expect prices to rise).
👉 Example:
If Nifty is at 22,000 and you buy a 22,100 Call Option for ₹100 premium, you pay ₹100 × lot size (say 50) = ₹5,000.
If Nifty rises to 22,400, the 22,100 call is worth 300 points. Profit = (300 - 100) × 50 = ₹10,000.
If Nifty stays below 22,100, you lose only the premium ₹5,000.
🔹 Put Option
Gives the right to sell an asset at a fixed price.
Buyers of put options are bearish (expect prices to fall).
👉 Example:
If Bank Nifty is at 48,000 and you buy a 47,800 Put for ₹200 premium, lot size = 15.
If Bank Nifty falls to 47,000, option value = 800 points. Profit = (800 - 200) × 15 = ₹9,000.
If Bank Nifty stays above 47,800, you lose only premium = ₹3,000.
So:
Call = Bullish bet.
Put = Bearish bet.

Momentum Trading Strategies1. Introduction to Momentum Trading
If you’ve ever watched a cricket match where a batsman suddenly starts hitting boundaries one after another, you’ll notice something called momentum. Once the flow begins, it often continues until something major interrupts it. The same happens in stock markets.
Momentum trading is built on a simple idea:
👉 “Stocks that are moving strongly in one direction are likely to keep moving in that direction—at least for a while.”
In trading, momentum is like catching a moving train. Instead of trying to guess where the train will start or stop, you jump on when it’s already moving. Unlike long-term investing, where you analyze fundamentals deeply, momentum trading is more about riding the wave created by news, earnings, emotions, or institutional flows.
For example:
If Reliance stock is up 8% today on strong earnings and massive volume, a momentum trader might buy in, expecting further upside tomorrow or over the next week.
If crude oil prices fall sharply, a momentum trader might short oil stocks, assuming more selling pressure will follow.
So momentum trading isn’t about predicting the future—it’s about following what’s already happening.
2. The Psychology Behind Momentum
Markets are not purely logical. They are driven by human behavior—fear, greed, and herd mentality. Momentum thrives on these psychological forces:
Herd Behavior – When people see a stock rising, they rush in, fearing they’ll miss out (FOMO). This buying creates more buying.
Confirmation Bias – Traders look for news or charts that confirm their belief, reinforcing the trend.
Fear of Loss – When prices fall, investors panic and sell, creating downward momentum.
Overreaction – Markets often overreact to news—both positive and negative. Momentum traders exploit this by catching the exaggerated moves.
That’s why momentum works: people chase winners and dump losers.
3. Core Principles of Momentum Trading
To really get momentum trading, let’s simplify it into a few golden rules:
The Trend is Your Friend – Don’t fight against the flow. If Nifty is trending up with strong breadth, focus on long trades.
Volume Confirms Momentum – Price alone is not enough. A move backed by high trading volume signals real strength.
Momentum Has a Shelf Life – No stock rises forever. Momentum fades when buyers lose energy. So, entry and exit timing is crucial.
Relative Strength Matters – Stronger stocks outperform weaker ones, especially in bull markets. Momentum traders prefer leaders, not laggards.
Risk is Key – Since momentum can reverse sharply, strict stop-loss discipline is non-negotiable.
Think of momentum like surfing. You don’t control the wave—you just ride it until it fades, then exit before it crashes.
4. Popular Momentum Trading Strategies
Momentum isn’t one single style—it’s a family of approaches. Let’s explore the most widely used ones:
4.1 Breakout Trading
This is the classic momentum method. Traders wait for a stock to break above resistance or below support with strong volume.
Example:
Stock X is stuck between ₹100–₹110 for weeks.
Suddenly, it breaks above ₹110 with huge volume.
A momentum trader buys here, expecting ₹120, ₹125, or higher.
The psychology? Breakouts attract fresh buyers, and shorts are forced to cover—fueling momentum.
4.2 Moving Average Crossover Strategy
Traders use moving averages (like 20-day, 50-day, 200-day) to capture momentum.
If a short-term average (20-day) crosses above a longer one (50-day), it signals upward momentum.
If it crosses below, it signals downward momentum.
This strategy filters noise and captures medium-term trends.
4.3 Relative Strength Strategy
Momentum traders often compare how a stock is performing relative to the overall market or sector.
Example:
Nifty is up 1%, but Stock A is up 6%.
That relative strength suggests momentum, making Stock A a candidate for long trades.
The reverse works for shorting weak stocks in a weak market.
4.4 Intraday Momentum Scalping
Some traders capture quick bursts of momentum within minutes or hours. They trade news, economic data releases, or sudden volume spikes.
For instance, if Infosys announces strong guidance at 10 AM, intraday momentum traders jump in for a 2–3% move before it cools off.
4.5 News & Earnings-Based Momentum
Earnings season is a goldmine for momentum traders. Positive surprises often create upward momentum; negative surprises trigger downward spirals.
Example:
Company beats earnings estimates → stock gaps up 10%.
Traders buy expecting continued demand from institutions.
This “post-earnings drift” is a classic momentum phenomenon.
4.6 Sector Rotation Momentum
Big money often flows into specific sectors (IT, Banks, Pharma) during different phases of the economy.
Momentum traders ride the hot sector until it cools.
Example:
When RBI cuts rates, banking stocks rally for weeks.
A trader focuses on the strongest banks instead of random picks.
5. Technical Indicators Used in Momentum
Momentum trading heavily relies on technical analysis. Some widely used tools:
Relative Strength Index (RSI) – Measures speed of price movements. Above 70 = overbought, below 30 = oversold.
Moving Average Convergence Divergence (MACD) – Tracks trend strength using moving averages.
Rate of Change (ROC) – Calculates % change in price over a period.
Volume Indicators (OBV, VWAP) – Confirm if price moves are supported by volume.
Bollinger Bands – Help spot volatility and potential momentum breakouts.
These are not perfect, but they guide entry/exit decisions.
6. Risk Management in Momentum Trading
Momentum can be rewarding but also dangerous because reversals are sudden. To survive, traders follow strict rules:
Stop-Loss Orders – Never trade without a predefined exit point.
Position Sizing – Don’t put all capital in one trade. Risk 1–2% per trade.
Avoid Overnight Risk (for intraday) – News or global events can reverse momentum overnight.
Don’t Chase Too Late – Entering after a huge move often results in buying the top.
Take Partial Profits – Lock in gains as momentum matures.
Think of risk management as your seatbelt—it won’t prevent the accident, but it can save your life.
7. Real-Life Examples of Momentum Trading
Example 1: Adani Enterprises 2020–2022
Adani stocks had a massive rally driven by infrastructure growth stories. Traders who identified the breakout early rode the multi-month momentum.
Example 2: Tesla in the US
Tesla stock in 2020–21 was a momentum trader’s dream—surging 10x in months. Technical breakouts plus EV hype created sustained momentum.
Example 3: COVID Crash & Recovery (2020)
Markets fell sharply in March 2020. Momentum traders shorted stocks during the fall. Then, when recovery began, they switched sides and rode the rally.
8. Advantages and Challenges
Advantages
Quick profits in short time.
Works in both rising and falling markets.
Backed by psychology and herd behavior.
Flexible—can be applied intraday, swing, or positional.
Challenges
Momentum is short-lived; timing is tricky.
False breakouts can trap traders.
High emotional stress due to volatility.
Requires constant monitoring—can’t be passive.
9. Tips for Traders
Trade only liquid stocks—avoid low-volume traps.
Combine momentum with fundamentals for stronger conviction.
Don’t overtrade; wait for clear setups.
Learn to exit gracefully—don’t wait for the last rupee.
Keep a trading journal to track what worked and what didn’t.
10. Conclusion
Momentum trading is like riding waves in the ocean—you don’t create the wave, you just ride it skillfully. It’s about speed, timing, and discipline. Done well, it can be one of the most profitable trading styles. Done poorly, it can wipe out accounts.
The key is to remember:
Follow the trend, not emotions.
Risk management is more important than entries.
Momentum is temporary—treat it like an opportunity, not a guarantee.
If investing is like planting a tree, momentum trading is like harvesting fruits quickly when they’re ripe. Both can make money, but momentum needs sharper focus and faster decisions.
India Growth SupercycleIntroduction: What is a Growth Supercycle?
A “growth supercycle” refers to a prolonged period—often spanning decades—when a country or region experiences sustained economic expansion driven by structural changes. It’s not just about one or two years of high GDP growth; rather, it’s a long-term trend powered by deep forces like demographics, industrialization, urbanization, rising consumption, technological adoption, and capital inflows.
History has shown us examples:
The US in the 20th century, after World War II.
Japan from the 1950s to 1980s.
China from the 1990s to 2010s, where hundreds of millions moved out of poverty into middle-class prosperity.
Now, global investors and economists believe India is entering its own multi-decade growth supercycle. With a young population, expanding middle class, strong reforms, and growing global relevance, India is being compared to China in the 2000s—but with its own unique advantages and challenges.
Chapter 1: India’s Growth Journey So Far
India’s path to its current stage has been gradual but consistent:
1. Pre-Liberalization Era (1947–1991)
India gained independence in 1947 and adopted a planned economy with state control over industries, foreign trade, and capital flows.
Growth averaged only 3–4% per year (famously called the “Hindu rate of growth”).
Limited global integration, bureaucratic hurdles, and a heavy public sector slowed momentum.
2. Liberalization Reforms (1991–2000s)
In 1991, a balance of payments crisis forced India to open up its economy.
Reforms under PM P.V. Narasimha Rao and Finance Minister Dr. Manmohan Singh:
Deregulation of industries.
Reduction in tariffs and import restrictions.
Encouragement of private sector participation.
Growth accelerated to 6–7% annually.
3. IT & Services Boom (2000s)
India emerged as the world’s IT outsourcing hub.
Cities like Bengaluru, Hyderabad, and Pune became global tech centers.
Services contributed heavily to GDP; exports boomed.
Growth averaged 7–8%.
4. The Current Era (2014–present)
Reforms like GST, Insolvency & Bankruptcy Code, digitization push, UPI payments, startup ecosystem.
Government focus on Make in India, manufacturing, infrastructure, renewable energy.
Despite global shocks (COVID, Ukraine war, inflation), India maintained one of the highest GDP growth rates globally.
Chapter 2: The Key Drivers of India’s Growth Supercycle
Now let’s look at the forces that will drive India’s rise over the next two to three decades.
1. Demographic Dividend
India has a median age of just 28 years (vs. 38 in the US, 39 in China, 48 in Japan).
Over 65% of the population is below 35.
Each year, 12 million people join the workforce.
A young, working-age population boosts productivity, consumption, and innovation.
Contrast: China and developed economies face aging populations.
2. Rising Middle Class & Consumption
India’s middle class is expected to reach 500 million+ by 2035.
Growing income levels mean more spending on:
Consumer goods
Housing
Automobiles
Travel & lifestyle
Healthcare & education
India is shifting from basic survival consumption (food, shelter) to aspirational consumption (gadgets, cars, brands).
3. Urbanization & Infrastructure
Currently, only 36% of Indians live in cities (vs. 60% in China).
By 2040, 50%+ will be urban.
This will drive:
Construction of smart cities.
Demand for housing, roads, metro rail, airports, and logistics.
Real estate boom.
Infrastructure push: Highways, bullet trains, ports, digital infrastructure.
4. Digital Transformation
India is the world’s fastest-growing digital economy.
Over 850 million internet users.
UPI digital payments leading globally—more transactions than US + China combined.
IndiaStack & Aadhaar enabling financial inclusion.
Growth in AI, e-commerce, fintech, edtech, healthtech.
5. Manufacturing & “China+1” Opportunity
Global companies are diversifying supply chains beyond China.
India has become a preferred alternative due to:
Large labor force.
Government incentives (PLI schemes).
Stable democracy.
Sectors gaining: electronics, semiconductors, EVs, defense, textiles.
6. Global Investments & FDI
Foreign Direct Investment (FDI) inflows hitting records.
Global investors see India as a long-term growth story.
Stock markets reflecting optimism: India is now the 5th largest equity market in the world.
7. Energy & Sustainability Transition
India is targeting net-zero by 2070.
Massive investments in solar, wind, hydrogen energy.
India is also positioning itself as a leader in green tech.
Chapter 3: Sectors Benefiting from the Supercycle
The growth story won’t be uniform—some sectors will be the biggest beneficiaries:
Banking & Financial Services – Rising credit demand, digital banking, financial inclusion.
Infrastructure & Real Estate – Roads, airports, housing, smart cities.
Technology & Digital – IT services, startups, AI, SaaS, e-commerce.
Manufacturing & Exports – Electronics, pharma, textiles, defense.
Energy & Renewables – Solar, hydrogen, EV ecosystem.
Healthcare & Education – Expanding middle class driving quality demand.
Consumer & Retail – FMCG, automobiles, premium lifestyle products.
Chapter 4: Risks & Challenges
No growth story is without challenges. For India, the supercycle path will face hurdles:
Job Creation – 12 million youth enter workforce yearly; quality jobs are needed.
Income Inequality – Urban-rural divide may widen.
Infrastructure Gaps – Speed of execution must match growth.
Geopolitical Risks – India must balance US, China, Russia relationships.
Climate Change & Resource Scarcity – Water stress, pollution, energy demands.
Policy Consistency – Reforms must be steady; bureaucratic delays could hurt.
Chapter 5: The Global Context – Why India Matters Now
The world economy is slowing down: US, Europe facing stagnation, China aging.
India is expected to contribute 15–20% of global growth in the next decade.
Global investors see India as the next growth engine.
India’s democratic setup adds stability compared to authoritarian regimes.
Chapter 6: India in 2047 – A Vision
India will celebrate 100 years of independence in 2047. By then, projections suggest:
India could be a $30–35 trillion economy (from ~$4.3 trillion today).
The largest consumer market in the world.
A hub for manufacturing, technology, and services.
A global leader in renewable energy & digital finance.
Home to the world’s largest middle class.
Conclusion: The India Growth Supercycle is Real
India’s growth is not just about GDP numbers. It is about a civilizational rise—a young nation transforming into a global powerhouse. The combination of demographics, digital adoption, manufacturing push, and global trust in India creates a unique moment in history.
Yes, challenges remain. But the long-term trajectory is clear:
India is entering a multi-decade supercycle of growth, much like the US in the 20th century and China in the 2000s.
For investors, businesses, and global policymakers, ignoring this story would mean missing the biggest growth opportunity of the 21st century.

Narrative-Based TradingIntroduction
Financial markets are often portrayed as mathematical and data-driven—filled with algorithms, technical charts, and economic models. But beneath that seemingly rational layer lies something deeply human: stories. Investors, traders, and even institutions make decisions not just on numbers but also on narratives—coherent stories that explain why markets move, why a company has potential, or why a sector is “the next big thing.”
This is the essence of Narrative-Based Trading (NBT). Instead of relying only on earnings, charts, or interest rates, traders also weigh the power of collective belief shaped through stories. Whether it’s the “AI boom,” “India growth supercycle,” “EV disruption,” or “crypto revolution,” narratives influence flows of capital.
Robert Shiller, the Nobel laureate economist, introduced the concept of Narrative Economics, where he argued that viral stories influence markets as much as fundamentals do. Traders who understand and anticipate these narratives can position themselves ahead of the crowd.
What Is Narrative-Based Trading?
Narrative-Based Trading is the strategy of identifying, interpreting, and trading financial assets based on dominant market stories that shape investor psychology.
In other words:
Markets move not only on facts but also on the stories built around those facts.
Traders who can read and ride these narratives can capture big moves.
For example:
The dot-com bubble (1999–2000) was not just about internet adoption—it was about the story that “the internet will change everything.”
The crypto boom (2017 & 2020–21) was not just about blockchain—it was about the story of “decentralized money replacing banks.”
The EV rally (2020–22) was not just about electric cars—it was about the story of “the end of fossil fuels.”
Narratives can push valuations beyond fundamentals because humans are wired to respond emotionally to stories more than to raw numbers.
The Psychology Behind Narrative-Based Trading
1. Humans Think in Stories
Cognitive science shows our brains are wired to understand information in the form of narratives. We remember stories far more easily than spreadsheets.
For instance:
Saying “AI will take over jobs and revolutionize industries” excites emotions more than “AI companies’ CAGR is 14%.”
That emotional excitement fuels buying pressure.
2. Fear of Missing Out (FOMO)
Narratives spread like memes. Once everyone believes “EV is the future,” investors don’t want to miss the ride. This collective enthusiasm drives prices higher—even when fundamentals lag.
3. Confirmation Bias
Investors seek stories that confirm their beliefs. If you believe India is the “next growth superpower,” you’ll look for and invest in stocks that support that story.
4. Social Proof
When big investors, influencers, or media outlets endorse a narrative, others follow—just like viral trends on social media.
Key Elements of a Market Narrative
Every powerful narrative usually contains:
A Vision of the Future – e.g., “AI will redefine industries.”
A Villain or Obstacle – e.g., “Traditional banks are outdated; DeFi will replace them.”
A Hero or Winner – e.g., “Tesla will dominate EV markets.”
An Emotional Hook – e.g., “Clean energy will save the planet.”
Simplicity – Narratives spread when they’re easy to explain.
When a story has all these elements, it spreads fast and influences prices.
Historical Examples of Narrative-Driven Markets
1. Dot-Com Bubble (1999–2000)
Narrative: “The internet will revolutionize business.”
Reality: True, but early. Many companies had no earnings, only websites.
Outcome: Nasdaq rose 400% in 5 years, then crashed 78%.
2. Bitcoin & Crypto (2017, 2020–21)
Narrative: “Decentralized money will free us from central banks.”
Reality: Blockchain has utility, but valuations were inflated by hype.
Outcome: Bitcoin rose from $1,000 → $20,000 (2017), then crashed, later reaching $69,000 in 2021.
3. Tesla & EV Mania (2019–2022)
Narrative: “The end of oil, EVs will dominate.”
Reality: EV adoption is growing, but valuations became extreme.
Outcome: Tesla’s stock went from ~$40 in 2019 → $1200 in 2021 before correcting.
4. India Growth Supercycle (2023–2025)
Narrative: “India is the next China.”
Reality: India has demographics, reforms, and digital adoption.
Outcome: Indian indices outperformed, with foreign investors pouring in.
Identifying Narratives Early
The challenge for traders is spotting a narrative before it goes mainstream. Some tools and signals include:
Media Monitoring – Watch financial news, trending topics, and CEO statements.
Social Media Sentiment – Platforms like X (Twitter), Reddit, StockTwits, YouTube often amplify narratives before mainstream media catches on.
Google Trends – Rising searches for “AI stocks” or “EV companies” show growing interest.
Options & Volume Flow – Spikes in call buying often signal retail narrative adoption.
Venture Capital Activity – If VCs are pouring billions into a sector, the narrative is building.
How to Trade Narratives
1. Early Adoption Phase
Narrative is in niche circles (forums, VC blogs).
Stocks are undervalued, only a few believers.
Strategy: Enter early, accumulate, low risk high reward.
2. Mainstream Adoption Phase
Media picks it up, retail floods in.
Stocks rally sharply.
Strategy: Ride the trend, but manage risk.
3. Euphoria Phase
Everyone is talking about it.
Valuations detach from fundamentals.
Strategy: Take profits, prepare for exit.
4. Collapse / Reality Check
Narrative cracks when fundamentals can’t keep up.
Price correction or bubble burst.
Strategy: Avoid fresh buys, short opportunities possible.
Tools and Techniques for Narrative-Based Traders
Narrative Mapping
Write down the story driving the asset.
Identify the hero (leading company/stock), villains (competitors), and catalysts (events).
Volume Profile & Market Structure
Check if the narrative is supported by actual participation.
High volume spikes = narrative adoption.
Event Tracking
Government policies, product launches, speeches, or geopolitical events can fuel narratives.
Cross-Asset Analysis
Narratives often spill over.
Example: AI narrative lifted not just Nvidia, but also cloud, chipmakers, and robotics.
Exit Framework
Always define conditions when narrative breaks.
Example: If government policy reverses, or adoption slows, exit quickly.
Risks of Narrative-Based Trading
Hype vs Reality Gap
Narratives often run far ahead of fundamentals.
Risk: Holding too long into a bubble burst.
Confirmation Bias
Traders may ignore evidence against the story.
Overcrowding
Once everyone is in, upside is limited.
Policy & Regulation
Narratives like crypto or EV subsidies depend heavily on policy support.
Short Narrative Lifespan
Some stories burn out quickly (e.g., “Metaverse” hype in 2021).
Case Study: The AI Narrative (2023–2025)
Early Stage (2022): ChatGPT launch → small AI startups gained attention.
Adoption (2023): Nvidia earnings blowout, AI “arms race” headlines.
Mainstream (2024–2025): AI became part of every investor deck.
Euphoria Signs: Even non-AI firms rebranded themselves as “AI-driven.”
Trading Strategy:
Early buyers of Nvidia, AMD, Microsoft captured 200–400% gains.
By late 2024, caution needed as valuations stretched.
Narrative vs Fundamentals vs Technicals
Fundamentals – Show “what should happen” based on earnings, cash flows.
Technicals – Show “what is happening” in price & volume.
Narratives – Show “what people believe will happen.”
The best traders combine all three:
Use narratives for trend identification.
Use technicals for timing entries/exits.
Use fundamentals for long-term conviction.
Building a Narrative-Based Trading Strategy
Scan Narratives (media, VC, policy, social buzz).
Validate with Data (Google trends, volume, institutional flows).
Select Leaders (stocks most associated with narrative).
Define Entry Point (technical confirmation).
Scale with Trend (add as narrative strengthens).
Exit with Rules (valuation excess, fading news, policy reversal).
The Future of Narrative-Based Trading
AI Tools will help detect emerging narratives via sentiment analysis.
Retail Power (Reddit, Telegram, Twitter) will keep driving viral trades.
Geopolitical Narratives (e.g., “China vs US tech war”) will grow stronger.
Sustainability & ESG Narratives (“Green transition,” “India digitalization”) will dominate long-term.
Narrative-based trading will not replace fundamentals but will remain a critical layer of market psychology.
Conclusion
Narrative-Based Trading reminds us that markets are not just numbers—they are stories we tell ourselves about the future. The most powerful stories spread, shape collective belief, and move billions of dollars.
For traders, the key is not blindly following hype but understanding when a story is gaining traction, when it’s peaking, and when reality is about to check it.
If you can learn to read market narratives like a storyteller, you can trade not just with charts and balance sheets—but with the heartbeat of the market itself.
Algo AutomationIntroduction
Trading and investing have come a long way from the days of physical stock exchanges, where brokers shouted buy and sell orders on the trading floor. Today, almost 80–90% of global market volume is generated through algorithmic trading (algo trading). In simple words, algo automation refers to the process of using computer programs, rules, and mathematical models to execute trades automatically—without human emotions interfering.
But algo automation is not just about “pressing a button and letting the computer trade.” It is a complete ecosystem that involves strategy building, coding, backtesting, optimization, execution, and risk management. From hedge funds on Wall Street to retail traders in India using platforms like Zerodha Streak or TradingView, algo automation has become an integral part of modern trading.
This article will break down algo automation in detail—covering concepts, history, strategies, benefits, risks, real-world applications, and the future.
1. What is Algo Automation?
Algo automation means creating a set of rules or instructions for the computer to follow while trading. These rules are usually based on:
Price
Volume
Technical indicators (moving averages, RSI, MACD, etc.)
Fundamental triggers (earnings announcements, balance sheet ratios)
Market events (news, interest rate changes, etc.)
Once the rules are coded into a software program, the algorithm monitors the market continuously and executes trades automatically whenever conditions are met.
Example:
Suppose you design a simple rule—
Buy Nifty futures if the 50-day moving average crosses above the 200-day moving average (Golden Cross).
Sell when the 50-day crosses below the 200-day moving average (Death Cross).
Instead of you sitting in front of the screen all day, the algorithm keeps checking and executes the trade instantly when conditions trigger.
This is algo automation in action.
2. The Evolution of Algo Automation
1970s: Early forms of program trading began in the US. Computers helped execute large orders faster.
1980s: Index arbitrage became popular—traders used algos to exploit price differences between futures and cash markets.
1990s: With better computing power, hedge funds like Renaissance Technologies used quantitative models to trade.
2000s: High-Frequency Trading (HFT) boomed, where algos executed trades in microseconds.
2010s onwards: Algo automation became available to retail traders with platforms like MetaTrader, Amibroker, NinjaTrader, Zerodha Streak, and TradingView.
Today, even small traders can run automated systems with as little as ₹10,000 capital, thanks to broker APIs and cloud-based systems.
3. Key Components of Algo Automation
Algo automation is not just about writing code. It involves several steps and components:
3.1 Strategy Development
The first step is designing the trading strategy. This can be based on:
Technical analysis (chart patterns, indicators).
Statistical models (mean reversion, pairs trading).
Event-driven models (earnings announcements, macro news).
3.2 Coding/Implementation
Once the idea is ready, it is coded into a language like:
Python
R
C++
Broker-specific scripting (like Pine Script for TradingView, AFL for Amibroker).
3.3 Backtesting
Backtesting means testing the strategy on past data to check performance. Important metrics include:
Win rate
Profit factor
Maximum drawdown
Sharpe ratio
3.4 Paper Trading
Before deploying real money, the algo is tested in live conditions without risk—this is called paper trading.
3.5 Execution Engine
The execution engine connects the algo with the broker’s API to place trades automatically. Speed and reliability are crucial here.
3.6 Risk Management
Stop-loss, position sizing, diversification, and hedging are coded into the system to control risk.
4. Types of Algo Strategies
Algo automation can power a variety of strategies:
4.1 Trend Following
Based on moving averages, breakout systems, etc.
Example: Buy when price breaks above 52-week high.
4.2 Mean Reversion
Assumes prices revert to average after deviations.
Example: Bollinger Bands reversal trades.
4.3 Arbitrage
Exploiting price differences in two markets.
Example: Spot-futures arbitrage in Nifty.
4.4 High-Frequency Trading (HFT)
Ultra-fast systems executing thousands of trades per second.
Mostly for institutions.
4.5 Market Making
Providing liquidity by quoting buy and sell prices simultaneously.
Earns the bid-ask spread.
4.6 Event-Driven
Based on news, earnings, dividend announcements.
Example: Buy ITC after strong quarterly results.
4.7 Options Algo Strategies
Automated straddle, strangle, iron condor, or hedging strategies.
Example: Deploying short straddle at specific IV levels automatically.
5. Benefits of Algo Automation
5.1 No Emotions
Humans get greedy, fearful, or impatient. Algos trade with discipline.
5.2 Speed
Execution happens in milliseconds—much faster than manual clicking.
5.3 Accuracy
No human error in entering wrong lot size or price.
5.4 Backtesting
Strategies can be tested before risking money.
5.5 Diversification
One trader can run multiple strategies across markets simultaneously.
5.6 24/7 Monitoring
Especially useful in crypto markets which never sleep.
6. Risks & Challenges of Algo Automation
While algo automation sounds attractive, it comes with risks:
6.1 Overfitting
A strategy that performs very well on past data may fail in real trading.
6.2 Technical Failures
Internet failure, broker downtime, or server crash can disrupt execution.
6.3 Slippage & Latency
In fast-moving markets, orders may not get executed at expected prices.
6.4 Regulatory Risks
In India, SEBI has strict rules for algo trading—unregistered algos may be banned.
6.5 Market Risk
No matter how advanced, if the market moves violently, algos can generate large losses quickly.
7. Algo Automation in India
Algo automation has grown rapidly in India after 2010. Initially, only institutions used it. Now retail traders have access to:
Broker APIs – Zerodha Kite Connect, Angel One SmartAPI, Upstox API.
No-Code Platforms – Streak, AlgoTest, Tradetron.
Coding-Based Platforms – Amibroker, Python libraries, NinjaTrader.
SEBI regulations require brokers to approve algos, but semi-automated retail platforms allow conditional trading without direct coding knowledge.
8. Practical Example of Algo Automation
Imagine you are a Bank Nifty options trader. You design a strategy:
Every Thursday at 9:30 AM, sell a Bank Nifty at-the-money (ATM) straddle.
Place stop-loss at 25% of premium.
Square off at 3:15 PM if stop-loss is not hit.
Now, you don’t need to sit in front of the screen. The algo will:
Identify ATM strikes.
Place sell orders.
Apply stop-loss automatically.
Exit positions at a fixed time.
This is exactly how many professional option sellers operate today.
9. Future of Algo Automation
The next decade will see AI + Algo Trading take center stage. Future trends include:
Machine Learning Models that learn from data and self-improve.
Natural Language Processing (NLP) based algos that read news headlines and trade instantly.
Cloud-Based Algo Platforms for scalability.
Crypto Algo Trading expanding globally.
Fractional and Retail Adoption – everyday investors will use plug-and-play algos just like using mutual funds.
10. Conclusion
Algo automation is revolutionizing trading. It removes emotions, adds speed, improves efficiency, and allows retail traders to compete with institutions on a smaller scale. However, it also carries risks—overfitting, technical failures, and regulatory challenges.
The smart way forward is to:
Learn basics of coding (Python or TradingView Pine Script).
Start small with paper trading.
Focus on risk management, not just profits.
Use algo automation as a tool, not a shortcut to get-rich-quick.
The future belongs to traders who combine market knowledge + technology + discipline. Algo automation is not just the future—it’s already here.

Sustainability & ESG Investing TrendsIntroduction
Over the past two decades, the financial world has experienced a massive transformation in how investments are analyzed, structured, and valued. Traditional investment strategies focused almost exclusively on financial metrics such as revenue growth, earnings per share, P/E ratios, and cash flows. But today, a new dimension has been added: Sustainability and ESG (Environmental, Social, and Governance) investing.
Investors, institutions, governments, and even retail traders are no longer looking at financial returns in isolation. They are increasingly asking:
Is this company environmentally responsible?
How does it treat its employees and communities?
Are its governance practices transparent and ethical?
This movement is more than just a trend—it represents a structural shift in how capital is allocated globally. Sustainability and ESG investing is about aligning profits with purpose. It’s about creating wealth while ensuring that companies contribute positively to society and the planet.
In this article, we’ll explore the evolution, importance, drivers, challenges, and future of sustainability & ESG investing trends, breaking it down in an easy-to-understand and comprehensive way.
1. Understanding Sustainability & ESG
What is Sustainability Investing?
Sustainability investing refers to investment strategies that prioritize companies or assets contributing to long-term environmental and social well-being. Instead of short-term financial gains, the focus is on sustainable value creation.
What is ESG Investing?
ESG stands for:
Environmental – How a company manages its environmental impact (climate change, carbon footprint, renewable energy use, waste management).
Social – How a company treats people (employees, customers, communities, human rights).
Governance – How a company is managed (board structure, executive pay, transparency, shareholder rights).
An ESG-focused investor doesn’t just look at profit margins—they also ask: Is this company ethical? Is it sustainable in the long run?
Why ESG Matters
Climate change is now a financial risk.
Consumers prefer sustainable brands.
Regulators demand transparency.
Younger investors want purpose-driven investments.
2. Evolution of ESG & Sustainability Investing
Early Stage (1960s–1980s)
The origins can be traced back to socially responsible investing (SRI), where investors avoided “sin stocks” (alcohol, tobacco, gambling, weapons).
Religious and ethical considerations played a big role.
Growth Stage (1990s–2000s)
The 1990s saw globalization and rising awareness about corporate social responsibility.
Companies began publishing sustainability reports.
The UN launched initiatives like the Principles for Responsible Investment (PRI) in 2006.
Modern Stage (2010s–2020s)
Climate change, global warming, and social justice movements accelerated ESG awareness.
The Paris Climate Agreement (2015) reinforced global commitments to sustainability.
ESG assets under management (AUM) skyrocketed to $40+ trillion globally by 2025.
3. Key Drivers of ESG & Sustainability Investing
Climate Risks – Extreme weather, rising sea levels, and resource scarcity directly affect business operations and valuations.
Consumer Preferences – Millennials and Gen Z prefer eco-friendly and socially conscious brands.
Regulations & Policies – Governments mandate disclosures (EU’s SFDR, India’s BRSR, SEC proposals in the US).
Capital Flows – Global funds and pension plans increasingly allocate capital based on ESG scores.
Corporate Reputation – Companies with poor ESG practices face backlash, loss of trust, and higher costs.
4. Global ESG Investment Trends
Trend 1: Surge in ESG Assets
As of 2025, global ESG assets are projected to cross $50 trillion, representing nearly a third of total AUM worldwide.
Europe leads the charge, followed by North America and Asia.
Trend 2: Renewable Energy Boom
Solar, wind, and green hydrogen projects attract heavy investments.
Fossil fuel divestment is accelerating.
Trend 3: ESG ETFs & Index Funds
ESG-focused exchange-traded funds (ETFs) have exploded in popularity.
Major indices like the MSCI ESG Leaders Index guide institutional investors.
Trend 4: Technology & ESG Data
AI, blockchain, and big data help assess ESG scores more transparently.
ESG rating agencies (MSCI, Sustainalytics, Refinitiv) play a growing role.
Trend 5: Green Bonds & Sustainable Financing
Green bonds (funds raised for eco-projects) have surpassed $2 trillion issuance globally.
Social bonds and sustainability-linked loans are also gaining traction.
5. ESG in India: The Emerging Market Story
India, as one of the fastest-growing economies, is experiencing its own ESG wave.
Regulation: SEBI (Securities and Exchange Board of India) has mandated the Business Responsibility and Sustainability Report (BRSR) for top listed companies.
Investor Demand: Indian mutual funds are launching ESG-focused schemes.
Corporate Adoption: Firms like Infosys, Tata, and Wipro are global ESG leaders.
Green Finance: India issued its first sovereign green bonds in 2023.
Challenges in India:
Lack of standardized ESG reporting.
Limited awareness among retail investors.
Trade-off between growth and sustainability in a developing economy.
6. Sectoral ESG Trends
1. Energy
Fossil fuels are being replaced with renewables.
Oil & gas companies are investing in carbon capture.
2. Technology
Big tech faces scrutiny on data privacy and energy usage in data centers.
Tech firms lead in transparency reporting.
3. Banking & Finance
Banks integrate ESG into lending decisions.
Green finance and ESG loans are rising.
4. Healthcare & Pharma
Focus on ethical drug pricing, access to healthcare, and sustainable production.
5. Manufacturing
Supply chain sustainability is a big issue.
ESG compliance is crucial for exports.
7. Benefits of ESG Investing
Risk Management – ESG factors identify hidden risks (climate lawsuits, governance failures).
Long-Term Returns – ESG-compliant firms often outperform peers over the long run.
Investor Confidence – Transparency builds trust with stakeholders.
Competitive Advantage – Sustainable firms attract better talent and customers.
Global Alignment – Aligns with SDGs (UN Sustainable Development Goals).
8. Challenges in ESG Investing
Greenwashing – Companies exaggerate or falsely claim ESG compliance.
Data Inconsistency – ESG ratings differ widely across agencies.
Short-Term Costs – ESG transition requires heavy investments.
Lack of Awareness – Many retail investors still prioritize quick profits.
Policy Differences – No uniform global ESG standard.
9. Future of ESG & Sustainability Investing
Prediction 1: Stricter Regulations
Governments worldwide will enforce mandatory ESG disclosures.
Prediction 2: ESG in Emerging Markets
India, China, Brazil, and Africa will see exponential ESG adoption.
Prediction 3: Integration with Technology
AI-driven ESG scoring, blockchain-based supply chain tracking, and carbon credit markets will become mainstream.
Prediction 4: Mainstream Adoption
In the near future, ESG will not be a separate category—it will be the default way of investing.
Prediction 5: Retail ESG Investing
Just like mutual funds became mainstream, ESG-focused products will attract retail participation in India and abroad.
10. Practical Guide: How to Invest in ESG
Mutual Funds & ETFs – Invest in ESG-themed funds.
Direct Stocks – Pick companies with strong ESG ratings.
Green Bonds – Support eco-projects while earning fixed returns.
Thematic Portfolios – Build portfolios around sustainability themes (renewables, EVs, water management).
Due Diligence – Verify ESG claims; avoid greenwashing traps.
Conclusion
Sustainability & ESG investing is not a passing fad—it’s a megatrend shaping the future of finance. The world is moving towards a system where profit and purpose must co-exist.
For investors, this means:
ESG is becoming a risk management tool.
ESG compliance improves long-term performance.
Early adopters stand to benefit from the global shift in capital flows.
India, being at the cusp of massive economic growth, is perfectly positioned to ride the ESG wave. The government’s push for clean energy, digital governance, and responsible corporate practices will only accelerate this trend.
In short, the future of investing is sustainable investing. Capital is no longer blind; it is conscious, responsible, and forward-looking.

Paer 4 Learn Institutional Trading Options Trading Strategies
Basic Strategies
Long Call → Buy call, bullish.
Long Put → Buy put, bearish.
Covered Call → Own stock + sell call for income.
Protective Put → Own stock + buy put for protection.
Intermediate Strategies
Straddle: Buy Call + Put at same strike (bet on volatility).
Strangle: Buy Call (higher strike) + Put (lower strike).
Bull Call Spread: Buy low strike call + sell higher strike call.
Bear Put Spread: Buy put + sell lower strike put.
Advanced Strategies
Iron Condor: Range-bound strategy selling OTM call + put spreads.
Butterfly Spread: Profit from low volatility near strike.
Ratio Spreads: Adjust risk/reward with multiple options.
Margin Requirements & Leverage
Option buyers: Pay only premium (small capital).
Option sellers (writers): Need large margin (higher risk).
NSE SPAN + Exposure margin system determines requirements.
For example, selling 1 lot of Bank Nifty option may require ₹1.5–2 lakh margin depending on volatility.

Part 2 Ride The Big MovesOption Premium & Pricing (The Greeks Simplified)
Premium depends on:
Intrinsic Value = difference between spot & strike.
Time Value = extra value based on time to expiry & volatility.
The Greeks explain sensitivity of option price:
Delta: Sensitivity to underlying price.
Theta: Time decay (options lose value as expiry nears).
Vega: Sensitivity to volatility.
Gamma: Rate of change of Delta.
For example, Indian traders often notice how Bank Nifty weekly options lose value rapidly on expiry day (Theta decay)—which is why option sellers make money on “expiry day trading.”
Types of Options in India
Index Options – Nifty 50, Bank Nifty, FinNifty (most liquid).
Stock Options – Individual companies like Reliance, TCS, HDFC Bank.
Currency Options – USD/INR, EUR/INR (for forex hedging).

Part 1 Ride The Big MovesWhy Trade Options?
Leverage: Trade larger positions with smaller capital.
Hedging: Protect your portfolio against market falls.
Speculation: Bet on market direction with limited risk.
Income Generation: Write (sell) options to earn premium.
Options Market in India
Introduced in 2001 by NSE with index options.
Stock options followed in 2002.
India now has weekly expiries for Nifty, Bank Nifty, and FinNifty.
SEBI & Exchanges regulate margin rules, position limits, and trading practices.
The retail participation in options has exploded post-2020 with apps like Zerodha, Upstox, Angel One, Groww, making it extremely easy to trade.

Part 2 Master Candle PatternKey Terms in Options Trading
Strike Price: The price at which you can buy/sell the underlying.
Premium: The cost paid to buy the option.
Expiry Date: Last day the option is valid (weekly/monthly in India).
Lot Size: Minimum tradable quantity (e.g., Nifty options = 25 units per lot).
ITM (In the Money): Option has intrinsic value.
ATM (At the Money): Strike price = underlying price.
OTM (Out of the Money): Option has no intrinsic value.
How Options Work (Indian Example)
Let’s take an example with Nifty 50 trading at ₹22,000:
Suppose you buy a Nifty 22,200 Call Option for a premium of ₹100 (lot size = 25).
Total cost = 100 × 25 = ₹2,500.
Case 1: Nifty goes up to 22,400
Intrinsic value = 22,400 – 22,200 = ₹200
Profit per lot = (200 – 100) × 25 = ₹2,500
Case 2: Nifty stays at 22,000 or falls
Option expires worthless.
Loss = Premium paid = ₹2,500
This asymmetry—limited risk, unlimited reward—is what attracts many retail traders to options.

Swing Trading in Indian MarketsIntroduction
Trading in the stock market is like playing a game of probabilities where timing is everything. Some traders like to buy and sell within minutes (intraday scalpers), while others prefer to hold stocks for years (long-term investors). In between these two extremes lies a popular style of trading called Swing Trading.
Swing trading is about catching the "swings" or short-to-medium-term price moves in stocks, indices, or even commodities. Instead of sitting glued to the screen all day like an intraday trader, or waiting for 5–10 years like a long-term investor, swing traders typically hold positions for a few days to a few weeks.
In India, where the stock market has seen explosive growth in participation from retail investors, swing trading is gaining popularity. This strategy gives traders the flexibility to take advantage of short-term volatility while not requiring them to constantly monitor the screen.
In this guide, let’s dive deep into what swing trading is, why it’s important, how to do it, the tools required, strategies, risks, and examples from the Indian market.
1. What is Swing Trading?
Swing trading is a trading style that aims to capture short-to-medium-term gains in a stock (or any financial instrument).
Holding Period: From 2–3 days to a few weeks.
Objective: To profit from price “swings” (upward or downward movements).
Approach: Mix of technical analysis (charts, patterns, indicators) and fundamental awareness (news, events, earnings).
In simple words: Imagine a stock is moving in a zig-zag pattern. Swing traders don’t try to catch the entire long-term trend. Instead, they try to capture one piece of the move—either when the stock is bouncing up after a fall or dropping after a rise.
For example:
If Reliance Industries stock moves from ₹2,500 to ₹2,650 in a week, a swing trader could ride that move for quick profit.
If Infosys stock looks weak after earnings and is falling from ₹1,600 to ₹1,500, a swing trader could short-sell and benefit.
2. Why is Swing Trading Popular in India?
Swing trading is especially attractive for Indian retail traders because:
Flexibility – Unlike intraday trading, you don’t need to sit in front of the screen all day. You can plan trades in the evening and just monitor during market hours.
Leverage & Margins – In India, SEBI has restricted heavy intraday leverage, but swing trading allows delivery-based positions. Brokers also offer margin trading facilities (MTF), making it easier to hold stocks for days.
Volatile Market – Indian markets move fast due to earnings, government policies, RBI decisions, and global news. This volatility creates opportunities for swing traders.
Retail-Friendly – With the rise of platforms like Zerodha, Upstox, Angel One, and Groww, swing trading has become accessible with advanced charting tools.
Balanced Risk-Reward – It’s less stressful than intraday and faster than long-term investing. Many working professionals choose swing trading as a side strategy.
3. Swing Trading vs Intraday vs Investing
Aspect Swing Trading Intraday Trading Investing
Holding Period Few days to few weeks Same day Years
Risk Level Moderate High (due to leverage) Low (if diversified)
Time Required Medium High (screen watching) Low
Profit Expectation Moderate but frequent Quick, high (if successful) Large, long-term
Tools Used Technical analysis + news Charts, indicators, order flow Fundamental analysis
So swing trading is a middle ground – less stress than intraday, but faster than long-term investing.
4. Tools Required for Swing Trading
To be successful in swing trading in Indian markets, you need the right tools:
Trading Account & Demat Account – A broker like Zerodha, Upstox, ICICI Direct, HDFC Securities, etc.
Charting Platform – TradingView, Zerodha Kite, ChartIQ for price analysis.
News Source – Moneycontrol, Economic Times, Bloomberg Quint, NSE India for updates.
Technical Indicators – Moving Averages, RSI, MACD, Bollinger Bands.
Screeners – Tools to filter stocks (e.g., Trendlyne, Chartink, Screener.in).
Risk Management Tool – Stop-loss orders and position sizing calculators.
5. Core Strategies in Swing Trading
There are several approaches swing traders use. Let’s break them down:
5.1 Trend Following Strategy
Buy when the stock is in an uptrend (higher highs, higher lows).
Example: A stock crossing above its 50-day moving average.
5.2 Breakout Trading
Buy when stock price breaks above resistance with volume.
Example: If Tata Motors consolidates at ₹950 and breaks above ₹1,000, it may rally further.
5.3 Pullback Trading
Enter during a temporary correction in a larger trend.
Example: Nifty is in an uptrend, but falls for 2–3 days. A swing trader buys the dip.
5.4 Reversal Trading
Trade when trend changes direction.
Example: If ITC falls from ₹500 to ₹475 but forms a bullish reversal candle, traders may go long.
5.5 Range-Bound Trading
Buy near support, sell near resistance in sideways stocks.
Example: HDFC Bank oscillating between ₹1,450–1,500.
6. Technical Indicators Used in Swing Trading
Swing traders rely heavily on technical analysis. Some common tools:
Moving Averages (20, 50, 200 DMA)
Trend direction.
Buy when price > 50 DMA.
Relative Strength Index (RSI)
Measures overbought/oversold.
Buy if RSI < 30 (oversold), sell if RSI > 70 (overbought).
MACD (Moving Average Convergence Divergence)
Trend + momentum.
Bullish crossover = buy signal.
Bollinger Bands
Shows volatility.
Price touching lower band = possible buy.
Candlestick Patterns
Doji, Hammer, Engulfing for reversals.
7. Risk Management in Swing Trading
Risk management is the backbone of swing trading. Without it, one bad trade can wipe out multiple good ones.
Stop-Loss – Always fix an exit point. Example: Buy stock at ₹500 with SL at ₹480.
Position Sizing – Don’t put all money in one stock. Max 2–5% of capital per trade.
Risk-Reward Ratio – Ideally 1:2 (risk ₹10 to gain ₹20).
Diversification – Trade different sectors (Banking, IT, Pharma).
Avoid Overnight News Risk – Be aware of corporate announcements, global events.
8. Advantages of Swing Trading in India
Less Stressful than Intraday – No need to monitor every second.
Fewer Trades, Bigger Gains – Catch larger moves instead of small ticks.
Flexibility for Working Professionals – Can plan trades after market hours.
High Probability Setups – Uses both technical and fundamental insights.
Suitable for Growing Market like India – Indian stocks often give big short-term moves.
9. Disadvantages & Challenges
Overnight Risk – Sudden news (like RBI policy, global crash) can hit positions.
False Breakouts – Indian markets often trap traders with fake moves.
Requires Patience – Not all trades work instantly.
Brokerage & Taxes – STT, GST, and charges reduce profits if over-trading.
Discipline Needed – Many traders exit early or average losing trades.
10. Examples of Swing Trading in Indian Markets
Let’s see real-world style examples:
Example 1: Breakout Trade in Tata Motors
Stock consolidates at ₹950 for weeks.
Breaks ₹1,000 with high volume.
Swing trader enters at ₹1,005 with SL at ₹980.
Target ₹1,080 achieved in 5 days.
Example 2: Pullback Trade in Infosys
Infosys rallies from ₹1,500 to ₹1,650.
Pulls back to ₹1,600.
Trader buys at ₹1,610 with SL at ₹1,580.
Stock bounces back to ₹1,680 in a week.
Example 3: Reversal Trade in HDFC Bank
Stock falls from ₹1,500 to ₹1,420.
Bullish hammer candlestick forms at support.
Trader buys at ₹1,430 with SL at ₹1,400.
Price climbs to ₹1,490 in 6 sessions.
Conclusion
Swing trading in Indian markets offers a balanced way to participate in the stock market. It doesn’t demand the speed of an intraday trader nor the patience of a long-term investor. With the right mix of technical analysis, risk management, discipline, and market awareness, traders can consistently generate profits.
However, like any trading style, swing trading is not a guaranteed money machine. Success depends on practice, learning from mistakes, and developing a trading edge. The Indian markets—with their high volatility, strong retail participation, and sectoral opportunities—make an excellent playground for swing traders.
In short: If you’re someone who wants to ride the short-term waves of the Indian stock market without being glued to the screen all day, swing trading may be your perfect strategy.

Intraday Scalping1. Introduction to Intraday Scalping
Trading in financial markets has evolved into many styles—long-term investing, swing trading, positional trading, and intraday trading. Among these, scalping is one of the most intense and fast-paced strategies.
Scalping refers to a method where traders aim to capture small price movements within seconds or minutes. Unlike swing or positional traders who hold positions for days or months, scalpers aim to enter and exit quickly, sometimes executing dozens or even hundreds of trades a day.
In Indian stock markets, where NSE and BSE see high liquidity, scalping is a popular strategy in indices (like Nifty, Bank Nifty), liquid stocks (Reliance, HDFC Bank, TCS), and even commodities (gold, crude oil).
Scalping is best suited for traders who:
Can stay focused for long hours.
Handle pressure and speed well.
Prefer small but consistent gains.
2. Core Principles of Scalping
Before diving into strategies, it’s important to understand the fundamentals of scalping:
Liquidity is King – Scalpers need high-volume stocks or indices to enter and exit trades instantly without slippage.
Speed Matters – Since targets are small (0.1% to 0.3% per trade), execution speed is critical.
Risk Management – A single large loss can wipe out the gains from many small trades.
Consistency Over Jackpot – Scalpers don’t wait for “big moves.” Instead, they profit from many small moves.
Discipline – Sticking to pre-defined stop-loss and target levels is crucial.
3. Scalping vs. Other Trading Styles
Feature Scalping Intraday Trading Swing Trading Investing
Holding Time Seconds to Minutes Few Hours Days to Weeks Months to Years
Profit per Trade Very Small (0.1%-0.5%) Moderate Larger Long-term growth
Number of Trades Dozens to Hundreds Few trades daily Few trades monthly Very few
Tools Used Level 2 data, tick charts Candlestick charts Technical + Fundamental Fundamental
Psychology Fast, disciplined Patient, tactical Balanced Long-term vision
Scalping is the most active and demanding form of trading, but it also offers the most immediate results.
4. Psychology of a Scalper
Scalping requires a unique psychological edge:
Patience for small wins: Many traders struggle because they seek “big moves.” A scalper must be satisfied with tiny but frequent gains.
Emotional control: Fear and greed must be controlled at a micro level. One wrong emotional trade can ruin the day.
Focus & speed: Scalping is like a high-speed chess game; hesitation means missed opportunities.
Discipline: Pre-defined rules must be followed strictly—no chasing trades.
5. Tools & Setup for Scalping
Scalping success depends heavily on the trader’s setup:
a. Hardware Requirements
A fast computer with at least 8GB RAM.
Dual monitor setup for watching charts and order books simultaneously.
High-speed internet (fiber or 5G).
b. Trading Platform & Broker
A broker offering low transaction costs and fast execution (e.g., Zerodha, Upstox, ICICI Direct Neo).
Access to Level 2 market depth (bid/ask book).
c. Indicators & Charts
1-min and tick charts.
Indicators commonly used:
VWAP (Volume Weighted Average Price)
EMA (Exponential Moving Average) – 9 & 20 period
MACD (for momentum shifts)
RSI (for overbought/oversold)
Volume Profile
6. Scalping Strategies
Here are the most popular scalping strategies used in Indian markets:
a. VWAP Strategy
VWAP acts as a magnet for intraday price action.
Buy when price crosses above VWAP with strong volume.
Sell when price falls below VWAP.
Example: Reliance trading at ₹2500; price bounces above VWAP at ₹2496 → scalper buys with ₹4 target and ₹2 stop-loss.
b. Moving Average Crossover (EMA 9 & 20)
When EMA 9 crosses above EMA 20, buy.
When EMA 9 crosses below EMA 20, sell.
Works best in trending markets.
c. Breakout Scalping
Identify support & resistance zones on 5-min charts.
Enter when price breaks with volume.
Exit quickly with small profit before reversal.
Example: Nifty at 22,000 resistance → breaks to 22,015 with volume → scalper buys for 15–20 point move.
d. Range Scalping
Works in sideways markets.
Buy near support, sell near resistance.
Keep very tight stop-loss.
e. Order Book Scalping
Watch Level 2 bid/ask orders.
If strong buy orders keep absorbing sellers, scalp long.
If sell orders dominate, scalp short.
7. Risk Management in Scalping
Since profits per trade are small, risk management is everything:
Stop-Loss Rule – Always use fixed stop-loss (e.g., ₹2-3 in stocks, 5-10 points in Nifty).
Position Sizing – Keep lot size small initially; scale up only when consistent.
Daily Loss Limit – Stop trading after reaching max daily loss (e.g., 2% of capital).
Risk/Reward Ratio – At least 1:1 (better 1:2).
Avoid Overtrading – Don’t trade just to recover losses.
8. Advantages of Scalping
Quick Profits – No overnight risk.
Many Opportunities – Even in flat markets, scalpers can profit.
Low exposure – Minimal time in the market reduces big event risks.
Compounding Effect – Small gains add up.
9. Disadvantages of Scalping
High Stress – Demands total concentration.
Brokerage Costs – Frequent trades mean high charges.
Slippage – Sudden moves may hit stop-loss before exit.
Not for Everyone – Requires speed and mental stamina.
10. Scalping in Indian Markets
Best Instruments for Scalping
Indices: Nifty 50, Bank Nifty.
High-volume stocks: Reliance, HDFC Bank, ICICI Bank, TCS, Infosys.
Commodities: Crude oil, Gold.
Market Timings for Scalping
9:15 – 11:00 AM: Best volatility, fresh moves.
1:30 – 2:30 PM: Post-lunch breakouts.
Avoid last 15 minutes (too erratic).
11. Common Mistakes by Scalpers
Overtrading after a loss.
Ignoring transaction costs (brokerage, STT, GST).
Trading illiquid stocks → slippage.
No fixed stop-loss → one big loss wipes gains.
Chasing trades late instead of waiting for setup.
12. Conclusion
Scalping is like Formula 1 racing in trading: high speed, high skill, high risk. It demands:
Focus on liquidity and small profits.
Discipline in following stop-loss.
Consistent practice with risk management.
For Indian traders, Nifty and Bank Nifty offer the best playground for scalping. While challenging, a disciplined scalper can grow wealth consistently, turning small daily gains into a powerful compounding engine.