ICICIBANK

ICICIBANK DOWNWARD TREND BROKEN ICICIBANK saw selling pressure after reaching 679, falling to 606. now it seems to have broken its downward trend and might consolidate before beginning its upwards trend.
PS: I'm a College Student, not a broker, I'm not qualified enough to suggest people trades. I'm a student to take a keen interest in the Stock Market during the lockdown. These are for educational purposes. Please do share your views and suggestions, I am still learning.

Best opportunity to make good money in ICICI Bank.ICICI bank is going bearish. All markets were also red today. Now it is on a crucial level. It may fall down tomorrow. There are least possibilities to get a bullish movement. It seems a best opportunity for intraday as well as for swingers. RSI is also generating a sell signal and in 5,15,30 minutes time frame price is under 50 and 200 EMA which will give resistance. It seems a best opportunity to make good money.
If you are a safe trader than take entry after price crosses 200 EMA in 1 hour time frame else take entry after few minutes of crossing trend line. analyze on your own before taking any entry.
Please comment your opinions or to suggest something.
Thanks!


ICICIBANK OVERSOLD ICICIBANK looks oversold. Support level at 625.5
Looks good for short term gain.
PS: I'm a College Student, not a broker, I'm not qualified enough to suggest people trades. I'm a student to take a keen interest in the Stock Market during the lockdown. These are for educational purposes. Please do share your views, I am still learning.


ICICI BANK Indraday callEntry : 633
Stop Loss : 631
Target : 635/637
The analysis is based on simple price action only. Entry point given are valid if the resistance / support breaks convincingly. For that learning candlesticks psychology is a must one.
Note : Don't jump in to the trade once market reach the entry level, most of the time will get better entry and that gives better reward. And always trial stop loss to take full target..

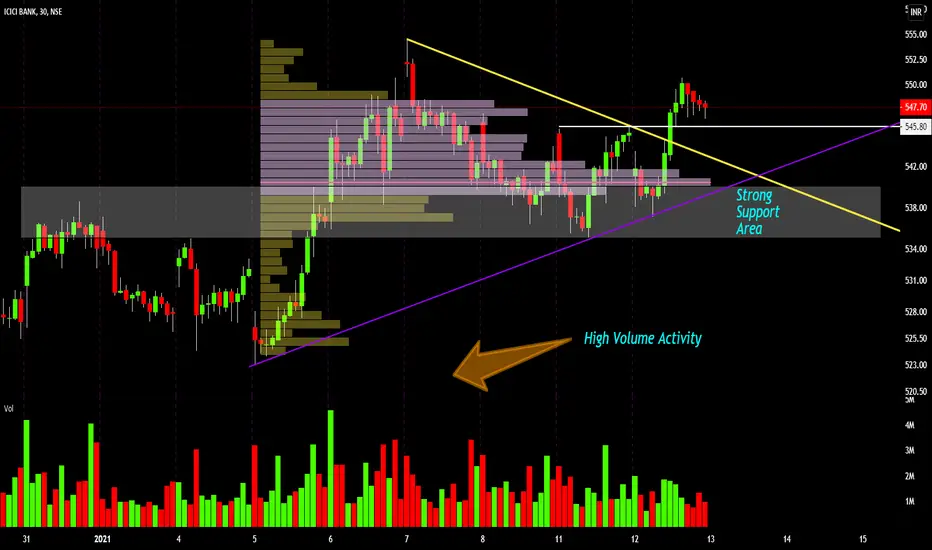
ICICI Bank For 12-02-2021 ICIC Bank Breakout Trade For 12-02-2021
Decending Tringle Breakout On 15 Min Chart
Go Long Above 635 And Tarrget Is 642
SL - 628
For educational Purposes Use Only
Im Not SEBI Registerd

ICICI Bank For 11-02-2021 ICIC Bank Had Made Descending Triangle On 15 Min Bearish Can Be Continuation
Short On 638/642 if Price Get Rejection Here
( SL- 645) ( Target 630 And 625 )
Go Long Above 645 Closed And
Target Pivot Point ( SL- 640 )

#ICICIBANK Futures seems weak for the next couple of days#ICICIBANK Future (and equity) charts look weak.
If it breaks 632 levels we may soon see 624 / 612 / 600 levels.
Good luck
#nse #bse #nifty #index #sensex #StockMarket #stock
#banknifty #trading #tips #option #equity #stockstowatch

ICICI BANK Short-term analysisICICI Bank short term trade. It's testing it's resistance of again and again. It might retrace a bit and 530, 523 and 503 can be the immediate support. I'm not giving any target as I'm holding it for long term.

ICICIBank Intraday Trade | Sell with 2 Points of SLIt's low probability High RR Trade. Sell @ 639 for the targets of 632 and 626 with 641 as SL.
To motivate me, Please like the idea If you agree with the analysis.
Happy Trading!
InvestPro India Team


icicibank coming week viewchance to move both side for few days, look for price action to conform ,
but over all stock still up upside .. will get the support from
any ware seems like good support
Note: im working on 5 minute Time Frame ,look at
in 5 minute time frame for better Idea
Use intraday 5 minuet magic method to enter


ICICI bank at a crucial resistanceICICI bank is about to break its previous all time high very soon. It already tried twice but failed. Might break it next time. Keep a watch. Plan your trade accordingly.


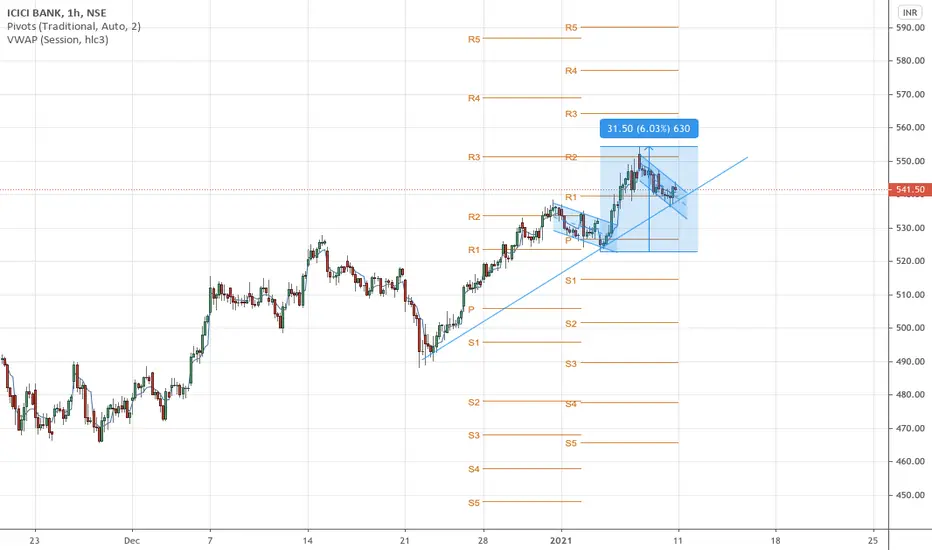
ICICI Bank Flag & Pole patternICICI Bank is forming a flag & pole pattern. Can expect a minimum 30 points move if it breaks on the upside. It has also taken good support from the upwards trend line.