Part 1 Master Candlestick PatternOptions in the Indian Stock Market
In India, options trading is booming, especially in:
Nifty & Bank Nifty (Index options).
Stock Options (Reliance, TCS, HDFC Bank, etc.).
👉 Interesting fact: Over 90% of trading volume in NSE comes from options today.
Expiry days (Thursdays for weekly index options) see massive action, as traders bet on final movements.
The Power of Weekly Options
Earlier, only monthly options were available. Now NSE has weekly expiries for Nifty, Bank Nifty, and even stocks.
Weekly options = cheaper premiums.
Traders use them for intraday or short-term bets.
But time decay is very fast.
ICICIBANK

Part 4 Institutional Trading Simple Option Strategies
Options allow creativity. Instead of just buying/selling, traders create strategies by combining calls & puts.
a) Protective Put
Buy stock + Buy Put option = Insurance against downside.
b) Covered Call
Own stock + Sell Call option = Earn income if stock stays flat.
c) Straddle
Buy Call + Buy Put (same strike, same expiry) = Profit from big moves either way.
d) Strangle
Buy OTM Call + OTM Put = Cheaper than straddle but requires bigger move.
e) Iron Condor
Sell OTM Call + OTM Put, while buying further OTM options = Profit if market stays in range.
These are just a few. Professional traders use dozens of strategies depending on market condition.
Risks in Options Trading
Options are attractive, but risky too.
Time Decay (Theta) → Every day, options lose value as expiry approaches.
Wrong Direction → If your view is wrong, you lose the premium.
Liquidity Risk → Some strikes may have no buyers/sellers.
Over-Leverage → Small premium tempts traders to overtrade, leading to big losses.

Part 3 Institutional Trading Types of Option Traders
There are mainly four types of participants:
Option Buyers (Long Call / Long Put)
Pay premium.
Limited loss (premium), unlimited profit.
Usually retail traders.
Option Sellers (Short Call / Short Put)
Receive premium.
Limited profit (premium), unlimited loss.
Usually big institutions (because margin required is high).
This is why buyers dream, sellers earn is often said in option markets.
Why Trade Options?
Options are powerful because they allow:
Leverage → Small premium controls large value.
Hedging → Protect portfolio from crashes (insurance).
Speculation → Bet on direction, volatility, or time decay.
Income → Selling options to earn steady premium (if managed wisely).

Part 1 Ride The Big MovesKey Terminologies in Options
Before diving deeper, you need to know the “language of options.”
Strike Price → The fixed price at which you can buy/sell (like 2500 in Reliance example).
Premium → The cost you pay to buy an option.
Expiry Date → Options have a life—weekly, monthly, quarterly. After expiry, they are worthless.
Lot Size → Options are not traded in single shares. They come in fixed quantities called lots (e.g., Nifty lot size = 50).
In the Money (ITM) → Option has intrinsic value.
Out of the Money (OTM) → Option has no value (only time value).
At the Money (ATM) → Strike price = Current market price.
How Option Prices Are Decided
Option premiums are not random. They are influenced by:
Intrinsic Value (IV) → Difference between current price and strike price.
Example: Reliance at ₹2600, Call 2500 → Intrinsic value = ₹100.
Time Value → More time till expiry = higher premium.
Volatility → If a stock is volatile, options are expensive because chances of big movement are high.
Interest rates & Dividends → Minor but relevant in longer-term options.

Premier Energies Ltd 1 Day ViewIntraday Price Snapshot
As of the latest update, the stock is trading at approximately ₹1,011.90, reflecting an up move of around 0.07% over the previous close
Another source confirms a similar performance: a rise of ~0.73% in the past 24 hours, placing the price near ₹1,011.20
Daily Price Range & Volume
The Day’s High reached ₹1,019.00, while the Day’s Low dipped to ₹981.30
Trading volume for the day stood around 1.43 million shares
What This Means for You
The stock experienced modest intraday movement, staying within a relatively narrow band. This suggests a period of consolidation combined with limited market-driven volatility.
If you're monitoring technical indicators (like intraday support/resistance or moving averages), reviewing detailed intraday charts on platforms such as NSE, TradingView, or Moneycontrol can help—these platforms offer minute-by-minute price action, volume bars, and technical overlays.
Let me know if you’d like to compare this intraday performance with other intervals—like 1 week or 1 month—or if you’d like to analyze technical indicators like RSI, MACD, or intraday moving averages!

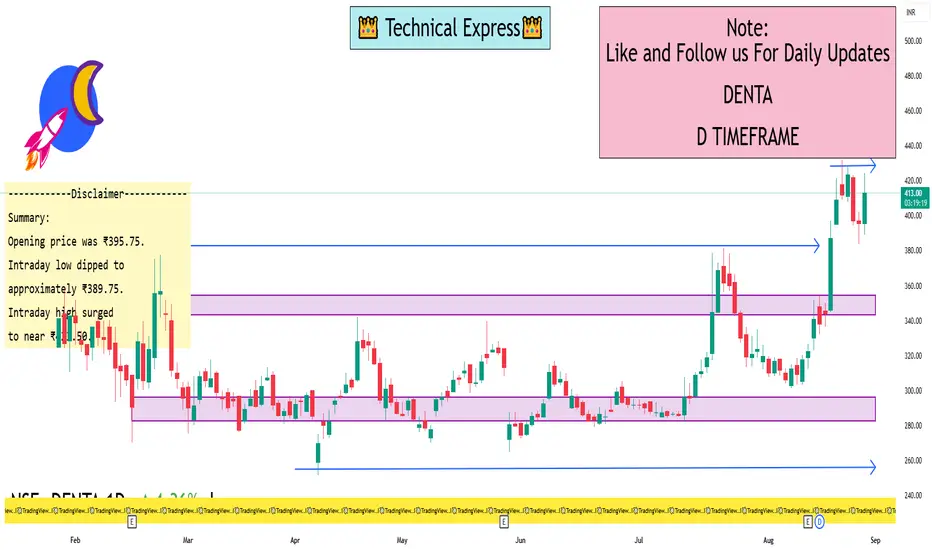
Denta Water and Infra Solutions Ltd. 1 Day ViewIntraday Snapshot (as of Aug 28, 2025)
Current/Last Traded Price: ₹416.25 to ₹417.25, up by approximately ₹20.50, or +5.2% to +5.8% from previous close of ₹395.75
Day’s Trading Range: Low ~₹389.30–389.75; High ~₹424.40–424.50
What This Tells Us
Strong Intraday Price Action: The stock saw a significant intraday move, touching a high of ₹424.40—nearing its 52-week high (₹432.40)—indicating strong buying momentum.
Bullish Momentum: The “Very Bullish” technical assessment and rising pre-open price point to robust market sentiment.
Distinct High Valuation: With P/E and P/S ratios above average, the stock may be considered richly valued, suggesting investor enthusiasm or anticipation of future growth.
Summary: 1-Day (Aug 28) Level View
Opening price was ₹395.75.
Intraday low dipped to approximately ₹389.75.
Intraday high surged to near ₹423.50.
The stock closed around ₹414.20–₹417 range, showing a robust daily gain (~5%)
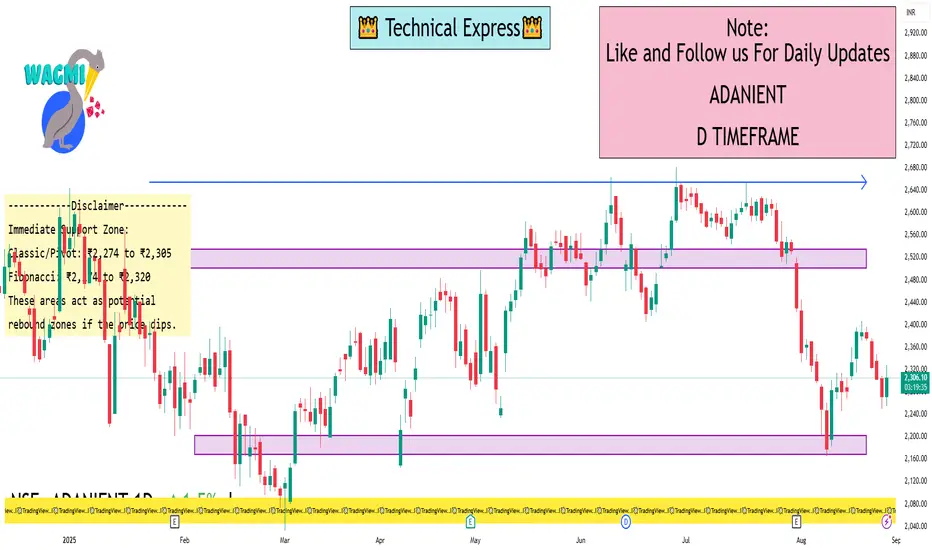
Adani Enterprises Limited 1Day ViewDaily Support & Resistance Levels
Moneycontrol (Classic Pivots):
R1: ₹2,304.40
Pivot: ₹2,276.90
S1: ₹2,244.50
S2: ₹2,217.00
R2/R3 and further levels (Fib, Camarilla) also available
StockInvest.us (Forecast & Levels):
Resistance (Fib):
R1: ₹2,299.78
R2: ₹2,313.92
R3: ₹2,336.80
Support (Fib):
S1: ₹2,254.02
S2: ₹2,239.88
S3: ₹2,217.00
Also highlights volume-based levels:
Support: ₹2,249.80
Resistance: ₹2,283.40
A breakout above these could shift sentiment
Final Take
Immediate bullish trigger: Sustained move above ₹2,283–₹2,304.
Bearish risk zone: Failing to hold ₹2,249–₹2,244 could drag the price toward ₹2,217.
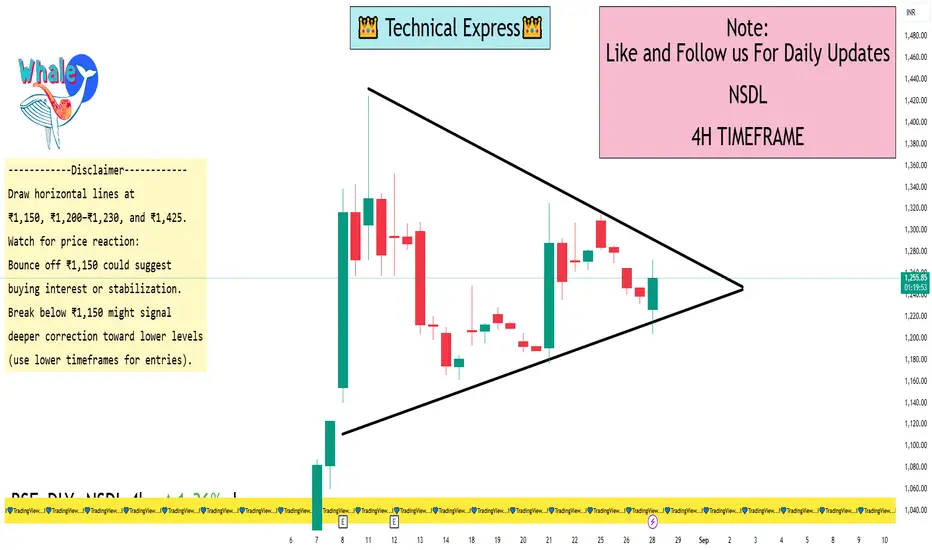
NSDL 4 Hour ViewKey Levels to Watch
Support Levels
₹1,150 — Analysts highlight this as a critical support. Post-Q1, NSDL dropped nearly 9% in two sessions, and ₹1,150 is seen as a potential line of defense. A break below may lead to sharper losses.
₹1,200–₹1,230 — Near the stock's current region (around ₹1,237), which can act as a short-term base due to recent consolidation and VWAP alignment.
Resistance Levels
₹1,425 — The recent all-time high reached after a strong post-IPO rally. Forms a clear resistance zone.
Technical Context & Market Sentiment
Recent Rally: NSDL surged ~78% from its ₹800 IPO price and ~62% from its ₹880 listing price, peaking near ₹1,425.
Profit Booking: The sharp decline post-Q1 earnings reflects investor caution and stretched valuations, reinforcing the significance of the ₹1,150 level.
How to Use These Levels on Your 4-Hour Chart
Draw horizontal lines at ₹1,150, ₹1,200–₹1,230, and ₹1,425.
Watch for price reaction:
Bounce off ₹1,150 could suggest buying interest or stabilization.
Break below ₹1,150 might signal deeper correction toward lower levels (use lower timeframes for entries).
Advances toward ₹1,425 could reignite bullish momentum if volume supports the move.
Combine with indicators:
Moving Averages (e.g., 20/50 EMA) — can offer dynamic support/resistance.
RSI/MACD — monitor for divergence or overbought/oversold conditions to time entries or exits.
Confirm before acting:
Look for candlestick signals (pin bars, engulfing patterns) around these zones.
Volume spikes on breakouts or bounces add conviction.
IPOs & SME IPOs BoomIntroduction
The world of stock markets has always fascinated investors, traders, and even common people who might not actively trade but follow financial news. One term that grabs headlines again and again is IPO (Initial Public Offering). An IPO is when a private company decides to raise money from the public by offering its shares for the first time.
In recent years, especially in India and several emerging markets, IPOs have witnessed a boom. Not just large companies, but even SMEs (Small and Medium Enterprises) are coming forward to list themselves on SME exchanges through SME IPOs.
This IPO & SME IPO boom reflects not only investor enthusiasm but also the maturity of financial markets, government policies, and the rising appetite of retail investors who now want to participate in the growth stories of businesses right from the early stage.
This article will give you a comprehensive 3000-word explanation of IPOs and SME IPOs boom, in simple yet detailed language.
Part 1: What is an IPO?
Definition
An IPO (Initial Public Offering) is the process by which a private company offers its shares to the public for the first time. After listing, the company’s shares can be traded on stock exchanges such as NSE or BSE in India, or NASDAQ and NYSE in the US.
Key Objectives of an IPO
Raising Capital – To fund expansion, repay debt, or improve working capital.
Brand Visibility – Being listed increases brand credibility.
Liquidity for Promoters – Founders and early investors can sell part of their stake.
Public Participation – Gives retail and institutional investors a chance to own part of the company.
IPO Process in Brief
Appointing Merchant Bankers (Lead Managers)
Regulatory Approval (SEBI in India, SEC in US, etc.)
Draft Red Herring Prospectus (DRHP) Filing
IPO Marketing & Roadshows
Price Band & Book-Building
IPO Subscription by Investors
Allotment & Refunds
Listing on Stock Exchange
Part 2: What is an SME IPO?
Definition
An SME IPO is an IPO specifically designed for Small and Medium Enterprises. These are businesses that may not yet have the size or turnover to list directly on the main board of the stock exchange.
India has two major SME platforms:
BSE SME Exchange
NSE EMERGE
Key Features of SME IPOs
Minimum post-issue paid-up capital: ₹3 crore.
Investors: Retail, HNIs, and institutional investors.
Lower compliance requirements compared to mainboard IPOs.
Ticket size for investment is usually smaller.
Acts as a bridge for small businesses to access capital markets.
Objectives of SME IPOs
To provide SMEs with growth capital.
To create liquidity for promoters and investors.
To give SMEs recognition and credibility.
To act as a stepping stone for listing on the main board in future.
Part 3: Why IPOs & SME IPOs are Booming
The boom in IPOs and SME IPOs can be attributed to several factors:
1. Strong Investor Participation
Retail investors have become more active in financial markets, thanks to digital trading apps, UPI-based IPO bidding, and low-cost brokerage accounts.
2. Liquidity in the Market
Post-pandemic, central banks infused liquidity into the financial system. Investors had surplus money to deploy in equity markets, fueling IPO demand.
3. India’s Economic Growth Story
India is among the fastest-growing economies. Global investors want to participate in India’s growth via IPOs.
4. Success Stories of Past IPOs
Many IPOs delivered stellar listing gains (Zomato, Nykaa, MapmyIndia, IRCTC, etc.), creating investor confidence.
5. SME Sector Growth
SMEs form the backbone of India’s economy, contributing nearly 30% to GDP and 40% to exports. SME IPOs are now seen as a lucrative way to fund this growth.
6. Regulatory Push
SEBI and exchanges have simplified rules, making IPO participation easier for retail investors and listing smoother for companies.
7. Rising Financial Awareness
Mutual funds, social media, and financial influencers have educated people about IPO investing.
Part 4: Benefits of IPOs & SME IPOs
For Companies
Access to large capital pool.
Improved brand image and trust.
Ability to attract and retain talent (ESOPs).
Liquidity for promoters.
For Investors
Opportunity to invest early in a growing company.
Potential for high listing gains.
Long-term wealth creation.
Portfolio diversification.
For the Economy
Mobilizes savings into productive assets.
Boosts entrepreneurship.
Strengthens capital markets.
Enhances corporate governance.
Part 5: Risks & Challenges
Despite the boom, IPOs and SME IPOs carry risks:
Overvaluation – Companies may come at expensive valuations.
Market Volatility – IPO success depends heavily on market sentiment.
Liquidity Risks in SME IPOs – Trading volumes are often lower.
Short-Term Speculation – Many investors enter just for listing gains.
Regulatory Burden – SMEs may struggle with compliance post-listing.
Part 6: Case Studies of IPO & SME IPO Boom
Mainboard IPOs (India)
Zomato (2021) – One of India’s most hyped IPOs, raised ₹9,375 crore.
Nykaa (2021) – Strong listing, became a household name.
LIC (2022) – India’s biggest IPO, raised ₹21,000+ crore.
SME IPOs (India)
Droneacharya Aerial Innovations (2022) – Gained over 100% on listing.
Eighty Jewellers, Global Surfaces, Infollion Research – Delivered strong returns.
Many SME IPOs in 2023–24 have been oversubscribed by 100x+.
Part 7: Global IPO Boom
It’s not just India — worldwide IPO activity has seen cycles of booms:
US Tech IPOs like Airbnb, Uber, Rivian.
China’s STAR Market fueling SME & tech IPOs.
Middle East IPOs in Saudi Arabia and UAE linked to oil & diversification plans.
This global enthusiasm for IPOs reflects investors’ hunger for growth companies.
Part 8: Future Outlook of IPOs & SME IPOs
Continued Momentum in India – With India’s strong GDP growth, IPOs and SME IPOs will remain active.
Technology & Digital Startups – More unicorns will go public.
SME Sector Expansion – With government support (Make in India, PLI schemes), SMEs will increasingly tap markets.
Global Capital Inflows – FIIs and DIIs will continue supporting IPO markets.
Regulatory Strengthening – Investor protection measures will grow, ensuring sustainable IPO growth.
Part 9: How Retail Investors Should Approach IPOs
Study DRHP carefully.
Check valuations compared to peers.
Don’t just chase listing gains – look for long-term potential.
Diversify across sectors instead of putting all money into one IPO.
Be cautious with SME IPOs – higher risk, but higher reward.
Conclusion
The boom in IPOs and SME IPOs is a reflection of the changing investment landscape. Companies are now more open to tapping markets, investors are more financially literate, and technology has made participation seamless.
While IPOs offer opportunities for wealth creation, they also carry risks. The SME IPO boom in particular highlights the democratization of capital markets, allowing small businesses to grow with public support.
As long as investors remain disciplined, regulators ensure transparency, and companies use the raised capital productively, the IPO and SME IPO boom is likely to continue shaping the future of stock markets in India and across the world.

Part 2 Support ans ResistanceAdvantages of Options
High leverage (small money → big exposure).
Flexibility (profit in up, down, or sideways markets).
Risk defined for buyers (can lose only premium).
Useful for hedging portfolios.
Risks of Options
Time decay: Value decreases as expiry approaches.
High leverage can cause big losses (especially for sellers).
Complexity: Needs knowledge of Greeks, volatility, etc.
Emotions: Options move fast → fear & greed affect traders.
Options Greeks (Advanced but Important)
The “Greeks” help measure how option prices move with market factors:
Delta → Change in option price vs stock price.
Gamma → Rate of change of Delta.
Theta → Time decay (how much premium falls daily).
Vega → Impact of volatility on premium.
Rho → Impact of interest rates.
👉 Example: If an option has Theta = -10, it means the premium will lose ₹10 per day (if all else same).

Part 1 Support ans ResistancePayoff Diagrams (Understanding Profits & Losses)
Options are best understood with payoff diagrams.
Call Buyer → Loss limited to premium, profit unlimited.
Put Buyer → Loss limited to premium, profit grows as price falls.
Call Seller → Profit limited to premium, risk unlimited.
Put Seller → Profit limited to premium, risk high if price falls.
Common Option Strategies
Beginners usually just buy Calls or Puts. But professionals use strategies combining multiple options:
Covered Call → Hold stock + Sell Call to earn income.
Protective Put → Hold stock + Buy Put for protection.
Straddle → Buy Call + Buy Put (bet on big movement either way).
Strangle → Similar to Straddle but strikes are different.
Iron Condor → Sell both Call & Put spreads (profit if market stays flat).

Part 4 Trading Master ClassOptions Premium – How Price is Decided?
The premium (cost of option) depends on:
Intrinsic Value → The real value of option (difference between current price & strike price).
Time Value → More time till expiry = higher premium.
Volatility → If market is volatile, premium is high because chances of big move increase.
Interest Rates & Dividends → Minor effect.
👉 Example:
Reliance = ₹2,600.
Call Option 2,500 Strike = Intrinsic Value = ₹100.
Premium charged = ₹120 (extra ₹20 is time value).
Moneyness of Options
Options are classified as:
In the Money (ITM) → Option already has profit potential.
At the Money (ATM) → Option strike = Current price.
Out of the Money (OTM) → Option has no intrinsic value (only time value).
👉 Example (Stock at ₹500):
Call 480 = ITM.
Call 500 = ATM.
Call 520 = OTM.

Part 3 Trading Master ClassHow Options Work in Practice
Let’s take a real-life relatable scenario:
👉 Suppose you think Nifty (20,000) will rise in the next week.
You buy a Nifty Call Option 20,200 Strike at premium ₹100.
Lot size = 50, so total cost = ₹5,000.
Now:
If Nifty goes to 20,400 → Your option is worth ₹200 (profit ₹5,000).
If Nifty stays at 20,000 → Option expires worthless (loss = ₹5,000).
So, with only ₹5,000, you controlled exposure worth ₹10 lakhs. That’s leverage.
Participants in Options Market
There are four main categories of traders:
Call Buyer → Expects price to go UP.
Call Seller (Writer) → Expects price to stay flat or go DOWN.
Put Buyer → Expects price to go DOWN.
Put Seller (Writer) → Expects price to stay flat or go UP.

Part 2 Trading Master ClassTypes of Options
There are only two main types of options:
(A) Call Option (Right to Buy)
A call option gives the buyer the right to buy the asset at a fixed price.
👉 Example:
Stock: Reliance is at ₹2,500 today.
You buy a Call Option at strike price ₹2,600, paying a premium of ₹50.
If Reliance goes to ₹2,700, you can buy at ₹2,600 (profit).
If Reliance stays below ₹2,600, your option expires worthless, and you lose the ₹50 premium.
(B) Put Option (Right to Sell)
A put option gives the buyer the right to sell the asset at a fixed price.
👉 Example:
Stock: Infosys is at ₹1,400.
You buy a Put Option at strike ₹1,350, paying premium ₹20.
If Infosys falls to ₹1,300, you can sell at ₹1,350 (profit).
If Infosys stays above ₹1,350, your option expires worthless, and you lose the ₹20 premium.
Why Trade Options?
Options are popular because they provide flexibility, leverage, and hedging.
1. Leverage (Small money, big exposure)
With just a small premium, you control a large quantity of shares.
Example: To buy 50 shares of Nifty (at 20,000), you need ₹10 lakhs. But an option may cost only ₹20,000 for the same exposure.
2. Hedging (Risk Protection)
Investors use options to protect portfolios. Example: If you hold Infosys shares, you can buy a Put Option to protect against price falls (like insurance).
3. Speculation (Profit from movement)
Traders use options to bet on price moves (up, down, or even staying flat).
4. Income (Option Writing)
Professional traders sell options to earn premiums regularly.

Part 1 Trading Master ClassIntroduction to Options Trading
Imagine you want to buy a house. You like one particular property, but you don’t want to commit right away. Instead, you tell the seller:
"Here’s ₹1 lakh. Keep this house reserved for me for the next 6 months. If I decide to buy, I’ll pay you the agreed price. If not, you can keep this ₹1 lakh."
That ₹1 lakh you gave is called a premium. The deal you made is an option — a contract that gives you the right but not the obligation to buy the house.
This is the core idea of options trading: you pay a small premium to get the right to buy or sell something (like stocks, indexes, commodities, etc.) at a fixed price in the future.
What is an Option?
An option is a contract between two parties:
Buyer of option (the one who pays the premium).
Seller of option (the one who receives the premium).
The buyer has the right (but not obligation) to buy or sell at a certain price. The seller has the obligation to fulfill the deal if the buyer exercises the option.
Key Terms:
Underlying Asset → The thing on which the option is based (stocks like Reliance, Infosys, indexes like Nifty, commodities, etc.).
Strike Price → The pre-decided price at which the buyer can buy or sell.
Premium → The cost of buying the option.
Expiry → The last date till which the option is valid.
Lot Size → Options are traded in fixed quantities, not single shares. Example: Nifty options lot = 50 shares.

Option Trading Introduction to Options Trading
Imagine you want to buy a house. You like one particular property, but you don’t want to commit right away. Instead, you tell the seller:
"Here’s ₹1 lakh. Keep this house reserved for me for the next 6 months. If I decide to buy, I’ll pay you the agreed price. If not, you can keep this ₹1 lakh."
That ₹1 lakh you gave is called a premium. The deal you made is an option — a contract that gives you the right but not the obligation to buy the house.
This is the core idea of options trading: you pay a small premium to get the right to buy or sell something (like stocks, indexes, commodities, etc.) at a fixed price in the future.
What is an Option?
An option is a contract between two parties:
Buyer of option (the one who pays the premium).
Seller of option (the one who receives the premium).
The buyer has the right (but not obligation) to buy or sell at a certain price. The seller has the obligation to fulfill the deal if the buyer exercises the option.
Key Terms:
Underlying Asset → The thing on which the option is based (stocks like Reliance, Infosys, indexes like Nifty, commodities, etc.).
Strike Price → The pre-decided price at which the buyer can buy or sell.
Premium → The cost of buying the option.
Expiry → The last date till which the option is valid.
Lot Size → Options are traded in fixed quantities, not single shares. Example: Nifty options lot = 50 shares.

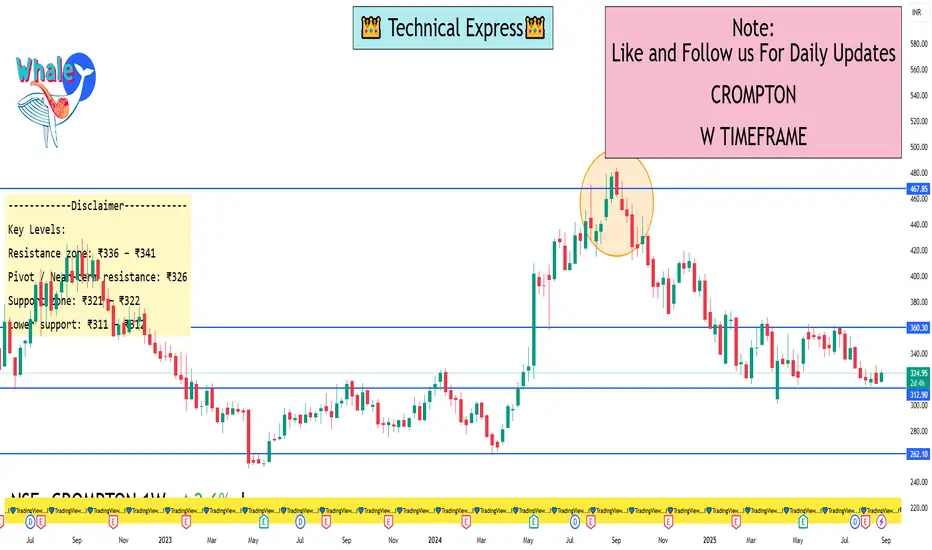
Crompton 1 Week ViewWeekly Levels
Immediate Support Zone: ₹325 – ₹330
Next Major Support: ₹305 – ₹310
Immediate Resistance Zone: ₹355 – ₹360
Major Resistance: ₹375 – ₹380
Observations
Price has been consolidating in a range roughly between ₹330 – ₹360 over recent weeks.
If the stock sustains above ₹360, momentum could push it toward ₹375–₹380.
On the downside, if ₹325 breaks, weakness may extend toward ₹305 levels.
Volumes are slightly picking up near supports, showing accumulation signs.
Bias
Neutral to mildly bullish as long as the stock holds above ₹330.
A breakout above ₹360 would strengthen bullish sentiment, while a breakdown below ₹325 may shift trend bearish.
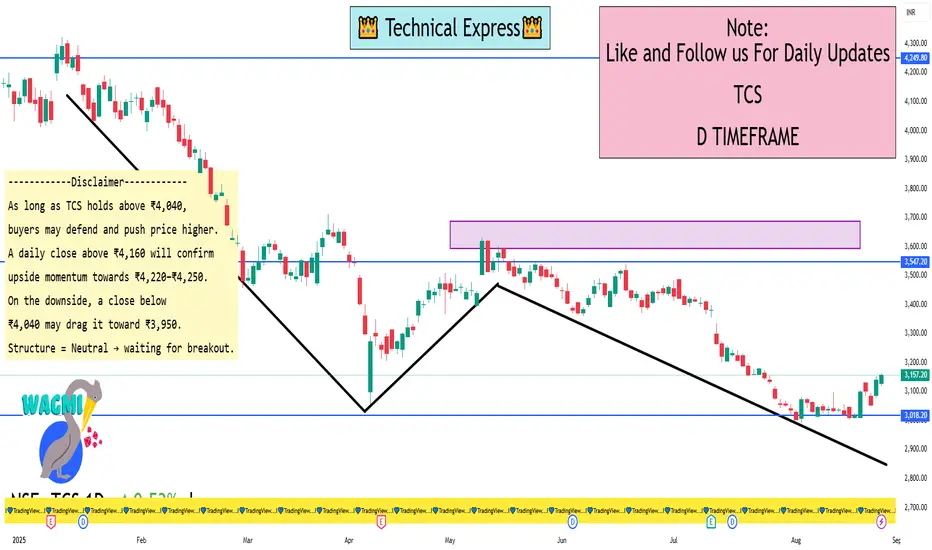
TCS 1 Day View TCS – 1 Day Timeframe Levels
🔹 Support Levels:
₹4,040 – 4,060 → Strong demand zone, recent bounce levels.
₹3,950 – 3,970 → Next major support if weakness continues.
₹3,850 → Broader support, trend-defining zone.
🔹 Resistance Levels:
₹4,140 – 4,160 → Immediate supply zone.
₹4,220 – 4,250 → Strong resistance; multiple rejections earlier.
₹4,300+ → Breakout level, opens path for higher rally.
View (Daily Structure)
Price is consolidating between ₹4,040 support and ₹4,160 resistance.
A daily close above ₹4,160 may trigger upside momentum toward ₹4,220–₹4,250.
A break below ₹4,040 could invite selling pressure toward ₹3,950.
Currently in a sideways consolidation, awaiting breakout for clear trend.
Eicher Motors Ltd 2 HourReal-Time Data Summary (Latest Close)
The most recent available data (close as of August 26, 2025) shows Eicher Motors trading at around ₹6,151, with a daily range between ₹5,970 and ₹6,210
Pivot Points (Daily) – Useful for Approximate 2-Hour Levels
While true 2-hour pivots aren't available, daily pivot points can be used as guidance for shorter intraday intervals.
From Investing.com (Daily Pivots):
Classic Pivot: ₹6,185
Support Levels (S1/S2/S3): ₹6,170, ₹6,140, ₹6,125
Resistance Levels (R1/R2/R3): ₹6,214.5, ₹6,229.5, ₹6,259
TipRanks Pivot Points (Based on Prior Day's Prices)
Classic Pivot: ₹5,951.98
Support (S1–S3): ₹5,913.97, ₹5,858.98, ₹5,820.97
Resistance (R1–R3): ₹6,006.97, ₹6,044.98, ₹6,099.97
Support & Resistance via StockInvest.us
Fibonacci Levels:
R1: ₹6,203.99
R2: ₹6,261.27
R3: ₹6,353.98
S1: ₹6,018.57
S2: ₹5,961.29
S3: ₹5,868.58
Additional Support (Accumulated Volume):
₹5,527, ₹5,495.55, ₹5,439.75
Final Thoughts
Overall bullish momentum persists (daily strong buy signals), though some indicators signal overbought conditions—be cautious.
Key swing zones:
Support: ₹6,018–₹5,961 (short term), ₹5,527–₹5,495 (deeper)
Resistance: ₹6,204–₹6,261 zone
Intraday, keep an eye on how price behaves around ₹6,100–₹6,150—it’s critical for deciding direction.

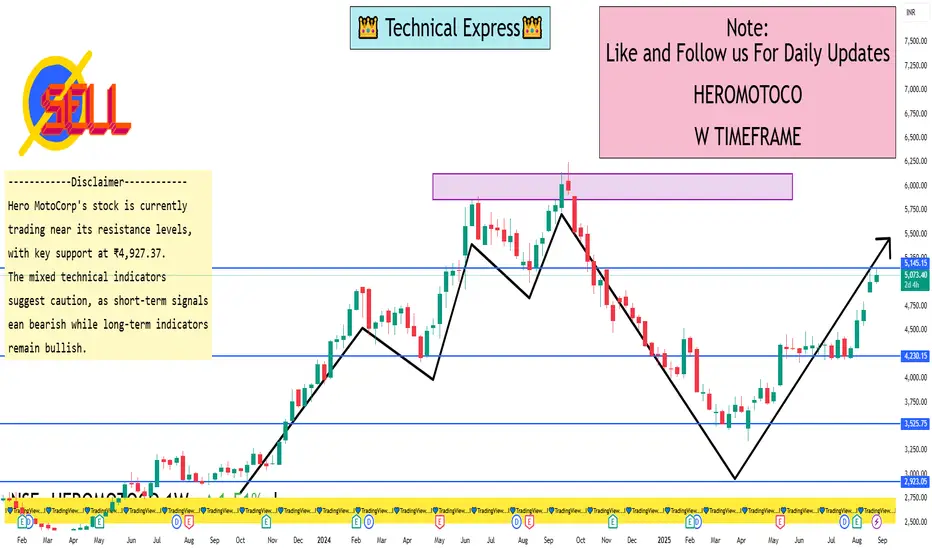
Heromotoco Ltd 1 Week ViewWeekly Support & Resistance Levels
Immediate Support: ₹4,927.37
Primary Support: ₹4,683.00
Immediate Resistance: ₹5,039.60
Primary Resistance: ₹5,216.60
These levels are derived from standard pivot point calculations and can serve as potential zones where the stock might experience buying or selling pressure.
Technical Indicators
Relative Strength Index (RSI): 67.39 – Neutral
MACD: 201.20 – Sell
Stochastic RSI: 89.90 – Sell
Moving Averages:
5-day: ₹5,066.46 – Sell
20-day: ₹4,624.92 – Buy
50-day: ₹4,408.96 – Buy
200-day: ₹4,125.66 – Buy
The overall technical outlook is mixed, with short-term indicators showing a sell signal and longer-term indicators indicating a buy.
Basics of Technical Analysis1. Philosophy Behind Technical Analysis
The foundation of technical analysis is based on three key assumptions:
a. Market Discounts Everything
This principle states that all known information—economic, political, and psychological—is already reflected in the current price of a security. Prices react immediately to news and events, so there is no need to analyze each piece of information individually. For example, if a company reports a better-than-expected quarterly result, its stock price will immediately adjust to reflect this news.
b. Prices Move in Trends
Technical analysts believe that prices follow trends, whether upward (bullish), downward (bearish), or sideways (consolidation). Recognizing these trends is crucial because “the trend is your friend.” Traders aim to align their trades with the prevailing trend rather than against it.
c. History Tends to Repeat Itself
Human psychology drives market behavior, and patterns of fear, greed, and optimism often repeat over time. Technical analysis relies on identifying these recurring patterns to predict potential price movements.
2. Core Components of Technical Analysis
Technical analysis consists of several tools and techniques. Understanding these fundamentals is essential for building an effective trading strategy.
a. Price Charts
Price charts are the most basic tool for technical analysts. They visually display the historical price movements of a security over time.
Line Chart: Shows a simple line connecting closing prices over time. Useful for spotting long-term trends.
Bar Chart: Displays open, high, low, and close (OHLC) for each period. Useful for analyzing volatility.
Candlestick Chart: Uses colored bars (candles) to indicate price movement. Highly popular due to its visual clarity and ability to display market sentiment.
Example of a Candlestick
Bullish Candle: Close is higher than open, indicating buying pressure.
Bearish Candle: Close is lower than open, showing selling pressure.
b. Support and Resistance
These are price levels where buying or selling pressure tends to prevent further movement.
Support: A level where demand exceeds supply, preventing the price from falling further.
Resistance: A level where supply exceeds demand, preventing the price from rising further.
Traders watch these levels to make entry and exit decisions. A breakout above resistance signals potential bullish momentum, while a breakdown below support indicates bearish momentum.
c. Trendlines and Channels
Trendlines connect price highs or lows to define the direction of the market. Channels are formed by drawing parallel lines above and below the trendline.
Uptrend: Higher highs and higher lows.
Downtrend: Lower highs and lower lows.
Sideways Trend: Prices fluctuate within a horizontal range.
Channels help traders identify potential reversal points or continuation of trends.
d. Technical Indicators
Indicators are mathematical calculations based on price, volume, or both. They help confirm trends, measure momentum, and identify potential reversals.
Popular Indicators:
Moving Averages: Smooth out price data to identify trends.
Simple Moving Average (SMA)
Exponential Moving Average (EMA)
Relative Strength Index (RSI): Measures the speed and change of price movements. Values above 70 indicate overbought conditions; below 30 indicate oversold.
MACD (Moving Average Convergence Divergence): Shows the relationship between two moving averages. Helps identify trend changes and momentum.
Bollinger Bands: Measure volatility by plotting upper and lower bands around a moving average. Prices touching the bands often signal potential reversals.
e. Volume Analysis
Volume indicates the number of shares or contracts traded in a given period. It confirms the strength of a trend:
Rising price with increasing volume → strong trend
Rising price with decreasing volume → weak trend, potential reversal
Falling price with increasing volume → strong bearish trend
Volume is often analyzed alongside price patterns to validate breakouts or breakdowns.
f. Chart Patterns
Chart patterns are formations created by price movements. They signal potential continuation or reversal of trends.
Common Patterns:
Head and Shoulders: Trend reversal pattern.
Double Top and Double Bottom: Indicate potential reversals.
Triangles (Ascending, Descending, Symmetrical): Represent consolidation before breakout.
Flags and Pennants: Short-term continuation patterns.
These patterns help traders predict the market’s next move based on historical price behavior.
g. Candlestick Patterns
Candlestick patterns provide insight into market sentiment over a short period.
Doji: Indicates indecision.
Hammer: Bullish reversal at the bottom of a downtrend.
Shooting Star: Bearish reversal at the top of an uptrend.
Engulfing Patterns: Strong reversal signals.
By combining candlestick patterns with support/resistance and indicators, traders enhance their decision-making accuracy.
3. Timeframes in Technical Analysis
Technical analysis can be applied across various timeframes:
Intraday: 1-minute, 5-minute, 15-minute charts.
Short-Term: Daily or weekly charts.
Long-Term: Monthly or yearly charts.
Traders choose timeframes based on their strategy:
Day Traders: Focus on intraday charts for quick trades.
Swing Traders: Use daily or weekly charts for holding positions for days or weeks.
Investors: Rely on long-term charts for position trades.
4. Combining Technical Tools
A single tool rarely provides a perfect trading signal. Successful technical analysis combines multiple tools:
Trend Identification: Determine if the market is trending or ranging.
Support/Resistance: Identify key price levels for entry or exit.
Indicators: Confirm momentum, strength, and potential reversals.
Volume Analysis: Validate the trend or breakout.
Patterns: Spot opportunities using chart or candlestick formations.
For example, a trader may buy a stock when the price breaks above a resistance level, the RSI is rising but not overbought, and the breakout is accompanied by high volume.
5. Risk Management in Technical Analysis
Even the best technical analysis cannot guarantee profits. Risk management ensures traders protect their capital.
Stop-Loss Orders: Automatically exit losing trades at a predetermined level.
Position Sizing: Adjust trade size according to risk tolerance.
Risk-Reward Ratio: Ensure potential reward is higher than potential risk (e.g., 2:1 ratio).
Diversification: Avoid concentrating all trades in one instrument or sector.
Proper risk management is critical for long-term trading success.
6. Psychological Aspect
Markets are influenced by human emotions—fear, greed, hope, and panic. Technical analysis helps traders remain objective:
Follow predefined rules for entry and exit.
Avoid trading based on emotions or news hype.
Stick to trend direction and signals.
Emotional discipline combined with technical tools improves consistency.
7. Limitations of Technical Analysis
While technical analysis is powerful, it has limitations:
No Fundamental Insight: Ignores company performance, earnings, and economic factors.
Subjectivity: Interpretation of charts and patterns can vary between analysts.
False Signals: Breakouts or reversals can fail.
Market Manipulation: Large participants can influence price temporarily.
Traders often combine technical and fundamental analysis to mitigate these limitations.
8. Practical Application: How to Start
Choose a Market: Stocks, commodities, Forex, or cryptocurrencies.
Pick a Charting Platform: TradingView, Zerodha Kite, MetaTrader, etc.
Learn Price Patterns and Indicators: Begin with support/resistance, trendlines, and moving averages.
Paper Trade: Practice without risking real money.
Develop a Strategy: Include entry/exit rules, stop-loss, and position sizing.
Analyze Performance: Keep a trading journal to track successes and failures.
9. Advanced Concepts
After mastering the basics, traders can explore:
Fibonacci Retracement: Identify potential reversal levels.
Elliott Wave Theory: Predict market cycles using waves.
Market Profile & Volume Profile: Advanced volume-based analysis.
Algorithmic Trading: Automated execution using technical indicators.
10. Summary
Technical analysis is a toolkit that allows traders to forecast market movements based on price and volume data. Its foundation lies in understanding trends, support/resistance, chart patterns, and indicators, combined with disciplined risk management and psychological control. While it does not guarantee success, a structured approach increases the probability of making profitable trades.
By consistently applying technical analysis, traders can:
Identify opportunities in trending and range-bound markets.
Time entries and exits effectively.
Minimize losses through disciplined risk management.
Improve confidence in trading decisions.

Fundamental Analysis in Trading1. Introduction to Fundamental Analysis
Fundamental analysis is based on the principle that a stock or asset has a true intrinsic value. The market price can often deviate from this intrinsic value due to short-term sentiment, speculation, or market inefficiencies. By analyzing the underlying factors that drive a company’s performance, traders can determine whether a stock is undervalued, overvalued, or fairly priced.
1.1 Difference Between Fundamental and Technical Analysis
Fundamental Analysis (FA): Focuses on why a stock should rise or fall over the long term. Considers financial statements, economic conditions, and industry trends.
Technical Analysis (TA): Focuses on how a stock moves in the short term. Uses charts, patterns, and indicators to predict price movements.
While TA is more suited for short-term traders, FA is preferred by long-term investors or swing traders who want to understand the real value of an asset.
2. Key Components of Fundamental Analysis
Fundamental analysis can be divided into microeconomic and macroeconomic factors.
2.1 Microeconomic Factors
These relate to the company or asset itself, including:
Financial statements: Balance Sheet, Income Statement, and Cash Flow Statement.
Management quality: Experience, track record, and corporate governance.
Products and services: Market demand, competitive edge, and innovation.
Competitive position: Market share, brand strength, and barriers to entry.
Profitability and growth potential: Revenue growth, margins, and scalability.
2.2 Macroeconomic Factors
These relate to the broader economy, affecting all companies in a sector or region:
GDP growth: Indicates overall economic health.
Interest rates: Affect borrowing costs and investment attractiveness.
Inflation: Influences consumer spending and company costs.
Exchange rates: Important for companies with international operations.
Political stability and regulations: Impact business operations and investor confidence.
3. Financial Statements and Their Importance
Financial statements are the core of fundamental analysis. They provide quantitative data about a company’s performance and financial health.
3.1 Income Statement
The income statement (profit and loss statement) shows a company’s revenue, expenses, and profit over a period.
Revenue (Sales): Total income from products/services.
Cost of Goods Sold (COGS): Direct costs of production.
Gross Profit: Revenue minus COGS.
Operating Expenses: Marketing, salaries, R&D.
Net Income: Profit after all expenses and taxes.
Example:
A company with growing revenue and net income over 5 years indicates strong operational performance.
3.2 Balance Sheet
The balance sheet provides a snapshot of a company’s assets, liabilities, and equity at a point in time.
Assets: Resources the company owns (cash, inventory, equipment).
Liabilities: Debts or obligations (loans, accounts payable).
Equity: Owners’ stake in the company (Assets − Liabilities).
Example:
High cash reserves and low debt often indicate a financially stable company.
3.3 Cash Flow Statement
This statement tracks cash inflows and outflows in three categories:
Operating Activities: Cash from core business operations.
Investing Activities: Cash spent or earned on assets and investments.
Financing Activities: Cash from loans, dividends, or share issuance.
Example:
A company may report profits but have negative cash flow, signaling potential liquidity issues.
4. Key Financial Metrics for Analysis
Several ratios and metrics help traders interpret financial statements:
4.1 Profitability Ratios
Gross Margin: Gross Profit ÷ Revenue × 100
Indicates how efficiently a company produces goods.
Net Margin: Net Income ÷ Revenue × 100
Shows overall profitability.
Return on Equity (ROE): Net Income ÷ Shareholders’ Equity
Measures how effectively shareholders’ money generates profit.
4.2 Liquidity Ratios
Current Ratio: Current Assets ÷ Current Liabilities
Shows short-term debt-paying ability.
Quick Ratio: (Current Assets − Inventory) ÷ Current Liabilities
More stringent liquidity check.
4.3 Debt Ratios
Debt-to-Equity (D/E): Total Debt ÷ Shareholders’ Equity
Measures financial leverage.
Interest Coverage Ratio: EBIT ÷ Interest Expense
Assesses ability to pay interest.
4.4 Efficiency Ratios
Inventory Turnover: COGS ÷ Average Inventory
Indicates how quickly inventory sells.
Receivables Turnover: Net Credit Sales ÷ Average Accounts Receivable
Shows efficiency in collecting payments.
5. Valuation Methods
After analyzing financial health, the next step is valuation, which estimates the stock’s intrinsic value.
5.1 Discounted Cash Flow (DCF)
DCF estimates the present value of future cash flows:
Project future cash flows.
Discount them using a required rate of return.
Sum the discounted cash flows to get intrinsic value.
Insight: If DCF value > market price → undervalued; if DCF < market price → overvalued.
5.2 Price-to-Earnings (P/E) Ratio
P/E ratio = Market Price ÷ Earnings per Share (EPS)
High P/E → Market expects growth, or stock is overvalued.
Low P/E → Potential undervaluation, or growth concerns.
5.3 Price-to-Book (P/B) Ratio
P/B ratio = Market Price ÷ Book Value per Share
Useful for asset-heavy industries.
Low P/B can indicate undervaluation.
5.4 Dividend Discount Model (DDM)
DDM values companies based on future dividends:
Estimate future dividends.
Discount them to present value.
Suitable for stable dividend-paying companies.
5.5 Other Ratios
EV/EBITDA: Enterprise Value ÷ Earnings Before Interest, Taxes, Depreciation, and Amortization.
PEG Ratio: P/E ÷ Earnings Growth Rate, adjusts for growth expectations.
6. Industry and Sector Analysis
Analyzing a company in isolation is not enough. Industry and sector trends can significantly affect performance.
Growth Industry: Fast-growing sectors like technology may justify high valuations.
Mature Industry: Slower growth sectors may offer stability and dividends.
Competitive Landscape: Number of competitors, entry barriers, and pricing power.
Cyclical vs Non-Cyclical: Cyclical industries (automobiles, real estate) follow the economy, while non-cyclical (food, healthcare) remain stable.
Example:
During an economic boom, cyclicals may outperform, whereas during recessions, defensive stocks are preferred.
7. Economic and Market Factors
Fundamental analysis also incorporates macroeconomic indicators:
7.1 GDP Growth
Strong GDP growth generally supports corporate profits and stock market performance.
7.2 Inflation
High inflation increases costs, potentially squeezing margins.
7.3 Interest Rates
Rising rates increase borrowing costs and reduce spending. Conversely, lower rates stimulate growth.
7.4 Currency Fluctuations
Important for exporters/importers, affecting revenue and costs.
7.5 Political and Regulatory Environment
Government policies, taxes, and regulations can significantly impact profitability and risk.
8. Qualitative Analysis
Numbers alone are not enough. Qualitative factors help complete the picture:
Management Quality: Leadership vision, integrity, and experience.
Brand Strength: Customer loyalty and reputation.
Innovation & R&D: Ability to stay ahead of competition.
Corporate Governance: Ethical practices, transparency, and accountability.
Example:
Two companies with similar financials may differ in future prospects based on leadership quality and innovation.
9. Steps to Apply Fundamental Analysis in Trading
Define your objective: Long-term investment vs short-term swing trading.
Select the company: Choose based on industry preference or market trends.
Collect financial data: Annual reports, quarterly statements, and filings.
Analyze financials: Use ratios, margins, and cash flow statements.
Perform valuation: Apply DCF, P/E, P/B, or other methods.
Assess macro factors: Consider economic, political, and market conditions.
Check qualitative factors: Leadership, brand, innovation, and governance.
Compare with peers: Relative valuation within the industry.
Make a decision: Buy, hold, or avoid based on intrinsic value vs market price.
10. Advantages of Fundamental Analysis
Provides a deep understanding of a company’s true value.
Helps in identifying long-term investment opportunities.
Reduces reliance on market sentiment and short-term volatility.
Useful for risk management by identifying financially weak companies.
Can identify undervalued stocks with potential for growth.
Conclusion
Fundamental analysis is a cornerstone of intelligent investing. By combining financial metrics, qualitative evaluation, and macroeconomic understanding, traders can make informed decisions that go beyond market noise. While it requires patience and diligence, FA provides a roadmap for sustainable investment and risk management.
When applied carefully, it helps traders identify undervalued stocks, avoid risky bets, and build a portfolio with long-term growth potential. Remember, in trading, knowledge is power, and fundamental analysis gives you the power to see beyond the price chart.

Candlestick Patterns Explained1. Introduction to Candlestick Patterns
1.1 What is a Candlestick?
A candlestick is a type of chart used to represent the price movement of an asset over a specific time period. Unlike traditional line charts that show only closing prices, candlestick charts display four crucial pieces of information:
Open price (O): The price at which the asset starts trading during the time frame.
Close price (C): The price at which the asset finishes trading.
High price (H): The highest price reached during the time frame.
Low price (L): The lowest price reached during the time frame.
Each candlestick consists of:
Body: The rectangular area between the open and close prices. A filled body (often red or black) represents a close lower than the open (bearish), while an empty or green body represents a close higher than the open (bullish).
Wicks/Shadows: The thin lines extending from the body, representing the high and low prices.
1.2 Why Candlestick Patterns Matter
Candlestick patterns reflect the psychology of the market. They show whether buyers or sellers are in control and help traders anticipate potential price movements. Patterns can indicate:
Trend continuation: The market is likely to keep moving in the same direction.
Trend reversal: The market may change direction soon.
Indecision: Neither buyers nor sellers have a clear advantage.
2. Types of Candlestick Patterns
Candlestick patterns are broadly categorized into two types:
Single-Candle Patterns: Formed by one candle, often signaling immediate market sentiment.
Multiple-Candle Patterns: Formed by two or more candles, providing stronger confirmation of trend direction or reversals.
3. Single-Candle Patterns
3.1 Doji
A Doji occurs when the open and close prices are almost equal, forming a very small body with long wicks. It signals market indecision and potential reversal.
Types of Doji:
Standard Doji: Open ≈ Close, wicks vary.
Long-Legged Doji: Long upper and lower shadows; extreme indecision.
Dragonfly Doji: Long lower shadow, little or no upper shadow; potential bullish reversal.
Gravestone Doji: Long upper shadow, little or no lower shadow; potential bearish reversal.
Example: After a strong uptrend, a Gravestone Doji may indicate the buyers are losing momentum.
3.2 Hammer and Hanging Man
Both have small bodies and long lower shadows, but their implications differ based on trend:
Hammer (Bullish Reversal): Appears after a downtrend. Shows that sellers pushed the price down, but buyers regained control.
Hanging Man (Bearish Reversal): Appears after an uptrend. Indicates sellers testing the market and potential reversal.
Tip: Always confirm with the next candle or technical indicators.
3.3 Shooting Star and Inverted Hammer
These are the opposite of Hammer and Hanging Man:
Shooting Star (Bearish Reversal): Appears after an uptrend, small body with long upper shadow. Indicates buyers tried to push prices up but failed.
Inverted Hammer (Bullish Reversal): Appears after a downtrend, small body with long upper shadow. Suggests buyers may be gaining control.
3.4 Spinning Top
A small body with long shadows on both sides. Reflects market indecision and weak trend momentum. Spinning tops often precede trend reversals if confirmed by the next candle.
4. Multiple-Candle Patterns
4.1 Engulfing Patterns
Engulfing patterns occur when one candle completely engulfs the previous candle's body, signaling strong momentum.
Bullish Engulfing: Appears after a downtrend. A large green candle engulfs a small red candle. Indicates buyers taking control.
Bearish Engulfing: Appears after an uptrend. A large red candle engulfs a small green candle. Indicates sellers gaining strength.
4.2 Harami Patterns
A Harami consists of a large candle followed by a smaller candle within the body of the first. It signals trend reversal or indecision.
Bullish Harami: Appears after a downtrend, small green candle within large red candle. Suggests buyers are entering.
Bearish Harami: Appears after an uptrend, small red candle within large green candle. Suggests selling pressure.
4.3 Tweezer Tops and Bottoms
Tweezer patterns are formed when two candles have equal highs or lows:
Tweezer Top (Bearish): Appears after an uptrend, equal highs indicate resistance.
Tweezer Bottom (Bullish): Appears after a downtrend, equal lows indicate support.
4.4 Morning Star and Evening Star
Three-candle reversal patterns:
Morning Star (Bullish Reversal): Downtrend → small-bodied candle → strong bullish candle. Indicates trend reversal upward.
Evening Star (Bearish Reversal): Uptrend → small-bodied candle → strong bearish candle. Indicates trend reversal downward.
4.5 Three White Soldiers and Three Black Crows
Strong trend continuation patterns:
Three White Soldiers (Bullish): Three consecutive green candles with higher closes, following a downtrend. Strong bullish signal.
Three Black Crows (Bearish): Three consecutive red candles with lower closes, following an uptrend. Strong bearish signal.
5. Candlestick Patterns in Trend Analysis
Candlestick patterns are more effective when combined with trend analysis:
Uptrend: Look for bullish patterns (Hammer, Bullish Engulfing, Morning Star).
Downtrend: Look for bearish patterns (Shooting Star, Bearish Engulfing, Evening Star).
Sideways Market: Look for indecision patterns (Doji, Spinning Top).
Tip: Patterns are not guarantees; they indicate probabilities. Always confirm with volume, support/resistance, or technical indicators like RSI, MACD, or moving averages.
6. Practical Trading Tips Using Candlestick Patterns
Confirm Patterns: Never trade based solely on one candlestick. Wait for confirmation from the next candle or trend indicators.
Combine with Support & Resistance: Candlestick patterns near key levels are more reliable.
Volume Matters: Patterns accompanied by high volume indicate stronger conviction.
Risk Management: Set stop-losses slightly beyond the wick extremes to protect against false signals.
Time Frames: Patterns work across all timeframes, but longer timeframes (daily/weekly) generally provide more reliable signals.
7. Common Mistakes Traders Make
Ignoring trend context: Trading reversal patterns against strong trends can lead to losses.
Over-relying on a single candle: Patterns should be confirmed with other indicators.
Misinterpreting Dojis or Spinning Tops: Context and location in the trend are critical.
Neglecting risk management: Even the strongest patterns can fail.
8. Summary
Candlestick patterns are a powerful tool for traders when used correctly. They visually depict market psychology and help forecast potential price movements. Key takeaways:
Single-Candle Patterns indicate immediate sentiment (Hammer, Doji, Shooting Star).
Multiple-Candle Patterns provide stronger signals (Engulfing, Morning Star, Three Soldiers).
Trend Confirmation increases reliability.
Support, Resistance, Volume, and Indicators enhance accuracy.
With practice, traders can read market sentiment quickly and make more informed decisions. Candlestick analysis is not a standalone solution but a vital part of a comprehensive trading strategy.