ICICIBANK - Inverted Head & Shoulder suggests 1450ICICI Bank has completed a clean Inverted Head and Shoulders pattern on the 4H chart, signalling a possible trend reversal after the recent downtrend. The left shoulder formed near 1360 , the head at 1317 , and the right shoulder at 1354 . All three points reflect stronger structure and consistent buying interest on dips. The stock has now crossed the neckline around 1387–1390 , a zone where it faced repeated rejection earlier. This breakout shows that buyers have finally taken control.
If the price continues to hold above the neckline, momentum is likely to push it toward the projected target of 1440–1450 , which matches the “final destination” zone shown on your chart. The breakout would lose strength only if the price falls back below 1387 , but unless that happens, the pattern suggests the move still has room to extend higher.
Icicibanklong

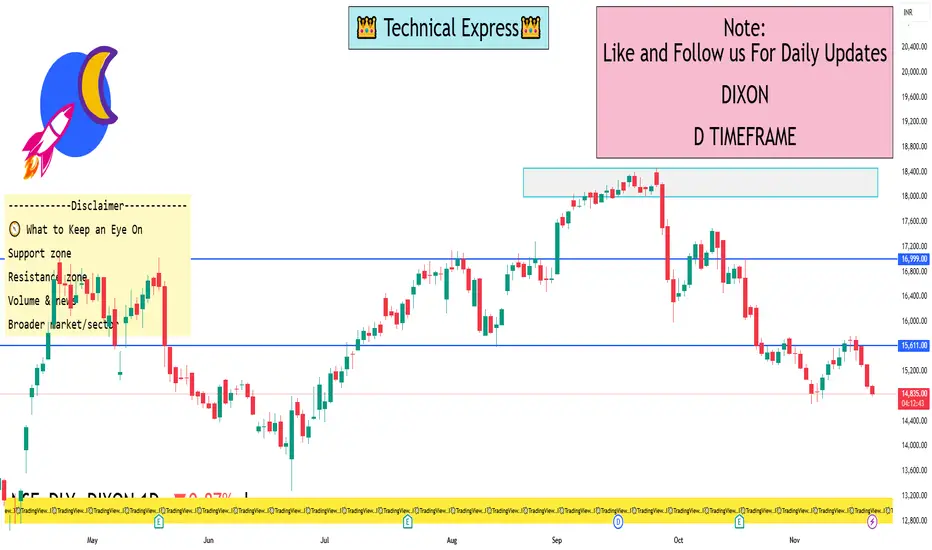
DIXON 1 Day Time Frame 🔍 Price & Pivot Levels to Watch
1. Latest live price: ~ ₹14,825 (as of intraday in India) from Groww.
2. Pivot levels (classic) for the day (based on Moneycontrol data):
Pivot ~ ₹15,065
S1 ~ ₹14,820
R1 ~ ₹15,209
3. Key moving-average resistances:
50-day SMA ~ ₹15,578 (price is below)
200-day SMA ~ ~₹15,738 – ~₹15,789 range (price is well below).
🧭 What to Keep an Eye On
Support zone: Near the S1 pivot (~₹14,820) and possibly the intra-day low zone (~₹14,700-14,800)
Resistance zone: The pivot (~₹15,065) and then R1 (~₹15,209) and the nearby moving averages (~₹15,500-15,600)
Volume & news: A sharp uptick in volume or a positive corporate/catalyst event could change the short-term dynamic.
Broader market/sector: Since Dixon is in electronics manufacturing, macro sentiment, export incentives, and input cost changes matter.
Unlock India’s Derivatives Power1. The Rise of Derivatives in India
Derivatives—such as futures, options, and swaps—derive their value from underlying assets like stocks, indices, commodities, currencies, and interest rates. India’s derivatives journey began in the early 2000s when SEBI introduced index derivatives to modernize capital markets and reduce speculation in cash segments. Over time, the market matured, attracting domestic retail traders, institutional investors like mutual funds, FPIs, and corporate hedgers.
Today, the Indian derivatives market on the NSE and BSE records billions of dollars worth of contracts daily, with index options (especially Nifty and Bank Nifty) leading global volumes. The democratization of trading platforms, reduction of brokerage costs, and increased financial literacy have further strengthened participation.
2. Why Derivatives Matter for India’s Financial System
Unlocking India’s derivatives power requires recognizing the major roles derivatives play:
a. Risk Management
Derivatives allow traders and businesses to hedge against price volatility in stocks, commodities, interest rates, and currencies.
For example:
A gold importer hedges price movements using MCX gold futures.
A portfolio manager uses Nifty options to guard against market downturns.
This reduces uncertainties in business operations and enhances economic stability.
b. Price Discovery
Futures markets incorporate expectations about future prices, interest rates, demand changes, and macroeconomic events.
For example:
Rising crude oil futures may signal anticipated geopolitical tensions.
Falling index futures may reflect market caution before major policy announcements.
Thus, derivatives become a leading indicator for spot markets.
c. Liquidity Enhancement
The derivatives market trades massive volumes daily, which increases liquidity. High liquidity ensures:
Low transaction costs
Tight bid-ask spreads
Efficient entry and exit
This attracts even more participants, creating a virtuous growth cycle.
d. Leveraged Opportunities
Derivatives allow exposure to large positions with a small margin.
However, leverage is double-edged—working for and against traders. Proper risk discipline is essential.
3. Key Segments Driving India’s Derivatives Strength
a. Equity Derivatives
These dominate India’s markets.
Index Options
Nifty and Bank Nifty options are the backbone of derivatives trading.
Advantages:
Deep liquidity
Lower manipulation risk
Suitable for hedging and speculation
Single Stock Futures and Options
Used heavily by institutional players.
b. Currency Derivatives
India’s growing global trade and foreign investments make currency futures vital for:
Exporters hedging USD/INR or EUR/INR
Importers mitigating forex risk
Traders capturing arbitrage opportunities
c. Commodity Derivatives
MCX, NCDEX, and BEE provide platforms for commodity futures across:
Metals (gold, silver, aluminium)
Energy (crude oil, natural gas)
Agriculture (soybean, cotton, sugar)
This reduces volatility for farmers, industries, and logistics players.
d. Interest Rate Derivatives (IRD)
This segment supports:
Banks
NBFCs
Corporate treasuries
IRD helps stabilize bond markets and strengthen monetary policy transmission.
4. Technological Drivers Unlocking India’s Derivative Power
India’s derivatives boom is heavily powered by technology:
a. High-Speed Trading Platforms
Advanced order-matching engines on NSE and BSE allow microsecond-level execution.
b. Algorithmic and Quant Trading
AI and mathematical models enable:
Auto-trading systems
Statistical arbitrage
Options strategies like iron condors, butterflies, spreads
These bring efficiency and sophistication.
c. Mobile Trading Revolution
Retail participation surged due to:
Zero-commission brokers
Mobile trading apps
Real-time charts and indicators
This democratizes access to derivatives for small investors.
d. Big Data Analytics
Traders now rely on:
Options chain analytics
Market depth
Implied volatility indicators
Open interest interpretation
These help decode market sentiment.
5. How Policy and Regulation Support Derivative Market Growth
a. SEBI’s Robust Regulatory Framework
SEBI ensures transparency, limits manipulation, and protects investors through:
Strict margining systems
Daily settlement
Position limits
Surveillance mechanisms
b. Stock Exchanges’ Risk-Management Systems
NSE and BSE maintain:
Real-time risk monitoring
Market-wide circuit breakers
SPAN and peak margins
These prevent destabilizing events.
c. Government Initiatives
Reforms supporting derivatives growth:
Unified market regulator
Introduction of new derivative products
Increased FPI limits
Commodity market integration with mainstream markets
6. Retail Traders: The New Power in Indian Derivatives
Retail traders now form a major part of index options volume due to:
a. Low Capital Requirements
Options require very low capital at entry compared to futures.
b. Easy-to-use platforms
Everything from charting to algo tools is readily accessible.
c. Increasing financial education
YouTube channels, apps, and online courses fuel interest.
d. Popular intraday strategies
Like:
ATM/OTM straddle-strangle
Trend-following options
Breakout futures trading
Open interest analysis
Retail participation expands market depth and liquidity.
7. Challenges Before India Fully Unlocks Derivatives Power
India must overcome several hurdles:
a. Over-Speculation Risk
Excessive speculation in weekly options can lead to:
High losses for inexperienced traders
Market volatility
b. Low Understanding of Risks
Many traders jump into derivatives without:
Risk management
Position sizing
Stop-loss planning
Education is crucial.
c. Limited Institutional Depth
While retail dominates volume, institutional participation in options is still evolving.
d. Regulatory Overhang
Frequent rule changes (like margin norms) sometimes disrupt traders.
8. The Future: Where India’s Derivatives Market Is Heading
The next decade promises massive growth through:
a. Introduction of New Products
More sectoral index derivatives
Long-term options
Interest rate swaps
Commodity options expansion
b. Retail + Institutional Balance
A healthier mix of FPIs, DIIs, and retail will bring stability.
c. Global Integration
India may become a major derivatives hub like:
Chicago
London
Singapore
d. AI-Driven Derivatives Trading
AI systems will automate:
Strategy generation
Position management
Sentiment analysis
This transforms how derivatives are traded.
Conclusion
Unlocking India’s derivatives power is not just about trading; it is about strengthening the entire financial ecosystem. Derivatives offer tools for hedging, speculation, price discovery, and economic stability. With technological innovation, rising retail participation, strong regulation, and diversified product offerings, India is positioned to become a global leader in derivatives.
For traders, investors, businesses, and policymakers, understanding derivatives is essential for navigating and benefiting from India’s fast-evolving markets. As the country continues to grow economically and digitally, derivatives will play a central role in shaping the next era of financial empowerment.
Part 2 Support and ResistanceOption Trading Strategies
This is the most exciting part. Strategies range from simple to complex.
Beginner Strategies
Covered Call: Hold stock + sell call → generates income.
Protective Put: Hold stock + buy put → insurance against fall.
Cash-Secured Put: Sell put with enough cash reserved to buy stock if assigned.
Intermediate Strategies
Vertical Spread: Buy one option, sell another at different strikes.
Straddle: Buy call + put at same strike → profit from volatility.
Strangle: Buy call + put at different strikes.
Advanced Strategies
Iron Condor: Combines spreads to profit in low-volatility markets.
Butterfly Spread: Profit from limited movement near strike.
Calendar Spread: Exploit time decay by buying long-term and selling short-term options.
Risk Management in Options Trading
Options can wipe out capital if not managed properly. Key practices include:
Position Sizing: Never risk more than a fixed % of capital.
Stop Loss & Exit Rules: Define risk before entering.
Diversification: Avoid concentrating all trades on one asset.
Understanding Margin: Selling options requires large margin because risks are unlimited.
Hedging: Use spreads to limit risk.

Part 8 Trading Masterclass With ExpertsReal-Life Example – Hedging a Portfolio
Suppose you hold ₹5,00,000 worth of Indian equities. You worry about a market correction. Instead of selling your holdings, you buy Nifty Put Options as insurance.
Nifty at 20,000
You buy Put Option at Strike 19,800, Premium = 200 × 50 lot = ₹10,000.
If Nifty falls to 19,000:
Put gains = (19,800 – 19,000) × 50 = ₹40,000
Your portfolio loss is partially offset by option profit.
This is how professionals use options for protection.
Psychological Aspects of Options Trading
Options trading is as much about mindset as knowledge:
Stay disciplined. Don’t chase every trade.
Accept losses—they’re part of the game.
Avoid greed—taking profits early is better than losing them later.
Learn patience—sometimes the best trade is no trade.
Options trading is a powerful tool in the world of financial markets. For beginners, it may look overwhelming, but once broken down into clear concepts, options are simply another way to express your view on the market. Whether you want to speculate, hedge, or generate income, options offer flexibility that stocks alone cannot match.
The key for beginners is education + risk management + practice. Start small, learn continuously, and slowly expand your strategies. Over time, you’ll realize that options aren’t scary—they’re opportunities waiting to be unlocked.
With the right approach, options trading can transform your trading journey, making you not just a participant in the markets, but a smart strategist who uses every tool available.

Divergence SecretsOption Trading in India
India has seen a boom in retail options trading.
1. Exchanges
NSE (National Stock Exchange): Leader in index & stock options.
BSE (Bombay Stock Exchange): Smaller but growing.
2. Popular Underlyings
Nifty 50 Options (most liquid).
Bank Nifty Options (very volatile).
Stock Options (Infosys, Reliance, HDFC Bank, etc.).
3. SEBI Regulations
Compulsory margin requirements.
Weekly index expiries (Thursday).
Physical settlement of stock options at expiry.
Option trading is a double-edged sword. It can create wealth through leverage, hedging, and smart strategies. But it can also destroy capital if misused without understanding risks.
The secret is balance:
Learn the basics.
Practice with small positions.
Respect risk management.
Master volatility and Greeks.
If stocks are like playing cricket, options are like playing 3D chess—complex, dynamic, but highly rewarding for disciplined traders.

Options vs Buying & Selling in TradingPart 1: Basics of Buying & Selling in Trading
1.1 How It Works
Buying (going long): The trader purchases an asset, expecting its price to rise. Profit comes from selling it later at a higher price.
Selling (going short): The trader sells an asset they don’t own (borrowing it from a broker), expecting its price to fall. Profit comes from buying it back later at a lower price.
Example:
If you buy 100 shares of Tata Steel at ₹120 and sell at ₹150, your profit = ₹30 × 100 = ₹3,000.
If you short 100 shares of Infosys at ₹1,500 and later buy them back at ₹1,400, your profit = ₹100 × 100 = ₹10,000.
1.2 Characteristics of Traditional Trading
Ownership: When you buy, you actually own the asset.
Unlimited upside, unlimited downside (in shorting): Long trades can theoretically go up infinitely, but short trades carry unlimited loss potential.
Capital intensive: You must pay the full value of the asset (unless using margin).
Time horizon: No expiry date; you can hold as long as you want.
1.3 Advantages
Simple and easy to understand.
Ownership benefits like dividends, voting rights in stocks.
No expiry pressure.
1.4 Risks
Large capital required.
Losses can be significant if the market goes against you.
Limited flexibility in terms of strategy.
Part 2: Basics of Options Trading
2.1 What Are Options?
Options are derivative contracts that derive value from an underlying asset (like stocks, indices, commodities, or currencies).
Call Option: Right to buy the asset at a fixed price (strike price).
Put Option: Right to sell the asset at a fixed price.
Options are rights, not obligations. The buyer of an option can choose whether to exercise it, while the seller (writer) is obligated to honor it.
2.2 Example of Options
Suppose Nifty is at 20,000.
You buy a Nifty 20,000 Call Option for a premium of ₹200.
If Nifty rises to 20,500 at expiry, the option’s value = 500. Profit = (500 – 200) = ₹300 per unit.
If Nifty falls to 19,500, you lose only the premium = ₹200.
2.3 Key Features
Leverage: Small premium controls a large value of the asset.
Limited risk for buyers: Maximum loss = premium paid.
Variety of strategies: Options allow profit from up, down, or sideways markets.
Time-bound: Every option has an expiry date.
2.4 Advantages
Cost-efficient way to take positions.
Hedging tool for managing risk.
Flexibility in designing strategies.
Defined risk when buying options.
2.5 Risks
For buyers: Premium decay (time value erosion).
For sellers: Potential unlimited losses.
Complexity compared to direct buying and selling.
Part 3: Options vs Buying/Selling – A Direct Comparison
Feature Traditional Buying/Selling Options Trading
Ownership Yes (when buying) No, it’s a contract
Capital Requirement High Low (premium only)
Leverage Limited (margin needed) Built-in leverage
Risk Unlimited (in shorting) Limited for buyers, unlimited for sellers
Profit Potential Unlimited upside (long) Defined, depending on strategy
Expiry None Always has expiry
Complexity Simple Complex
Uses Investing, long-term holding Hedging, speculation, income strategies
Part 4: Practical Use Cases
4.1 When to Use Traditional Buying & Selling
Long-term investing in stocks.
When you want ownership (e.g., dividends).
When you want simple exposure to price movements.
4.2 When to Use Options
Hedging: An investor holding a stock portfolio buys put options to protect against a fall.
Speculation: A trader buys calls when expecting a sharp rally.
Income generation: Selling options (like covered calls) to earn premiums.
Event trading: Using straddles/strangles during earnings announcements.
Part 5: Risk Management
5.1 In Buying/Selling
Use stop-loss orders.
Diversify portfolio.
Avoid over-leverage.
5.2 In Options
Stick to defined-risk strategies (like spreads).
Understand implied volatility.
Avoid naked option selling without capital cushion.
Part 6: Psychological Differences
Buying & Selling: Feels straightforward, intuitive. Less cognitive load.
Options: Requires strong understanding of Greeks (Delta, Gamma, Theta, Vega). Traders must accept probability-based outcomes.
Part 7: Real-Life Example Comparison
Imagine you expect Reliance to rise from ₹2,500 to ₹2,700.
Method 1 – Buying Shares:
Buy 100 shares @ ₹2,500 = ₹2,50,000 invested.
If price hits ₹2,700 → Profit = ₹20,000.
Risk: If it falls to ₹2,300 → Loss = ₹20,000.
Method 2 – Buying Call Option:
Buy Reliance 2,500 Call @ ₹50 premium = ₹5,000 invested.
If Reliance rises to ₹2,700, intrinsic value = ₹200. Profit = (200 – 50) × 100 = ₹15,000.
If Reliance falls to ₹2,300, loss = only premium ₹5,000.
Here, options gave higher percentage return with limited risk.
Part 8: Long-Term Perspective
Investors prefer buying & holding stocks, as they represent ownership in a growing business.
Traders often use options for short-term moves, hedging, and leverage.
Smart portfolios often combine both: owning core assets while using options for risk management.
Conclusion
Traditional buying and selling is like owning the road—it’s direct, long-term, and stable. Options are like renting a sports car for a specific race—cheaper, faster, but requiring skill and timing.
Neither is inherently better. It depends on:
Risk appetite
Capital available
Market view
Time horizon
Experience level
For beginners, direct buying and selling is a solid foundation. For advanced traders, options open new horizons of creativity and control.
Yatharth Hospital & Trauma Care Services Ltd. 4 Hour View4-Hour Time-Frame View – Technical Snapshot
While many platforms don’t provide a dedicated 4-hour technical summary, we can still glean insights from related intraday data—particularly from platforms like Investing.com (5-hour view) and TopStockResearch’s 4-hour-specific metrics.
Investing.com (5-Hour, closest available proxy)
Technical Summary (5-Hour): Strong Buy
Overall Summary (5 Hrs → Strong Buy) indicates strong upward momentum even over shorter intraday frames
TopStockResearch (4-Hour TSR Strength Index)
This platform provides a more granular “4-Hour” breakdown:
TSR Strength Index: Strong Bullish — YATHARTH is more bullish than 97–98% of stocks
Indicators:
RSI: ~69–70 → Buy
MACD: ~20 → Buy
ADX: ~36 → Buy
Stochastic: ~42 → (Neutral or Buy range)
ROC: ~4–5 → Buy
Supertrend: ~647 → indicating upward trend
Williams %R: Slightly negative (near overbought region)
CMF (Chaikin Money Flow): Positive (~0.13) → Buying pressure
PSAR: ~674
These inputs together reinforce a strong bullish bias over the 4-hour window
Pivot Levels (Intraday / 4-Hour Range)
TopStockResearch provides intraday pivot level analysis:
Current Price (~₹749) is trading above all primary resistance levels—including R3 (Classic), Camarilla R4, Fibonacci R3, Woodie’s R2, and DeMark R1, signaling a robust intraday breakout

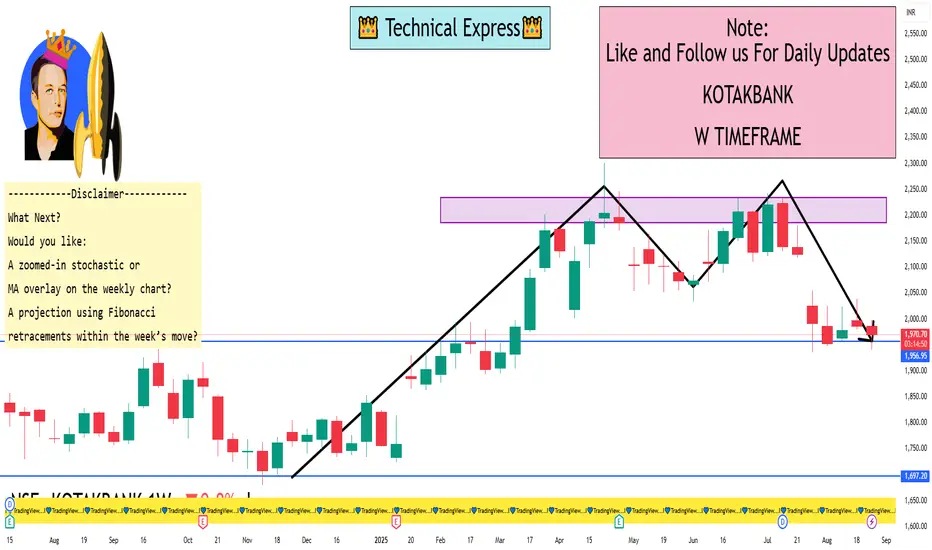
Kotak Mahindra Bank 1 Week ViewWeekly Technical Levels & Analysis
Pivot-Based Levels (from TopStockResearch)
Weekly Support Zones (Standard pivots):
S1: ₹1,964.87
S2: ₹1,943.13
S3: ₹1,906.07
Weekly Resistance Zones:
R1: ₹2,001.93
R2: ₹2,060.73
R3: ₹2,082.47
These pivot levels often act as short-term barriers and support and can help anticipate price behavior within the current weekly range.
Elliott Wave Analysis (from FXStreet)
The stock appears to be beginning Wave 3 in an Elliott Wave count—typically the strongest impulse phase.
The invalidating level for this bullish count is pegged at ₹1,681. As long as the price stays above this, the bullish structure remains valid.
This suggests strong upward potential in the medium term.
Trading Master Class With ExpertsRisks in Options Trading
Time decay eats premium if direction isn’t quick.
Volatility crush reduces premium post-events (like RBI policy).
Unlimited risk for sellers if market moves sharply.
Liquidity issues in some stock options.
Options Trading Psychology
Requires discipline & patience—most beginners lose by overtrading.
Emotions like fear of missing out (FOMO) or greed destroy capital.
Successful option traders often specialize in 1–2 instruments (e.g., Bank Nifty weekly options).
Role of Retail vs Institutional Traders
Retail traders mostly buy options (lottery-ticket approach).
Institutions & HNIs dominate selling (because they can hold margins).
Data shows: retail traders lose premium, institutions earn it—but smart retail traders can also make money by following disciplined strategies.

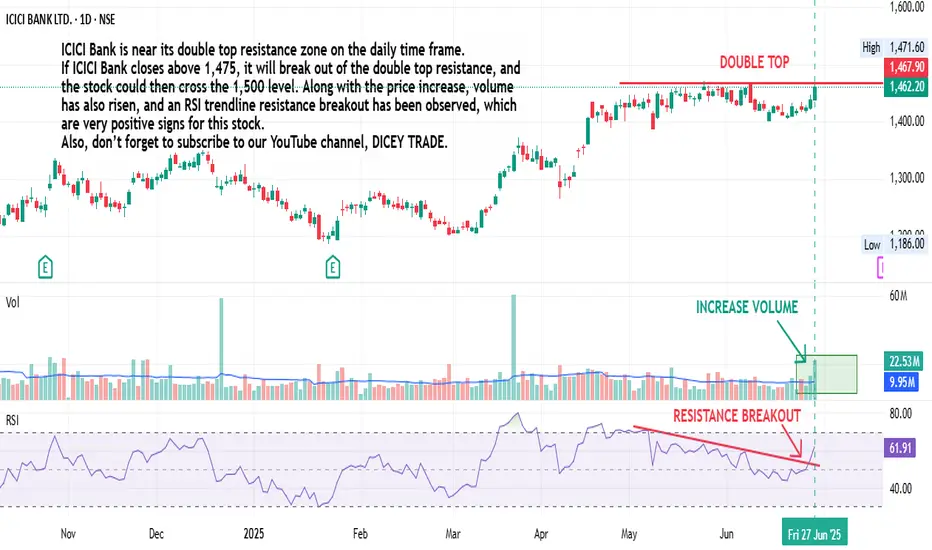
ICICI BANK Double Top Breakout: Is a Major Price Surge Ahead? ICICI Bank is near its double top resistance zone on the daily time frame. If ICICI Bank closes above 1,475, it will break out of the double top resistance, and the stock could then cross the 1,500 level. Along with the price increase, volume has also risen, and an RSI trendline resistance breakout has been observed, which are very positive signs for this stock. Also, don’t forget to subscribe to our YouTube channel, DICEY TRADE.
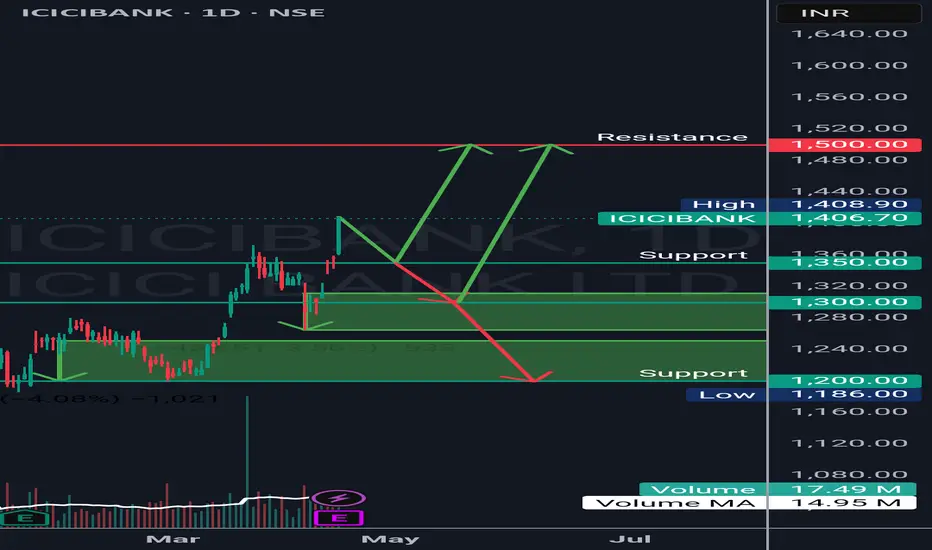
ICICI Bank A New Life Time HighICICI has made a new life time high.
It's now 1406
Its target could be 1500
But who ever wants to enter the rally should wait for it to retrace till 1350 and then check the price action.
If it gives bullish view enter with SL 1300 Target 1400 and Trail till 1500
If it gives bearish view then wait till 1200
ICICIBANK LOOKING GOOD TO SOAR HIGHICICIBANK is currently trading at 1328.75, showcasing a strong breakout and successful retest at a critical level, where the previous resistance has now turned into support. The stock has consistently performed exceptionally well since its inception, supported by great fundamentals and a solid technical setup. With this bullish momentum, a significant rally could be on the horizon in the coming weeks. The levels and targets for both short-term and long-term trades are clearly defined and promising.
P.S. The long-term outlook extends until the end of next year.

ICICI Bank cmp 1269.30 by Daily Chart viewsICICI Bank cmp 1269.30 by Daily Chart views
- Support Zone 1242 to 1257 Price band
- Support at 1231 > 1193 > 1155 with Resistance at 1299 > 1331 > ATH 1362.35
- Stock Price trailing along Rising Support Trendline with attempts to Test Retest Support Zone
- Volumes are steady and stable but need to increase for upside momentum continuity else breakdown is probable

ICICI PRU LIFE#icicipruli *
Trade type- all time high
Timeline-15 days
Target potential - 250 ruppe/19%
$ pattern - reverse head and sholder
And cup and handle with elliot wave 12345 etc..Multiple pattern see in ine
► fii/dii makes ath...
Key points-
Entry - 750
9o sl-735
Target- 999/1000/1200
U can also hold long term

25th Oct 2024 - IndusInd lower circuit, ICICI Bank will save us?BankNifty Stance Bearish ️⬇️
BN has fallen only 2.46% ~ 1283 points and is much better than Nifty on a relative basis. IndusInd Bank took a huge beating on Friday as it fell ~ 18.63% due to poor quarterly results. Indian stock markets are not used to such wild reactions, but if our markets start punishing stocks for bad results, I guess it is much better for the future. Ideally, such reactions on stock prices will keep the management on their toes to avoid poor results thereby helping them put in the necessary hard work to achieve the desired results.
ICICI Bank will react to its results today, since we are in a bearish hold, would like to see if Sell on Rise is applicable on this scrip. The main point to consider is that ICICI has more than 27% weightage on BankNifty and is single handedly capable of bringing out BN from the Bear hold.
51101 is my first resistance level above which I will change the stance to neutral. For real bearish momentum to pick up, we need to fall below 49704.

ICICI BANK ANALYSISDaily Chart:- ICICI BANK is on a verge of breakout on Daily Chart . Expecting tgt of 1150 in coming days with a SL of 796. R:R is not favorable to enter longs but existing positions can definitely with trailed.

BANKNIFTY VIEW : WEEK AHEAD The chart indicates a buy signal for the near term.
given that the market saw a significant consolidation rejection at the lower end
support ! @ 45600-45800
next zone: 47350–47600 aREA
Banks that may support = hdfc bank, icici bank ,
neutral: axis bank
weak: kotak bank

20 Jan ’24 — Will Quarterly results help the BankNifty bulls?BankNifty Analysis - Stance Bearish ⬇️
For some or the other reason, the 4mts & 63mts charts are not visible on TradingView. It may be due to this unscheduled working day and they might be facing issues with data feeds from vendors. We had a bearish view yesterday also and despite BN ending the day today with 357pts ~ 0.78% we are still maintaining the bearish stance.
16mts chart
A shallow support and resistance zone has formed between 45609 and 46025. The first critical support is unchanged at 45399 and the critical resistance at 47465. BankNifty was single-handedly responsible for limiting the losses on Nifty today - so we need to give due credit for that. But take a look at the chart - The fall from 48000+ levels did not just come because HDFCBK had poor results, it may be unwinding by FIIs considering the fiscal policy changes or reforms expectations for Budget 2024. So even if we have super duper results like the KOTAKs and ICICIs - we may not scale up that quickly. Honestly, we prefer if BN could reclaim the ATHs and support Nifty to crawl back into the channel. The US market hit a new ATH yesterday - SPX and the mood is euphoric.

ICICI Bank Swing Trade | Wave BreakoutWave Breakout
Buy Above - 946+
SL - 930
Target - 1000+
Note - Only for education purpose

ICICIBANK 1H TFAs of it is neutral.. will wait for a hammer candle or huge wick's before going long.

QUICK ANALYSIS ON ICICIBANKDear Indian Traders and Investors, I made a quick analysis for you on ICICIBANK to let you know that you still can buy it since the market is following the strong support level that it couldn't break for the past 3 years, and the price will go for longer.
The comment secion is all yours for further questions!

ICICI BANK Cup & Handle BreakoutICICIBANK Cup & Handle Breakout "But"
Weekly Closing Required Above 1001.5
Buy Above Weekly Close 1001.5
SL - 952 ( Weekly Closing )
Target - 1121
