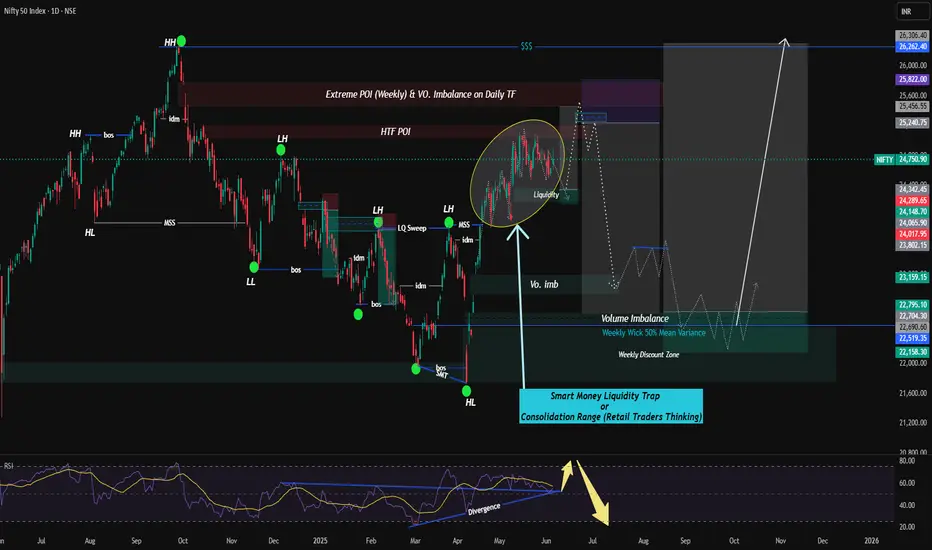
Nifty Analysis - Smart Money Concepts or LiquidityI would like to present my Nifty Analysis based on Liquidity or Smart Money Concepts.
This Analysis is based on Multi-time frame (Weekly & Daily) Time Frame. here chart is used on Daily Time Frame.
Current Scenario - (Weekly TF Analysis)
==Weekly Time Frame Analysis -
The current move is retracing into a weekly POI zone which also has-
-Daily Imbalance
-HTF Supply Block
-Smart Money Trap Zone (marked)
Right now, HTF is still in broad bearish retracement structure.
==Daily TF Annalysis -
-Price is consolidating in a range within a clearly defined HTF POI (High Probability Reversal Area)
-Inside the range:
-Multiple internal BOS & MSS
-Clean liquidity pool build-up (marked in yellow)
-Potential for buy-side liquidity sweep followed by sell-off into discount
Price Projection & Bias -----
1. Short-Term Bias (Next 3–5 Weeks): Downside after Extreme POI liquidity grab
-Expectation is there will be a Fakeout above the liquidity pool (25,500–25,800), or in retail language say it is Stop Loss Hunt then sell-off.
-Target: Volume Imbalance near 23,200–22,700.
-This will be aligned with - Liquidity sweep , Mitigation of volume imbalance , Entry into Weekly Discount Zone.
2. Mid-Term Bias or say 2-3 months expectation (After Re-accumulation)
-If price reacts with storng bullish order flow from 22500-22000 range then expect -
-Reversal into bullish structure
-Target - 26200 or 26400
-Supported by mean reversion + reaccumulating idea
(For Entry Module)
- Consider 15min to 1 hour Time frame setup for confirmation before taking shorts from above supply zone.
- expect a long setup around 22200-22400 only if bullish BOS + FVG Filled and also consider HTF Liquidity sweep near weekly wick discount zone or say 50% mean reversion.
Disclaimer -- (Views are only for Educational Purpose only. Always consult your financial Advisor before doing Any Investments).
Your Views or Comments are welcomed.
Ict
EURUSD ANALYSIS
Weekly bias is bearish
Daily bias is up to liquidity point 1.16321
Then it will swipe the weekly candle and then give big push on bearish side beacause weekly bias is not done yet

Weekly Review for US Indices. Bearish.Hello traders!
I've mentioned everything on the chart itself. Attaching YM and ES charts as well.
YM
ES
Note that if YM breaks Thurday's high, analysis of NQ and ES will be negated as well.
GLGT!
AUDNZD 2H Chart Analysis – Trendline Break + Supply Zone Rejecti🧾 Market Context:
Pair: AUDNZD
Timeframe: 2H (2-Hour)
Overall Bias: Bearish
Setup Type: Trendline Break → Lower High Formation → Supply Zone Retest → Bearish Continuation
📊 Technical Breakdown:
🔸 1. Trendline Break:
A steep ascending trendline has been broken decisively, marking a clear end of bullish structure.
This shift indicates that buyers have lost control and bears are stepping in.
🔸 2. Retest of Supply Zone (Breaker Block):
After breaking the trendline, price retraced into a supply zone (highlighted in grey).
This zone also acts as a breaker block – price broke support, and now it’s acting as resistance.
Rejection from this area confirms institutional selling pressure.
🔸 3. Lower High Formation:
The price failed to break back above the supply zone, forming a lower high, which is a classic bearish market structure signal.
Trendline retest + supply zone rejection together give confluence.
🔸 4. Bearish Projection Path:
Your chart outlines a clear path of expected price movement:
Minor bounce from intermediate demand (1.0780–1.0790)
Continuation downward toward final target zone at 1.0650–1.0660
🔽 Entry & Trade Plan:
Parameter Details
Entry Area 1.0820 – 1.0840 (confirmed rejection)
Stop Loss Above 1.0855 (above the supply zone high)
Target 1 1.0770 – 1.0780 (intermediate demand zone)
Target 2 1.0650 – 1.0660 (major demand zone)
RR Ratio Around 1:3 to 1:4 depending on entry
✅ Bearish Confluences:
✅ Trendline break + retest
✅ Supply zone rejection
✅ Lower high formation
✅ Bearish engulfing candle post-retest
✅ Clear break of structure (BOS)
✅ Liquidity sweep above previous high before dumping
⚠️ Invalidation Criteria:
If price closes above 1.0855 on a 2H/4H candle, it invalidates the bearish setup.
In that case, reanalyze for potential continuation or false breakout.
📈 Visualization Path:
🔹 Current price is consolidating slightly below the retest zone.
🔹 You anticipate a drop to intermediate support, possible small bounce, then continuation to major target.
🧠 Professional Summary:
This is a textbook bearish trend reversal setup:
Break of bullish trendline
Supply zone retest and rejection
Structure shift to lower lows/lower highs
Bearish order flow developing
If momentum follows through, your TP at 1.0650 is very realistic.

XAUUSD Bullish Breakout with Retest & Rally Setup (1H Chart) Pair: XAUUSD (Gold vs US Dollar)
Timeframe: 1 Hour (1H)
Market Bias: Bullish
Strategy Type: Trendline Breakout + Order Block Retest + Liquidity Sweep + Momentum Continuation
📊 Technical Analysis:
🔹 1. Trendline Breakout:
A major descending trendline (bearish structure) was cleanly broken with strong bullish momentum.
This is a market structure shift and indicates potential trend reversal or at least a short-term bullish rally.
🔹 2. Break of Structure & Demand Zones:
Price broke above a key resistance zone (previous supply) around 3360, turning it into support/demand.
A new bullish order block (OB) is visible just below current price (~3340–3350), now acting as an entry zone.
A lower OB zone (~3300–3320) has been left unmitigated, which could act as a second deeper entry point if price retraces further.
🔹 3. Imbalance/Fair Value Gap (FVG):
There is a clean imbalance left between the current price and the lower OB. Price may wick into this zone before rallying.
This imbalance is acting like a magnet and could invite a retracement into the 3340–3320 zone.
🔹 4. Liquidity Engineering:
Buy-side liquidity was likely swept above the trendline break and recent highs.
Sellers trapped above the trendline may give fuel for a deeper push toward the next supply zone.
🔹 5. Target Supply Zone:
A clean and unmitigated supply zone lies between 3480–3500, the ultimate target for bulls if momentum sustains.
📍 Key Levels:
Type Price Range (Approx)
Current Price 3360.90
Entry Zone 1 (OB 1H) 3340 – 3350
Entry Zone 2 (OB 1H) 3300 – 3320
Target Supply Zone 3480 – 3500
Invalidation Below 3300
🎯 Trade Idea:
Entry: On bullish confirmation at 3340–3350 or deeper at 3300–3320
Stop Loss: Below 3300 (structure break + OB invalidation)
Target: 3480–3500 (clean supply zone above)
Risk-to-Reward (R:R): ~1:3 to 1:5 depending on entry zone
✅ Confluences Supporting This Setup:
✅ Trendline break + retest setup
✅ Price flipped previous resistance into support
✅ Strong bullish impulse breaking structure
✅ Bullish Order Block + Fair Value Gap (FVG) below price
✅ Clean upside liquidity pool in untested supply zone
✅ Momentum breakout candle confirms buyer strength
⚠️ Invalidation Criteria:
Breakdown and 1H close below 3300 invalidates the OB and bullish structure.
Be cautious around NFP or Fed-related news, which may spike volatility.
🔁 Potential Scenarios:
📈 Bullish Continuation:
Price retests OB (3340–3350), finds support, and rallies directly to 3480–3500.
🔁 Deeper Retracement:
Price may wick into the lower OB at 3300–3320 to grab liquidity, then rally.
❌ Invalidation:
Breakdown below 3300 = bearish reversal or deeper correction incoming.
📘 Summary Table:
Parameter Value
Bias Bullish
Entry Zone(s) 3340–3350 (primary), 3300–3320
Stop Loss Below 3300
Take Profit 3480–3500
Strategy Trendline Break + OB Retest + Imbalance
Confluences Break of Structure, Demand Zones, FVG, Trendline Break

XAUUSD Intraday Liquidity Flow – Key Intraday Triggers
If price breaks the current low and forms a new low during the NYC session, wait patiently for a Market Structure Shift (MSS) before entering.
Daily High (DH) is not tested yet – potential target for price.
If change in direction with good displacement (forming FVGs): Consider taking profit at Daily High (DH).
OANDA:XAUUSD
Fibre/EURUSD ready to move higher...Hello traders!
There is so much on the Daily chart of Fibre that points to obvious bullishness of the market that I could not place all of it on the chart. But I have marked what seemed crucial to be seen.
Market has taken smooth lows of 15th, 16th, 17th, & 20th January, 2025 and strongly rejected from 1.02113 . Also, observe how 20th January's daily candle shifted the market structure . We're inside a Bullish breaker on the daily, supported by a daily ifvg (check how the market has respected the consequent encroachment of that gap perfectly).
Things don't end here. DXY has broken the range to the downside with lower draws. Market symmetry is currently missing but Fibre should follow DXY soon.
The draw and the targets for the weekly range have been marked on the chart. Equal highs is the low hanging fruit.
Narrative is paramount when it comes to applying ICT concepts. That takes a lot of practice and time. Having said that, let's discuss when this idea will be marked as failed. 3 PDAs. If 3 PDAs fail on the daily timeframe, I'll not engage the market and wait for more feedback from the market.
Have a wonderful and learning-oriented week.
GLGT.
Looking for sellside in USDJPY...Hello traders!
Yen gave the draw targets as I had previously outlined on X and TradingView & now we're looking for sellside.
As long as price is held below the daily ifvg, I'm bearish.
Already executed a scalp today on the 15 seconds chart in alignment with the said draw.
Not financial advice.
GLGT.

USDJPY running for buystops... Hello traders!
One of the models I use got triggered on the 1h timeframe once the breaker failed. Expected draw and everything else mentioned on the chart pretty clearly.
I expect the market to reach the buystops resting at 150.739 , and expect the market to tap into the daily ifvg and the daily sibi .
For the daily -ifvg to act as proper inversion, I don't expect teh market to trade above the CE of the gap and hence the expected target of 150.810 .
Not financial advice.
GLGT.

Nifty laying traps... another one for sellers...Hello Traders!
The market is constantly trapping sellers without moving to the downside. Right now, nothing in draw on liquidity is obvious. It, frankly, can go either ways . And what does it mean when we can frame both sides of market using ICT concepts? It means that we have LOW PROBABILITY conditions . I'm sitting on the sidelines until the market gains clarity, favouring buyside delivery.
As long as the invalidation low of 22725 holds, my bias would remain bullish . Once that low is taken, I'm not interested in price and would wait for the market to provide more info.
When it looks that it can go either ways, the market structure gets filthy and PRECISION leaves the chat. WAIT FOR MORE CLARITY . Or gamble . It's absolutely your choice .
Have a safe trading day.
GLGT.

Nifty ready to move higher...Hello traders!
The market delivered exactly as we had expected for yesterday's trading. I've mentioned in the video idea what is to be expected for today's trading.
Not financial advice.
GLGT.

Sit STILL today! Let the GAMBLERS sacrifice themselves to LUCK.Hello traders!
Hope you find this video analysis helpful.
Not financial advice.
GLGT.

Pulling the Elephant by the tail...Hello traders!
Sellside has been delivered... Any shorts now are in grave jeopardy... Chasing the market at this point is like pulling the ELEPHANT by the tail and expecting it to get pulled...
In short, enjoy the weekend now and kill all short positions... Sellers in jeopardy for the last hour of trading... Market repricing to 22922 and above.
GLGT.
Not financial advice....

Nifty about to TRAP longs... Bullish? Think AGAIN!Hello traders!
I'm looking at equal lows/sellside as the draw. My narrative is that we would take out any longs remaining with BUYSIDE at 23144.70 .
If we gap up above buyside, which is what I expect, it would be an easy day for shorts.
If we gap down, we may see a rush up to buyside and then take the move forward to SELLSIDE at 22786.90 .
But whatever the gap scenario is, my draw remains towards 22786.90...
GLGT!
Not financial advice.

WILL THIS ORDER BLOCK HOLD AND REVERSE THE PRICE OR NOTWhether an order block will hold and reverse the price cannot be guaranteed; while it indicates a potential area for price reversal due to accumulated buy or sell orders, several factors like market conditions, price action, and volume need to be considered to assess the likelihood of a reversal at that level

WILL THIS BEARISH ORDER BLOCK HOLD THE PRICE OR NOT.To evaluate whether a bearish order block will hold the price, it typically need to consider several factors, including:
1. **Market Context**: Understand the current market sentiment (bullish or bearish) and trend. Is the overall market in a downtrend, or is there potential for a reversal?
2. **Time Frame**: The significance of an order block can vary depending on the time frame you’re analyzing. Higher time frames (like daily or weekly) usually carry more weight than lower time frames (like hourly or 15 minutes).
3. **Price Action**: Look at the price action leading up to the order block. Is there momentum in either direction? Are there significant support or resistance levels nearby?
4. **Volume**: Analyze trading volume around the order block. High volume may indicate stronger conviction in the price action, while low volume could suggest a lack of interest.
5. **Market News and Events**: Economic releases, earnings reports, or geopolitical events can impact price behavior and may affect whether an order block holds.
6. **Liquidity**: Ensure that the market has enough liquidity to sustain price levels around the order block.
Always conduct thorough analysis and consider risk management practices in trading.

a bearish order block failed to hold the price in it. Here’s an analysis of the situation:
Bearish Order Block Defined:
The bearish order block is the last bullish candle before a significant downward movement, often acting as a supply zone where sellers are expected to be strong.
Reasons for the Wick Break:
Liquidity Grab (Stop Hunt): The wick could represent a liquidity grab, where price briefly breaks above the bearish order block to trigger stop-loss orders placed by sellers or to entice breakout buyers before reversing.
Market Imbalance: There could have been a need to fill orders at higher levels due to prior inefficiencies or imbalance in the market.
Strong Bullish Momentum: If buyers were dominant, the bearish order block might have failed to hold the price, albeit temporarily.
News or Economic Events: Unexpected news or data releases could cause a spike in volatility, leading to such wick formations.
Outcome of the Wick:
Following the wick, it seems the price returned below the bearish order block, indicating that it was likely a false breakout or liquidity grab, and the bearish order block remained relevant.
I also love to here more solutions from you. Feel free to comment...

BTCUSDTBTC is in consolidation, so only small moves can be expected for a while. i think it will take the equal highs above and also 15 min liquidity. as it did not respect the 1h FVG, so the price may drop.

Gold View, XAU/USD 13th NOVGold - Gold has a changed it's structure now .
It's will should a pullback to it's Supply zone marked on this image.
Expecting it to continue it's down move now from the POI.
This Is My Personal Analysis, It's not a Tip.

A quick retracement; contrary move in AUDUSD...Greetings fellow traders!
Bullish Purge and Revert in progress in AUDUSD. The purging 4h candle's high is broken and we have the confirmation. Long till 0.66599 .
Do remember this is a contrary move , against the bias . Traders are professional losers . Be professional .
Have an insightful trading week ahead!
Disclaimer- All content is for educational purposes only and not trading advice.

All we need is just one concept... AUDUSD bearish...Greetings fellow traders!
I was originally bullish on AUDUSD, until I hit consistent stops on my longs which pushed me to check higher timeframes for clarity and bias . I really love the Purge and Revert concept as it's easy to spot and trade. The 2022 model combined with P&R...
Trading is simple, but not easy . The more we complicate it, the tougher it gets.
Have an insightful trading week ahead!
Disclaimer- All content is for educational purposes only and not trading advice.

Yen to go bulls till 162... Greetings fellow traders!
I have always been majorly bullish on the Yen. I expect to see it tap 200.000 some time in the future. But that's just a weak expectation and not a proper forecast. Let's get into what 'my' forecast is.
Yen swept the sellside liquidity below 140.000 , which was Dec'23 swing low, in Sep'24. The structure shifted on the weekly timeframe (marked as wmss) with a strong bullish marubozu type bar, showing the excitement and strength of the market.
The seasonality of Yen tells us that the pair tends to peak around November-December . Now, if we club this with the current scenario and data, we can expect market to hit 162.000 before New Year 2025 . Is that a necessity? Of course, no. But that is what we expect after reading the market. What does @I_Am_ICT always say? The market does not have to get to where we want it to go, to be profitable.
The major concept that I've applied in the whole analysis is Purge and Revert on the monthly timeframe & clubbed it with various other scenarios and timeframes to conclude to this analysis. There are certain levels and imbalances which can be of value and have been marked on the charts attached. One may refer to them for more info. Trading conversations are welcome.
PS- It can be expected, looking at the daily and LTFs, that some retracement into discount prices is possible before a rally.
Have an insightful trading week ahead!
Disclaimer- All content is for educational purposes only and not trading advice.

SMT between NIFTY and IT?Have been back-testing indulging in ICT/SMC concepts and have been noticing bearish SMTs/divergences being formed between BANK, IT and NIFTY (higher highs and lower lows) every time NIFTY proceeds to correct heavily.
Seeing how IT dumped relative to NIFTY's run today, I was hoping to find something like this.
Could be context to an incoming correction.
-GSS
