Resistance to Flip + Equilibrium Mastery: Pure Price ActionLeft Chart (Monthly TF):
- Classic resistance-turned-support flip. Price tested this level multiple times historically (data >3 months old), holding firm as dynamic support. Proof that prior barriers evolve with pure price behaviour.
Right Chart (Weekly TF):
- Equilibrium at 0.5: Stock has danced around this pivot, building multiple resistances above/below—trading in balance like clockwork.
- Parallel Channel Magic( Red lines ): Counter-trendline + parallel upper line forms a textbook channel, showcasing how price respects geometry over time.
- Respected Demand Zone (Green): Multiple bounces here confirm its strength—demand alive and kicking historically.
Disclaimer: This is for educational purposes only, showcasing historical price action (>3 months old). Not financial advice, trade recommendations, or predictions. Always DYOR and trade at your own risk.
IDEA

The Elegance of Structure: Broadening Pattern, Breakout & EqSimplest Chart explanation ( no predications - using older than 3 months charts data only )
From 2012 to 2021, the price action formed a broadening structure defined by two converging white lines — a decade-long pattern showcasing expansion and volatility.
After a clean breakout and retest, the same trendline (highlighted in green) continued to act as dynamic support across multiple touchpoints.
Adding to the symmetry, the 0.5 Fibonacci equilibrium drawn from swing low to swing high aligns perfectly with the upper boundary of the original consolidation zone
A rare confluence that highlights the precision of market geometry. This chart isn’t about forecasting; it’s about appreciating how structure, equilibrium, and trend alignment narrate the story of price itself.
Disclaimer: This post is for educational and analytical purposes only. It is not financial advice or a recommendation to trade or invest. Always conduct your own research and analysis before making any trading decisions.

Hidden Parallel Channel: Weighted Lines & Zones ExposedThis chart illustrates key technical elements where price interacts with multiple reference lines and zones, emphasizing their observed relevance based on proximity and historical behavior.
The red counter trend line, distant from price by 35-40%, carries less immediate weight, while the white counter trend line touched by price demonstrates stronger participation. Green highlights a long-term weekly demand zone from historical levels, and the white zone on daily timeframe marks a prior gap down with resistance reaction.
Parallel dotted white lines outline a hidden channel, repeatedly respected and rejected by price, underscoring its structural significance. These elements combine multi-timeframe context to showcase how markets organize around dynamic references rather than static predictions.
Motto is to showcase how one can create setup from any or all of the above ingredients, its all about perspective and how you approach and backtest in markets - experience is importnat - field experience in trading is scrolling Trading view and keep backtesting .
Disclaimer: This is purely educational content on price action, zones, and patterns. Not SEBI-registered advice. Charts use historical data >3 months old; NO forecasts, NO buy/sell recommendations, or guarantees of results. DYOR and consult professionals.

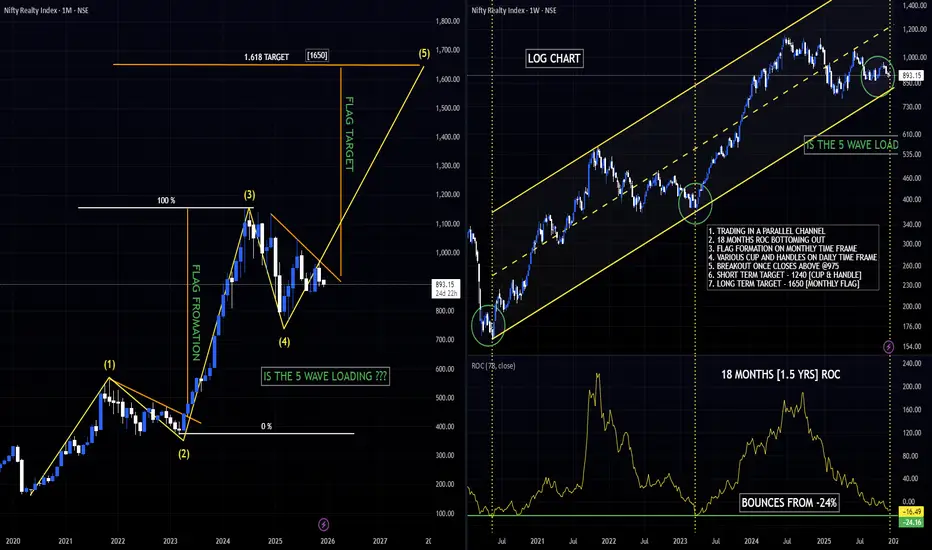
NIFTY REALTY [CNXREALTY] ABOUT TO GIVE THE BIGGEST RALLY?Technical Setup 🚀
1. Trading in a parallel channel
2. 18-month ROC bottoming out
3. Flag formation on the monthly time frame
4. Multiple cup-and-handle patterns on the daily time frame
5. Breakout expected once it closes above ₹975
6. Short-term target: ₹1,240 (Cup & Handle)
7. Long-term target: ₹1,650 (Monthly Flag)
Feel free to share your thoughts in the comments!
Not SEBI-registered ⏐ All views are personal ⏐ Not investment advice
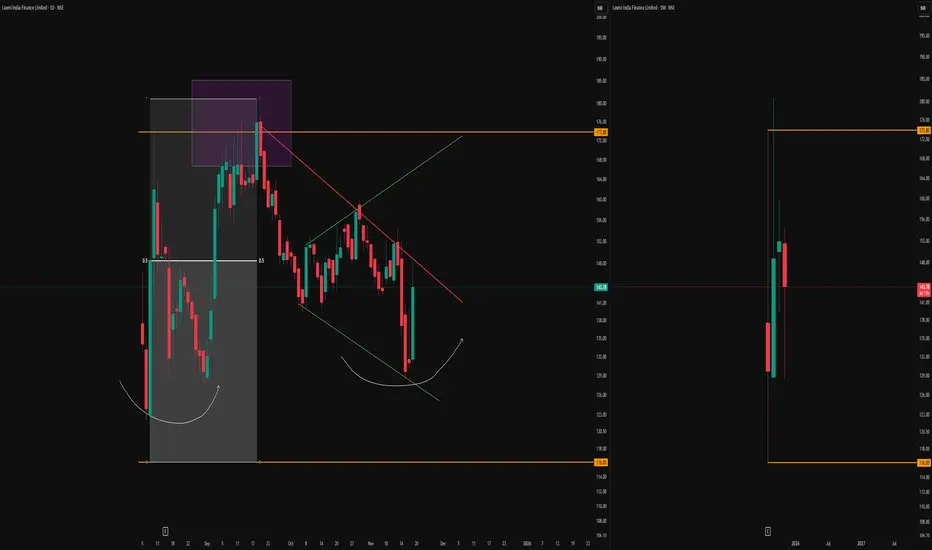
Multi-Timeframe Structure and Supply Observations-Green Broadening Pattern
A distinct broadening pattern is forming, mapped out by the green lines on the daily chart. This structure highlights expanding volatility, which often captures both swing highs and lows as price oscillates between opposing boundaries.
-Monthly High-Low Anchors
The orange horizontal lines represent the high and low of the first monthly candle, visible on the right—these serve as crucial long-term reference levels.
-Purple Box and Monthly Supply Manipulation
Up near the orange monthly resistance, the purple box marks a period of price interaction and ‘manipulation’ around the top supply. This box encapsulates a classic area where aggressive sellers and liquidity seekers converge, sometimes engineering fakeouts or squeezes before the real direction is chosen.
-Equilibrium and Rounded Higher Lows
Within the broadening pattern, a clear equilibrium zone is formed (represented by the midline drawn through the structure). This acts as a median for price oscillations and often becomes a pivot for both upward and downward moves. The two semi-circular white arcs on the left chart illustrate the emergence of higher lows
-Context from Monthly Timeframe
On the right, the monthly chart remains essential for framing all of the above
This analysis is solely observational and intended for educational purposes. No forecasts or trade signals are provided. Please exercise full discretion and undertake your own due diligence before making any trading decisions.
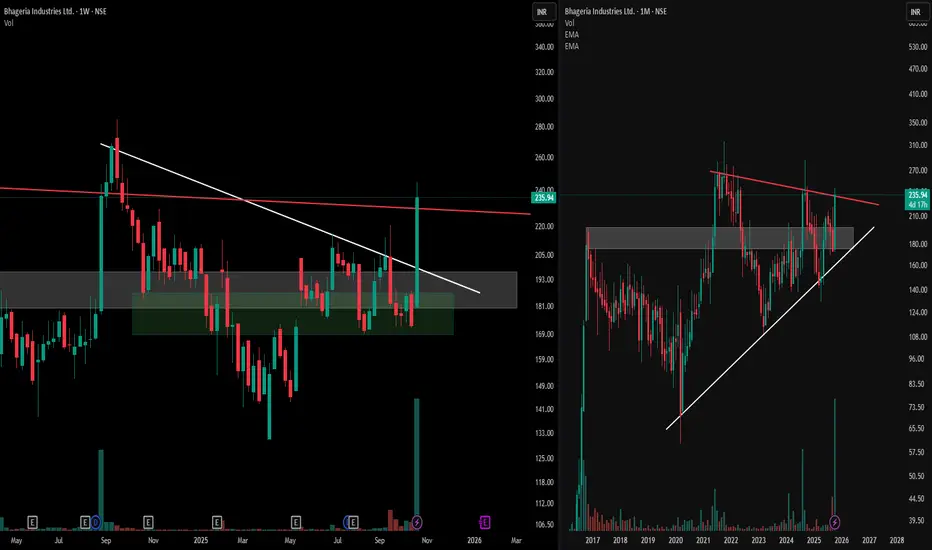
Mastering MTFA Charts : Symmetrical & Descending PatternsObserve the synergy of multiple time frames with this detailed analysis of Bhageria Industries Ltd.
Target Points -
1) The right panel displays a monthly chart, highlighting a broad symmetrical triangle formation within a prominent supply-demand zone—notice how the structure showcases the interplay of lower highs and higher lows, reflecting a period of equilibrium and market compression.
2) The left panel brings the focus to the weekly time frame, where a descending triangle pattern unfolds, providing additional insight into the ongoing price structure.
3) This multi-time frame approach emphasizes how patterns from broader time frames interact with shorter-term consolidations, enhancing our ability to spot critical decision areas on the charts.
4) Using both the monthly and weekly perspectives together, traders and learners can deepen their understanding of structural price action, pattern development, and the relevance of context provided by supply and demand zones. Dissecting these formations side by side promotes disciplined, informed chart reading without bias towards anticipating outcomes.
This analysis is for educational purposes only and does not constitute financial advice.
BUY TODAY SELL TOMORROW for 5%DON’T HAVE TIME TO MANAGE YOUR TRADES?
- Take BTST trades at 3:25 pm every day
- Try to exit by taking 4-7% profit of each trade
- SL can also be maintained as closing below the low of the breakout candle
Now, why do I prefer BTST over swing trades? The primary reason is that I have observed that 90% of the stocks give most of the movement in just 1-2 days and the rest of the time they either consolidate or fall
Trendline Breakout in IDEA
BUY TODAY SELL TOMORROW for 5%

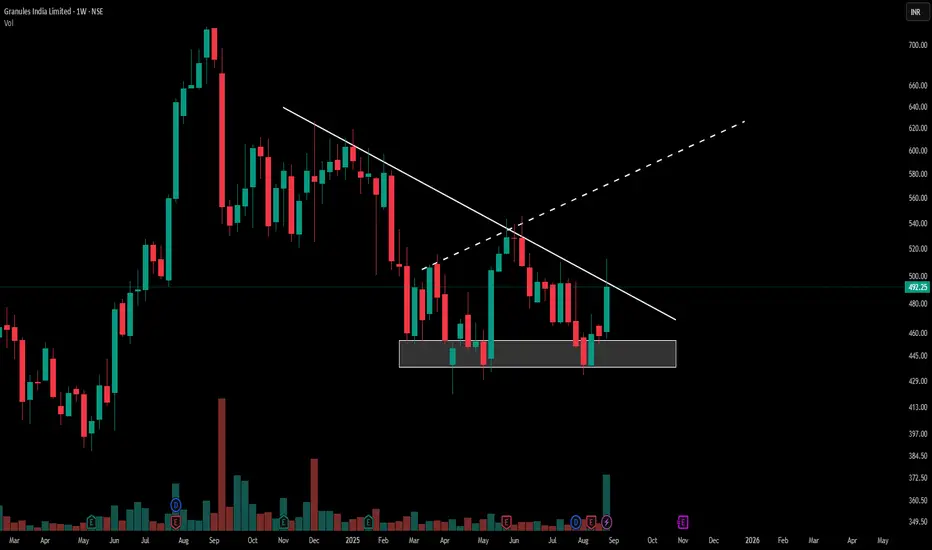
Granules India: Critical Descending TriangleGranules India Limited presents a descending triangle pattern on the weekly chart. The price has moved from the established support zone near ₹440-450 and is currently challenging the resistance trendline around ₹492.25. This movement appears with a marked increase in trading volume, highlighting the level where buyers and sellers are most active.
Pattern Character
A descending triangle pattern is identified by a series of lower highs against a stable support base. Granules India’s recent action displays persistence at support and upward momentum toward resistance. The volume expansion indicates notable participation during the current move.
Chart Observation
Price action above the triangle’s resistance can indicate a change in the prevailing sentiment if confirmed by continued volume. The current structure and market activity are being closely watched by participants for further development. No forecast or recommendation is made within this post.
STAR CEMENT LTD | Strong Breakout After Long-Term Consolidation 📝 Description:
📌 Stock: STAR CEMENT LTD (NSE)
📅 Timeframe: 1D (Daily)
📈 Breakout Date: 04-Aug-2025
💼 Sector: Cement / Infrastructure
⚡️ Technical Setup:
Breakout Above Long-Term Resistance:
Price has finally broken through the ₹240–₹256 resistance zone, which had capped upside for nearly a year.
Strong Volume Confirmation:
The breakout is accompanied by a significant rise in volume, adding credibility to the move and indicating strong buyer interest.
Bullish Market Structure:
Price has shifted into a higher high–higher low structure over the last few weeks, confirming momentum build-up.
Range Built-Up Base:
Price consolidated within ₹190–₹240 for over 10 months, creating a solid foundation for the breakout.
🔍 Key Observations:
📊 Chart Pattern:
The chart shows a horizontal breakout from a long-term consolidation zone between ₹240–₹256. This breakout signals a bullish continuation, as the stock pushes above a multi-month supply zone with strong momentum.
📈 Recent Price Action:
• The stock gave a clean breakout on 04-Aug-2025, closing above the resistance zone required with strong follow-through.
• The rally was supported by 2.5× surge in volume, indicating institutional interest.
• Price structure shows confirming trend reversal from range-bound to bullish.
• This breakout comes after 10+ months of consolidation, adding more weight to the move.
Add-ons:-
✅ Clean breakout with follow-through above ₹256.
🔼 No immediate supply zone until ₹280–₹290 range.
🔁 ₹240 now becomes a key support level.
📊 Increasing volume supports institutional accumulation possibility.
📌 Trade View:
Aggressive Entry:
• Entry around current levels if price holds above the breakout zone (₹256+).
• Use a stop-loss as per your risk plan.
Conservative Entry:
• Wait for a retest of the breakout zone (₹240–₹256) with confirmation through price action and volume support.
• Ideal for traders preferring high conviction and lower risk.
•Bias: Bullish
•Support: ₹240 (flip level), ₹225 (minor swing)
•Invalidation: Close below ₹240
🧠 Rationale:
The long base, clean breakout, and strong volume together suggest a high-probability bullish continuation. Absence of nearby resistance offers a decent runway towards the ₹280–₹290 zone. This move is also backed by strength in the broader cement sector.
🚨 Disclaimer: This is not financial advice. All views are shared for educational purposes only. Always do your own research and manage risk responsibly before making any trading decisions.
What is your view please comment it down and also boost the idea this help to motivate us.

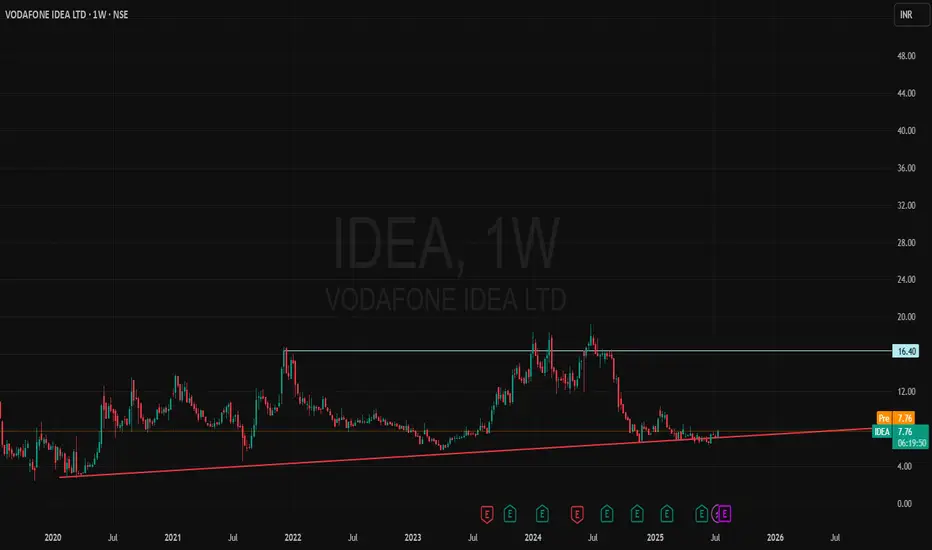
"Together for Tomorrow"📌 Vodafone Idea Ltd – Chart at Crucial Support Zone
🔍 Stock has successfully respected long-term support near ₹6.10–7.40 multiple times since 2021.
✅ Recent bounce backed by strong volume and improving technical structure.
✅ Gradual accumulation visible since past few weeks.
✅ RSI and price action both attempting to hold higher lows.
✅ OBV and momentum indicators hinting at early signs of recovery.
✅ Price trading inside a broad ascending triangle pattern since 2020 – potential breakout above ₹9 could confirm long-term trend reversal.
🧠 Risk-Reward looks favourable for long-term positional investors from current levels, with strict SL near ₹6.10.
🎯 Ideal for positional traders & long-term investors with a medium-term view.
📝 Note: Please do your own due diligence. This is not a recommendation, just a view based on charts and fundamentals.
🧠 Disclaimer: For educational and research purposes only. No buy/sell advice.
📝 Chart Purpose & Disclaimer:
This chart is shared purely for educational and personal tracking purposes. I use this space to record my views and improve decision-making over time.
Investment Style:
All stocks posted are for long-term investment or minimum positional trades only. No intraday or speculative trades are intended.
⚠️ Disclaimer:
I am not a SEBI registered advisor. These are not buy/sell recommendations. Please consult a qualified financial advisor before taking any investment decision. I do not take responsibility for any profit or loss incurred based on this content.
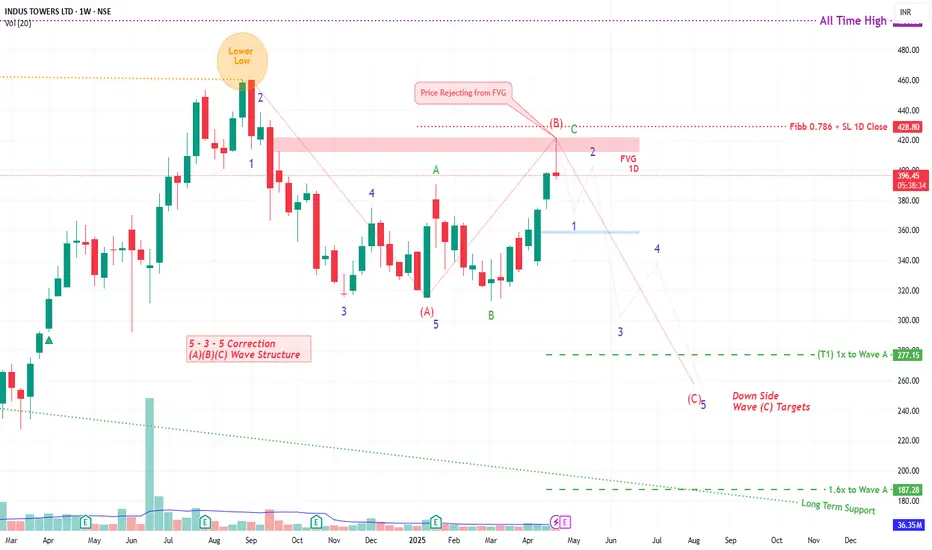
INDUS TOWER By KRS Charts25th April 2025 / 9:40 AM
Why INDUSTOWER??
1. Stock was reached its near ATH level but not able to hold the levels in Sep 2024 . From this point to today it seems like bullishness is getting weaker.
2. Wave Theory is saying Correction Wave ABC is ongoing and C is likely Started .
3. In support of more Correction from here FVG is visible in 1D TF and price are rejected from that level too.
4. Expecting correction from here in 5 Wave Structure towards downside.
Expected Targets and SL are mentioned in Chart
Note: This is Medium to Long Term View
25,600 Resistance Holding Strong | Option Chain Signals Bearish For Intraday (5-Min Chart)
1. VWAP (Volume Weighted Average Price)
Use: Institutional buying/selling level
Watch:
Price above VWAP → bullish
Price below VWAP → bearish
Sideways around VWAP → consolidation
✅ Great for scalping & breakout trades.
For Swing Trading (3-Hour Chart)
1. MACD (12,26,9)
Use: Trend confirmation & momentum
Watch:
Bullish crossover (MACD line crosses above signal line) = possible up move
Bearish crossover = possible down move
MACD histogram momentum shows strength/weakness.
2. 200 EMA (Exponential Moving Average)
Use: Long-term trend
Above 200 EMA → bullish bias
Below → bearish
Acts as dynamic support/resistance.

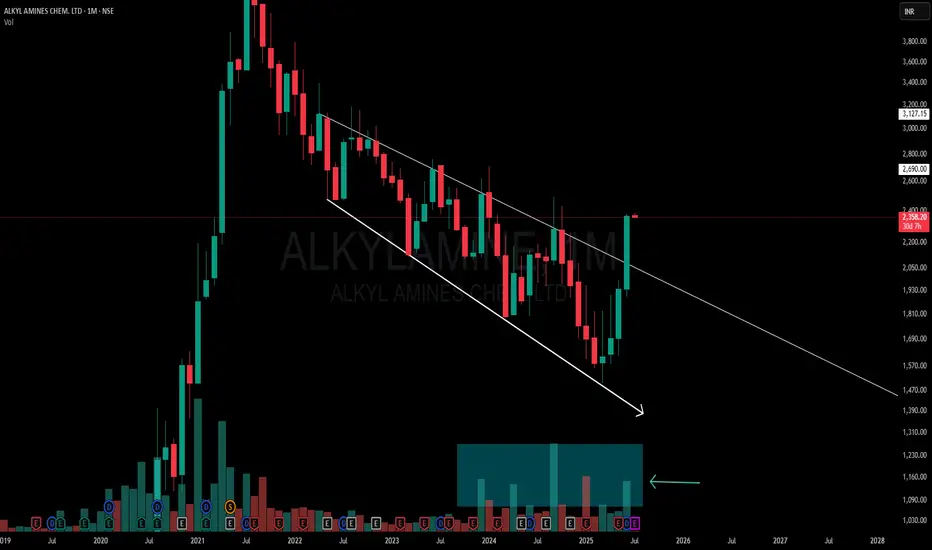
Powerful Monthly Channel | Clean Price Structure Across📉 Description:
-This is a classic example of a broadening falling channel on the Monthly Time Frame (MTF), where the counter-trendline (CT) has just been taken out by a strong bullish candle. Volume confirms the strength
📌What makes this setup particularly interesting:
-MTF structure: Despite a series of lower lows on the monthly, it has respected the broad structure of the falling channel throughout.
-WTF/DTF structure: Weekly and Daily timeframes are making higher lows (HLs),
-Price behavior: Clean reaction to the trendline and no choppiness around breakout — this reflects a well-absorbed selling zone
⚠️ This is not a forecast, not a call or tip — just me charting what I see. Drop any doubts in the comments.
How I Read Price Action Like a Pro (Most Miss This Step)The REAL Way to Read Price Action — No Indicators, Just Logic
I make educational content videos for swing trading .

OPTIEMUS | Reclaiming Zones, Respecting Trendlines🟩 Price is navigating a critical structure:
White Line = Major CT (Control Trendline) — currently acting as resistance.
White Zone = MTF Supply ➡ Demand Flip Zone — price is holding above it.
Blue Zone = WTF Demand Pocket — also reclaimed recently.
📌 After reclaiming both the blue and white zones, price is now consolidating just under the CT, possibly coiling up.
🧠 Not a prediction. No tips. Just structure-based storytelling.

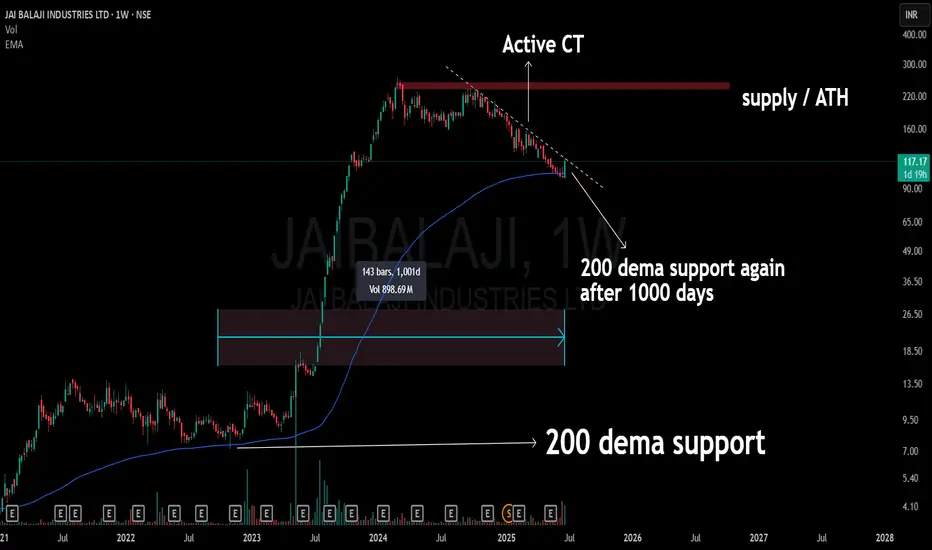
200 Dema Touched After 1000 Days !! 🔵 Stock: JAI BALAJI (Weekly)
🔥 Support Revisit: Back to the 200 DEMA after 1000 days
A level that once acted as the launchpad.
Current structure shows an active compression trend (CT) right into this long-term dynamic support.
The chart also aligns below a major supply zone / ATH band, keeping the broader context in check.
📉 No prediction. No call. Just structure, levels, and time-tested zones doing the talking.
Weekly CT Breakout + 200EMA Flip | GALAXYSURF Structure📉 Main CT Line (Dotted White)
A well-defined counter-trendline finally gave way after weeks of price compression. The breakout was clean, with a strong bullish candle closing decisively above it.
📊 Volume Confirmation
Breakout candle posted a solid spike in volume — the highest weekly volume in months. 💥
📈 200 EMA Broken (Blue Line)
Price has also cleared the 200-week EMA, a key dynamic resistance, now potentially flipping to support. 📉
🟧 Higher Timeframe Supply (Orange Line) / ⚪ (White Lines)
The breakout candle has also stepped into a tight zone between Weekly + Monthly supply, marked by the orange line.
📌 As always, the chart tells the story. No predictions. No assumptions, just structure.

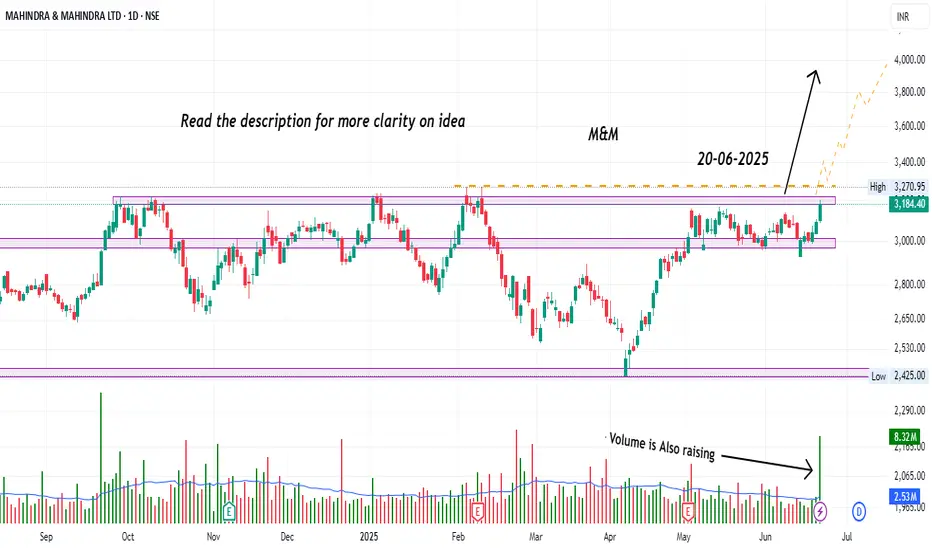
Mahindra & Mahindra – Activity Picking Up! Watch CloselyHey Family, here’s another stock showing a strong technical setup! 🚀
📈 Stock: Mahindra & Mahindra Ltd (NSE: M&M)
🔍 Key Observations:
📊 Chart Pattern:
The stock is displaying a Horizontal Breakout Setup from a well-defined multi-month resistance zone, dating back to 07-10-2021. This forms a strong bullish continuation base, indicating potential for a sustained move higher.
📈 Recent Price Action:
• M&M has recently tested the upper boundary of its resistance zone around ₹3,270, which has been respected multiple times in the past (notably on 18-06-2025 and 20-06-2025).
• The current close at ₹3,184.40 (+2.90%) on June 20, 2025, shows increasing buying momentum near this critical resistance level.
• Volume surged to 8.32M, significantly above average, confirming institutional participation and validating the price action.
📦 Volume Insight:
The volume spike on the breakout attempt signals strong accumulation. This is a vital confirmation factor for the bullish case.
💡 Trading Recommendation:
Aggressive Approach:
• Traders can consider participating based on the current price structure, using proper risk management techniques aligned with individual trading plans.
Conservative Approach:
• Alternatively, wait for a clear breakout confirmation with strong follow-through and closing strength above the resistance zone before considering entry. This helps reduce false breakout risks.
🧠 Rationale:
The recent price behavior, combined with heightened volume activity, reflects growing interest in the stock. Such conditions often signal a shift in market sentiment. Observing how the stock reacts in the coming sessions can provide useful cues. Traders should focus on structure, strength, and participation—adapting their approach based on personal style and risk preference.
🚨 Disclaimer: This is not financial advice. All views are shared for educational purposes only. Please do your own research and always manage your risk before making any trading decisions.
📢 What’s your view? Drop it in the comments and boost the idea if you found it useful – your support helps us keep sharing quality setups! 💬🔥
Multi time frame charting explained in GEPILI make educational content videos for swing / positional trading

Inside 2 Weekly Timeframe CT Breakouts With Strong VolumesPurely chart-based view. No bias. No advice. Just how I interpret these right now
I make educational content videos on Swing trading .

4 Stocks. 4 Stories. Here's How I See Them Without Predictions..Purely chart-based view. No bias. No advice. Just how I interpret these right now
I make educational content videos on Swing trading .

Inside Bars After High Volume – CERA Setting Up Near Key CT📌 Timeframe: Weekly (WTF)
📌 Type: Technical Observation / Swing Structure
📌 Concept: Counter Trendline Breakout Setup
CERA is currently navigating a highly constructive zone from a swing trading lens. Here's what's developing technically:
🔹 Higher Low Formation:
The stock has established a higher low structure, with the white internal trendline offering visible support across recent weeks. Interestingly, this aligns perfectly with the 200-period EMA on the weekly timeframe, enhancing its significance as a dynamic support layer.
🔹 Volume Clues:
Two of the highest volume candles on the weekly chart have now been followed by inside bars, a potential sign of absorption or base building. This tightening within volume zones signals institutional interest and a possible buildup phase.
🔹 Supply Zone Identified:
An overhead supply (marked in orange)
🔹 EMA Context: The blue 200 EMA further reinforces the idea of Supportive price behavior around this line validates its role.
🔍 This post is for educational discussion only. No recommendation or forecast is implied. Please conduct your own due diligence.

Support Flips, Trendline Snaps — Weekly Chart Speaks!A counter-trendline breakout (white line) is underway on the Weekly Time Frame (WTF), supported by strong structural confluences:
🔹 Pattern size is substantial, with price consolidating for several months before breakout.
🔹 The yellow zone represents a prior support, which later broke down — now acting as a resistance-turned-breakout zone, a classic supply flip.
🔹 Recent breakout candle shows strength, emerging after taking support from the 200 DEMA, reinforcing the base.
🔹 MTF resistance (dashed yellow line) is marked — remains the next significant obstacle on higher timeframes.
No trading/investment advice. Purely educational .
