IDEA

TCS: Sell on rise set upTCS
3135
On any pullback, the stock could face stiff resistance and may fall back to lower levels. For levels refer to chart
Alternatively,
One may consider selling February expiry 3250 Call option in the range of 60-80
Lot size 300
Max profit potential in strategy Rs 18000 - Rs 24000/- per lot
In built loss protection for a rise in price up to 3310-3330 on 25 Feb 2021
Take care & safe trading...!!!
Disclaimer:
- The view expressed here is my personal view
- Past performance is not a guarantee for future predictions
- Use this for educational purpose
- Any decision you take, you need to take responsibility for the same
- It's your hard earned money. Treat it wisely
- Trade / Invest keeping in mind your trading style, goals and objectives, time horizon & risk tolerance
- if trading in F&O, understand that F&O trading involves risk
- Do take proper risk management measures
- Do your own analysis and consult your financial adviser if need be


VODAFONE IDEA Trading SetupAround the previous resistance area which will be acting as support now can be a good buying level.

IDEA Analysis Very Very big momentum. 100% max target.Vodafone Idea share price rose almost 10% in Friday's early trade after the telecom major announced that it has sold its 11.15% stake in Indus Towers for Rs 3,760 crore. Now it can go more higher. and ichimoku cloud is also giving a signal of strong buy. in this analysis take entry after when trend line breaks and sustains and starts shooting up.. targets are given. Feel free to ask anything.


#IDEA Weekly BO after 1.5 years of CUP & HANDLE pattern#IDEA Weekly BO after 1.5 years of CUP & HANDLE pattern.
All details are provided on the chart

📱VODAPHONE IDEA 🎯NSE:IDEA
RISKY TRADE
******whatever charts or levels sharing here are just for educational purpose only not a recommendation. please do your own analysis before taking any trade on them. we are not SEBI registered.
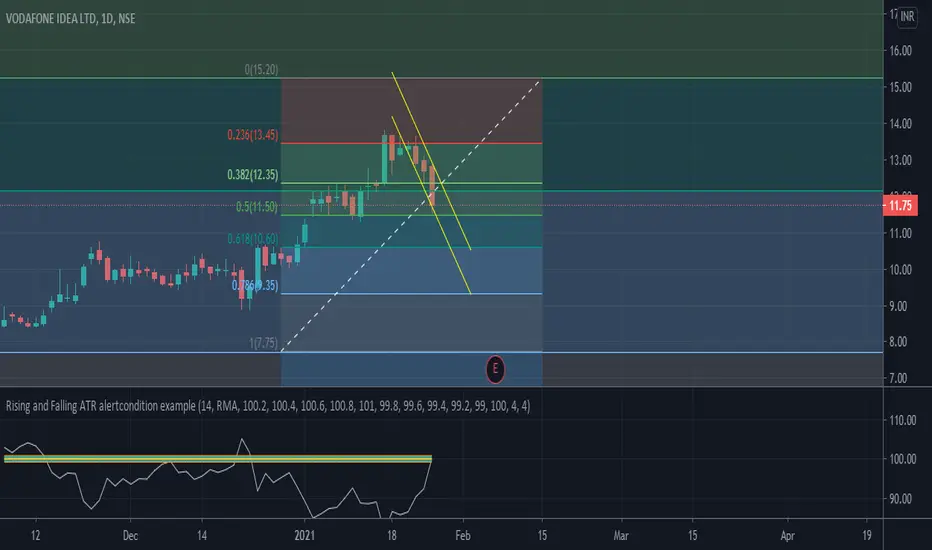
EK IDEA JO BADAL DE APKI DUNIYA! LOL BUT HERE IS MY VIEW ON IDEACHART ANALYSIS OF IDEA! THE BREAK ABOVE 14.50 WILL LEAD IT TO THE NEAR TERM TARGETS OF 17/19/24/28/33+
WAIT FOR THE PULLBACK TO ENTER IN IT AFTER IT BREAKOUTS ABOVE!
maintain sl of under 7 if you are a mid term player!
accumulation zone is of 9-12 !
ascending triangle formation on the daily charts! break above the ascending triangle can take it to 19 levels!

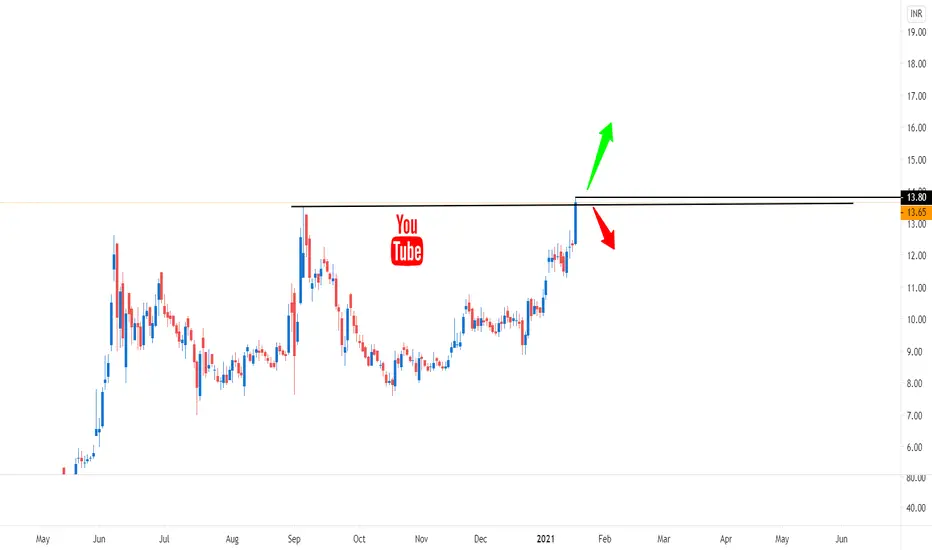
Vodafone Idea- 13.6 - Breakout with Volumes.Vodafone Idea- It has formed cup and handle pattern on 15.12.20. The same was published in this forum. Given in the link given below. Yesterday it has cleared one year resistance and made a new yearly closing high of 13.6 with huge volumes. This is an indication of breakout with formation of longs. This rally can take Idea to 15, 17.15, 20 in short term to medium term. In short term it can go to 15, 17 one to two months. In medium term 3 to 6 moths 20, with a sl of 10. This is purely for educational purpose.

Idea Trend AnalysisVodafone Idea is getting huge FII now a day. I did the analysis of chart of Idea and levels are marked in Blue line (resistance) and Red line (Imp. Support)
From here Idea can go to 16 if level break (13.65) in upside
if in downside it closes below red line (12.45) , then next resistance will be at 8.70 to 8.40


Vodafone IdeaBreakout from a Diamond formation.
Facing another resistance at 13.75.
If it manages to close above 13.75 we can get to see first levels of 15-16 where it again faces resistance from a trend line.
Above 18-19 it could race.

Wonderful multiple confluence supporting the long of GAIL#GAIL supporting long in coming days shown by a breakout from the multiple confluence analysis. Trendline BO, double bottom/W pattern, resistance BO. Can enter above 124.5 and for a target of 135.


IDEA is ready to make fresh 52 week high Buy around 10.75 and keep stop loss between 9.90 - 10.15 . This will gonna to happen in a week.


Bandhan bank break trend line upside.Bandhan bank break trend line upside. IT IS NOT ADVISE IT IS MY VIEW ON MARKET .

Idea 10.50 / 11.10 by 15th / 17th DecIdea 10.50 / 11.10 by 15th / 17th Dec. Idea is in a strong uptrend. Will most probably touch 11.10 by this week.
