Management and PsychologyTrading psychology is the emotional component of an investor's decision-making process, which may help explain why some decisions appear more rational than others. Trading psychology is characterized primarily by the influence of both greed and fear. Greed drives decisions that might be too risky.
IDFC

Advanced Trading part 2Advanced traders use a range of sophisticated tools to decode market trends. This includes understanding complex chart patterns, trend lines, and technical indicators such as Fibonacci retracements, Bollinger Bands and Ichimoku Clouds.

Technical Trading Technical trading is a broader style that is not necessarily limited to trading. Generally, a technician uses historical patterns of trading data to predict what might happen to stocks in the future. This is the same method practiced by economists and meteorologists: looking to the past for insight into the future.

Database Trading part 3Trading data is typically collected from stock exchanges such as the New York Stock Exchange (NYSE) or NASDAQ. This can be a useful source for trades that are made over the listed exchanges and can provide many different data poitns, such as trade prices and times.

Advanced Trading part 1Advanced trading encompasses sophisticated strategies, tools, and techniques used by experienced traders to gain an edge in the market, often involving complex instruments like options and futures, and multiple technical indicators. It's about developing a trading system, testing and refining strategies, and understanding market micro-structure.

RSI (Relative Strength Index)In trading, RSI stands for Relative Strength Index. It's a momentum indicator used in technical analysis to measure the speed and change of price movements of an asset. RSI helps traders identify potential overbought or oversold conditions, providing signals that can guide their trading decisions.

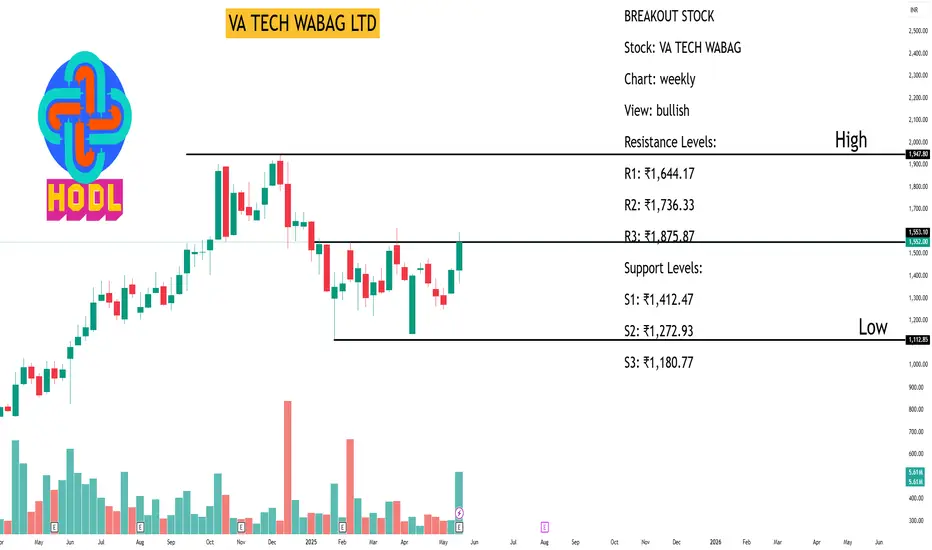
VA TECH WABAG LTDBREAKOUT STOCK
Stock: VA TECH WABAG
Chart: weekly
View: bullish
Resistance Levels:
R1: ₹1,644.17
R2: ₹1,736.33
R3: ₹1,875.87
Support Levels:
S1: ₹1,412.47
S2: ₹1,272.93
S3: ₹1,180.77
▸ Va Tech Wabag is trading 1.78% upper at Rs 1,552.10 as compared to its last closing price.
Va Tech Wabag has been trading in the price range of 1,595.10 & 1,532.80.
Va Tech Wabag has given -5.54% in this year & 8.77% in the last 5 days.
There are 2 analysts who have initiated coverage on Va Tech Wabag.
There are 1 analysts who have given it a strong buy rating & 1 analysts have given it a buy rating. 0.00 analysts have given the stock a sell rating.
The company posted a net profit of 99.50 Crores in its last quarter.Listed peers of Va Tech Wabag include Va Tech Wabag (1.78%), Jitf Infralogistics (-0.70%), Captain Polyplast (0.06%). The Mutual Fund held in Va Tech Wabag was at 2.29% in 31 Mar 2025.
►The Fll holding in Va Tech Wabag was at 18.58% in 31 Mar 2025. The FIl holding has decreased from the last quarter
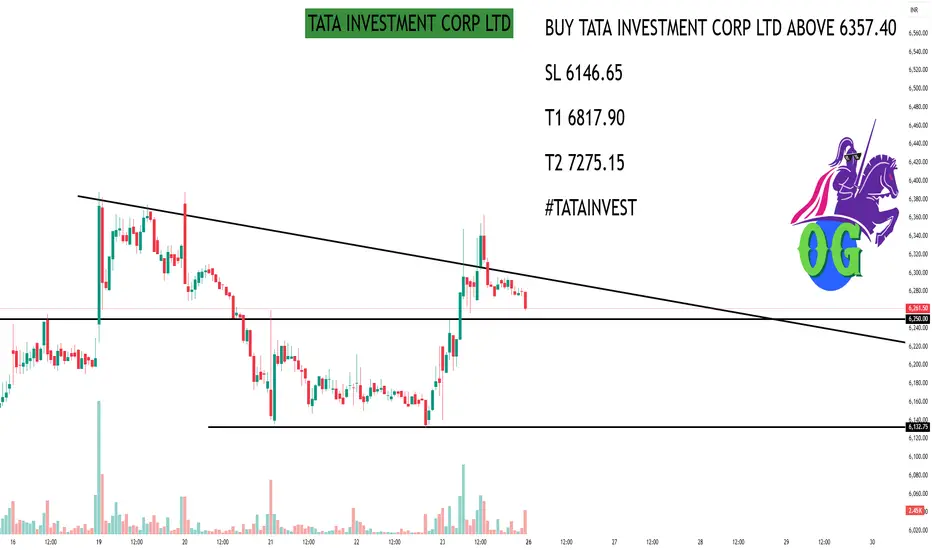
TATA INVESTMENT CORP LTDAs of May 26, 2025, Tata Investment Corporation Ltd. (NSE: TATAINVEST) closed at ₹6,269.00. Here's an overview of its 15-minute intraday support and resistance levels based on technical analysis:
📊 15-Minute Intraday Support & Resistance Levels
While specific 15-minute pivot points are not readily available, we can refer to the daily pivot levels as a proxy for intraday analysis:
Classic Pivot Points:
Pivot Point (P): ₹6,257.33
Resistance Levels:
R1: ₹6,374.66
R2: ₹6,480.33
R3: ₹6,597.66
Support Levels:
S1: ₹6,151.66
S2: ₹6,034.33
S3: ₹5,928.66
These levels can serve as reference points for intraday trading decisions.
🔍 Technical Indicators Overview
RSI (14-day): 57.56 — indicating neutral momentum.
MACD: 27.09 — suggesting bullish momentum.
Stochastic Oscillator: 72.08 — approaching overbought territory.
Supertrend Support: ₹5,861.93 — acting as a dynamic support level.
Parabolic SAR: ₹5,842.13 — indicating an upward trend.
These indicators suggest a cautiously bullish outlook for the short term.
📈 Trading Strategy Insights
Bullish Scenario: A breakout above ₹6,374.66 (R1) with strong volume could signal further upward momentum.
Bearish Scenario: A drop below ₹6,151.66 (S1) may indicate potential downside risk.
Traders should monitor these levels closely and consider additional technical indicators for confirmation.
ICICI PRU LIFE INS CO LTDAs of May 26, 2025, ICICI Prudential Life Insurance Co. Ltd. (NSE: ICICIPRULI) closed at ₹642.20, marking a 3.62% increase from the previous session. Here's a detailed analysis of its weekly support and resistance levels based on various pivot point methodologies:
📊 Weekly Pivot Point Levels
Classic Pivot Points
Pivot Point (P): ₹632.07
Resistance Levels:
R1: ₹654.08
R2: ₹665.97
R3: ₹687.98
Support Levels:
S1: ₹620.18
S2: ₹598.17
S3: ₹586.28
Fibonacci Pivot Points
Pivot Point (P): ₹632.07
Resistance Levels:
R1: ₹645.02
R2: ₹653.02
R3: ₹665.97
Support Levels:
S1: ₹619.12
S2: ₹611.12
S3: ₹598.17
Camarilla Pivot Points
Pivot Point (P): ₹632.07
Resistance Levels:
R1: ₹645.31
R2: ₹648.42
R3: ₹651.52
Support Levels:
S1: ₹639.09
S2: ₹635.99
S3: ₹632.88
🔍 Technical Outlook
Trend Analysis: The stock is currently trading above its central pivot point (₹632.07), indicating a bullish bias.
Key Resistance: A breakout above ₹654.08 (R1) could signal further upward momentum.
Key Support: A decline below ₹620.18 (S1) may suggest a potential bearish reversal.
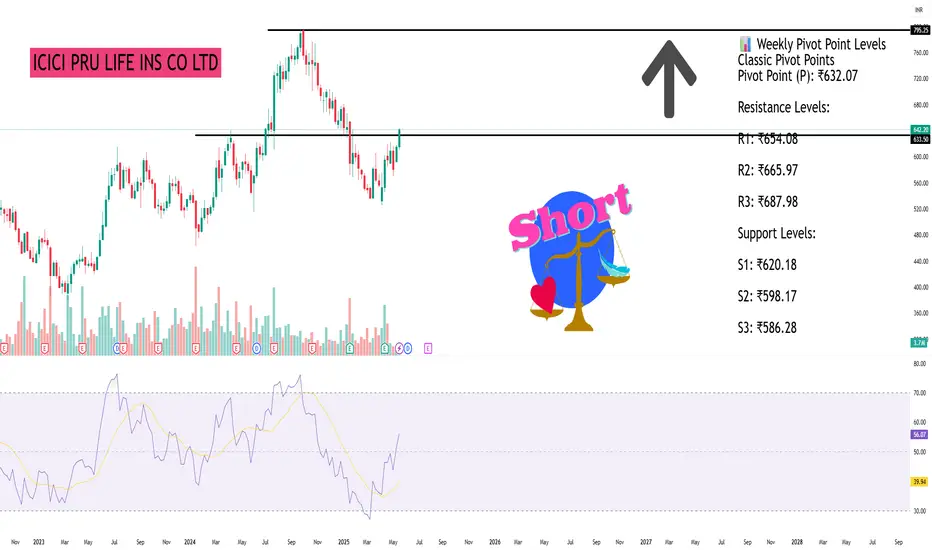
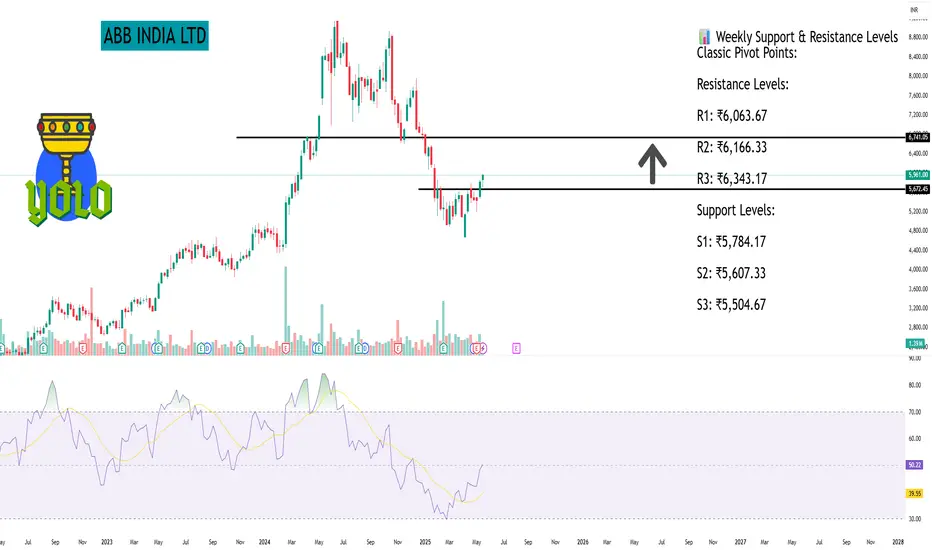
ABB INDIA LTDAs of May 26, 2025, ABB India Ltd. (NSE: ABB) closed at ₹5,961.00. Here's a comprehensive overview of its weekly support and resistance levels based on technical analysis:
📊 Weekly Support & Resistance Levels
Classic Pivot Points:
Resistance Levels:
R1: ₹6,063.67
R2: ₹6,166.33
R3: ₹6,343.17
Support Levels:
S1: ₹5,784.17
S2: ₹5,607.33
S3: ₹5,504.67
Pivot Point: ₹5,941.83
Fibonacci Pivot Points:
Resistance Levels:
R1: ₹5,985.57
R2: ₹6,012.59
R3: ₹6,056.33
Support Levels:
S1: ₹5,898.09
S2: ₹5,871.07
S3: ₹5,827.33
Pivot Point: ₹5,941.83
Camarilla Pivot Points:
Resistance Levels:
R1: ₹5,971.50
R2: ₹5,981.99
R3: ₹5,992.49
Support Levels:
S1: ₹5,950.50
S2: ₹5,940.01
S3: ₹5,929.51
Pivot Point: ₹5,941.83
🔍 Technical Outlook
Trend: ABB India is exhibiting a neutral to mildly bullish trend.
Key Observations:
The stock is trading near its central pivot point, suggesting potential for either a breakout or a pullback.
A decisive move above R1 levels could indicate bullish momentum, while a drop below S1 may suggest bearish tendencies.
Technical indicators such as RSI are indicating buying momentum, suggesting the stock might rise.
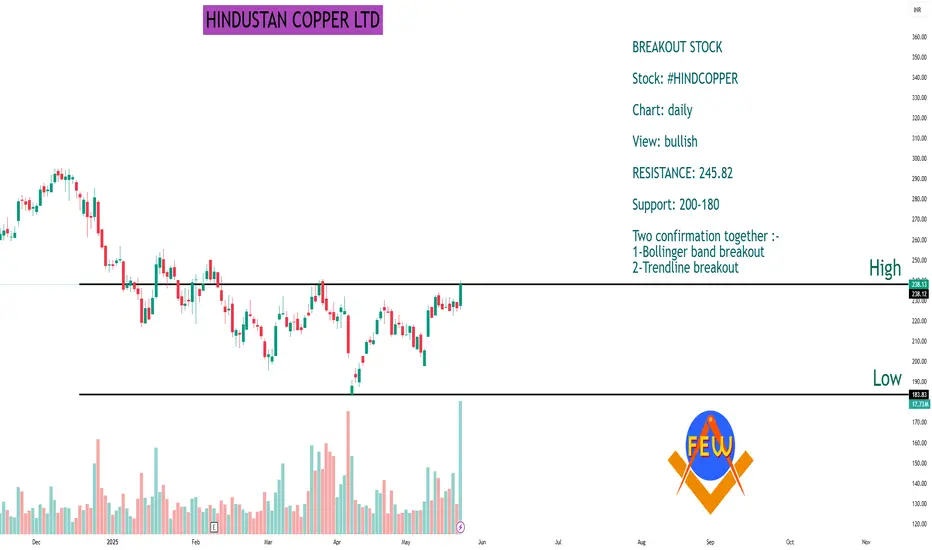
HINDUSTAN COPPER LTDBREAKOUT STOCK
Stock: #HINDCOPPER
Chart: daily
View: bullish
RESISTANCE: 245.82
Support: 200-180
Two confirmation together :-
1-Bollinger band breakout
2-Trendline breakout
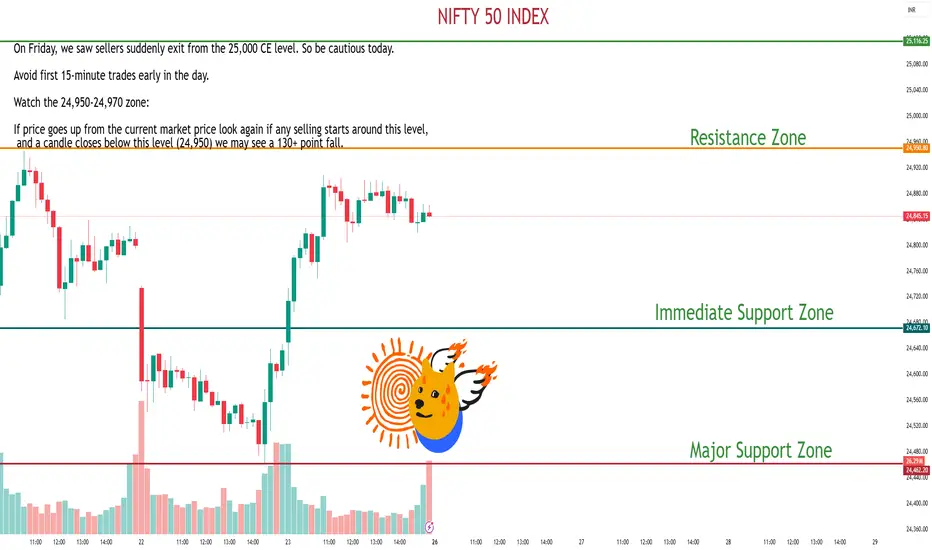
NIFTY 50 INDEXMarket View:
On Friday, we saw sellers suddenly exit from the 25,000 CE level. So be cautious today.
Avoid first 15-minute trades early in the day.
Watch the 24,950-24,970 zone:
If price goes up from the current market price look again if any selling starts around this level, and a candle closes below this level (24,950) we may see a 130+ point fall.
But if 24,950 holds and the 30-minute chart shows higher highs, the market could move up towards 25,120-25,200.
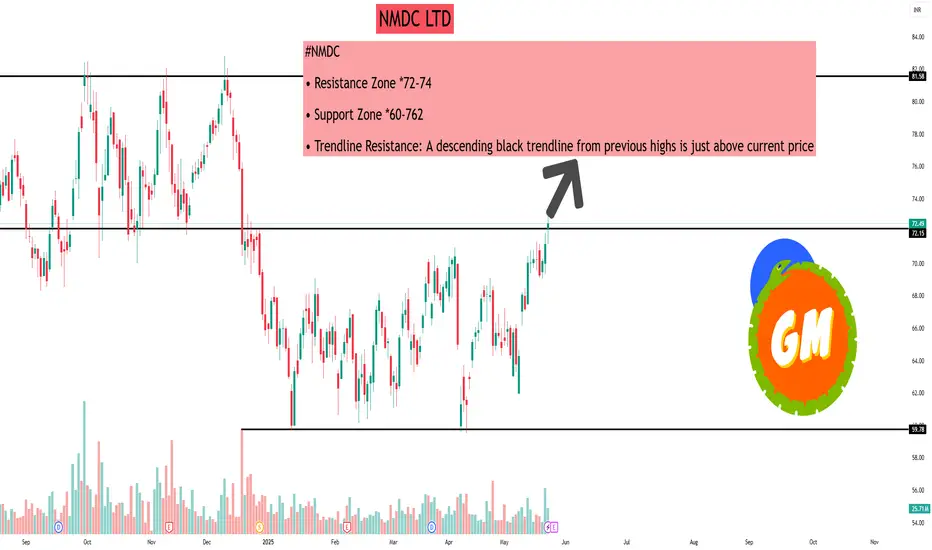
NMDC LTDNMDC Limited (National Mineral Development Corporation) is a leading Indian public sector enterprise under the Ministry of Steel, Government of India. Established in 1958, NMDC is India's largest producer of iron ore, with operations spanning mining, mineral exploration, and value-added production.
🏢 Company Overview
Headquarters: Hyderabad, Telangana
Chairman & Managing Director: Amitava Mukherjee
Ownership: Government of India holds approximately 60.79% stake
Employees: Approximately 5,887 (as of March 2019)
🛠️ Core Operations
Iron Ore Mining: NMDC operates highly mechanized iron ore mines in Chhattisgarh (Bailadila) and Karnataka (Donimalai), producing over 45 million tonnes annually.
Diamond Mining: Operates India's only mechanized diamond mine at Panna, Madhya Pradesh, with a capacity of 84,000 carats per year.
Other Minerals: Engaged in the exploration and extraction of copper, rock phosphate, limestone, dolomite, gypsum, bentonite, and beach sands.
🌍 Global Presence & Diversification
International Ventures: Through its subsidiary, Legacy Iron Ore Limited, NMDC holds exploration tenements in Western Australia for iron ore, gold, tungsten, and base metals.
Strategic Investments: Holds a 26% stake in International Coal Ventures Pvt. Ltd. (ICVL), which owns coking coal deposits in Mozambique.
🏗️ Nagarnar Steel Plant
NMDC established a 3 million tonnes per annum (MTPA) integrated steel plant at Nagarnar, Chhattisgarh, to diversify into steel production. In 2022, the steel business was demerged to form NMDC Steel Limited, which was listed on Indian stock exchanges in February 2023.
📈 Financial Highlights
Stock Listings: Listed on the Bombay Stock Exchange (BSE) and National Stock Exchange (NSE) under the ticker symbol 'NMDC'.
Shareholding Pattern (as of February 2020):
Government of India: 69.65%
Life Insurance Corporation of India: 13.699%
Other Institutional Investors: Approximately 24%
🏆 Awards & Recognition
SCOPE Eminence Award 2019-20 for CSR Excellence
Most Sustainable & Innovative Manufacturing Practices at World HRD Congress & Awards 2024
CEO of the Year Award at the Business Leader of Year 2024
Best PSU for CSR in Mining and Minerals at the Global CSR Excellence and Leadership Awards 2024
Divergence SecretsDivergence moves in the opposite direction of the technical indicator.
Divergence occurs when there is a high probability of price retracement.
Divergence analysis is recommended only if you observe double top, double bottom, higher high, and lower low formation.

Advanced Options Trading Advanced options trading ventures beyond basic buying and selling of calls and puts. It involves useful combinations of options contracts to achieve specific trading goals.

Institution Trading Strategies part 5Institutional traders incorporate strategies that emphasize both long-term value and diversification in their trading practices. They leverage significant amounts of capital to build portfolios diversified across multiple assets, which helps reduce risk while seeking improved market prices.

Institutional Trading part 4Institutional trading involves buying and selling securities by organizations on behalf of other investors, typically in large volumes. These traders, often working for entities like mutual funds, pension funds, and hedge funds, manage significant capital and can influence market prices. Institutional trading differs from retail trading, which involves individual investors making smaller trades for their own accounts.

Database Trading"Database trading" refers to using structured databases, often containing financial market data, to make trading decisions. This involves analyzing historical data, identifying patterns, and potentially automating trading strategies based on those findings. It can also encompass the idea of trading access to data itself on a platform similar to a stock exchange.

MACD - Moving Average Convergence/DivergencMACD, which stands for Moving Average Convergence/Divergence, is a technical analysis indicator used to analyze the strength, direction, momentum, and duration of a trend. It helps identify potential trend reversals and measure the momentum of a price.

Advanced RSI "Advanced RSI" typically refers to strategies or techniques that go beyond the basic interpretation of the Relative Strength Index (RSI) indicator in trading. It involves using the RSI in more sophisticated ways, such as combining it with other indicators, exploring different RSI settings, and identifying advanced trading patterns.

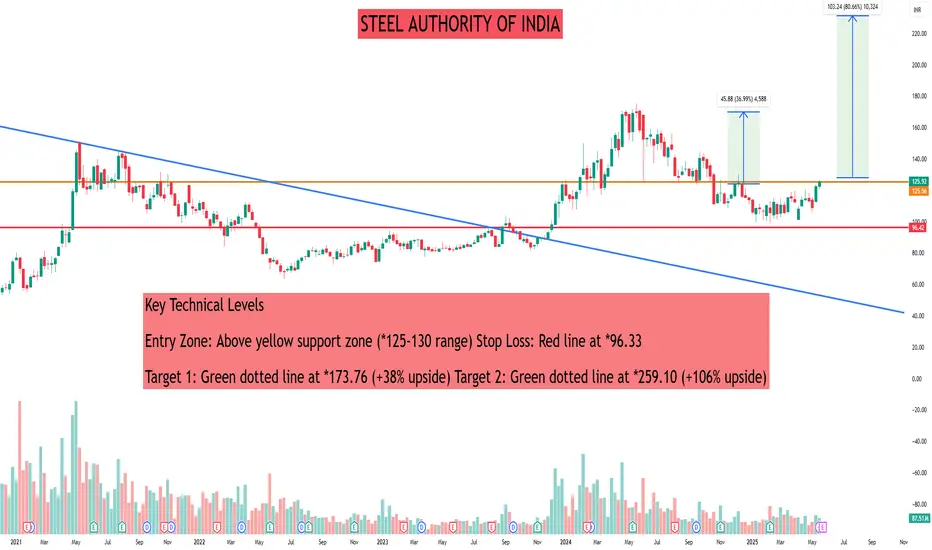
STEEL AUTHORITY OF INDIASTEEL AUTHORITY OF INDIA
Sail long.....
SAIL Technical Breakout Setup
Current Price: *125.74 (+2.66%)
Date: May 23, 2025
Key Technical Levels
Entry Zone: Above yellow support zone (*125-130 range) Stop Loss: Red line at *96.33
Target 1: Green dotted line at *173.76 (+38% upside) Target 2: Green dotted line at *259.10 (+106% upside)
Technical Analysis
Pattern Recognition:
SAIL is forming a long-term triangular consolidation pattern
Stock is approaching the apex of a multi-year triangle
Blue diagonal trendline acts as major resistance since 2008 highs
Yellow horizontal zone provides strong support
Current Market Structure:
Price is holding above the critical yellow support zone
Recent bounce shows buying interest at these levels
Volume appears to be picking up on the recent move
Probability Assessment
Target 1 (*173.76) Probability: Moderate to High
This level represents the previous resistance zone
If breakout sustains above ₹130, this becomes achievable
Risk-reward ratio: Approximately 1:1.6
Target 2 (*259.10) Probability: Lower
This is an ambitious target requiring significant momentum
Would need broader market support and sector rotation
Risk-reward ratio: Approximately 1:5.5
Trading Strategy
For Aggressive Traders:
Enter on sustained close above *130
Partial booking at Target 1
Trail stop loss for Target 2
For Conservative Traders:
Wait for weekly close above *135
Smaller position size given the risk
Risk Management:
Strict stop loss at *96.33 (23% downside risk)
Position sizing should reflect the volatility
Important Notes:
Steel sector performance depends on infrastructure spending
Global commodity prices impact fundamentals
This is a technical setup - fundamental analysis required separately
This analysis is for educational purposes. Trade at your own risk.
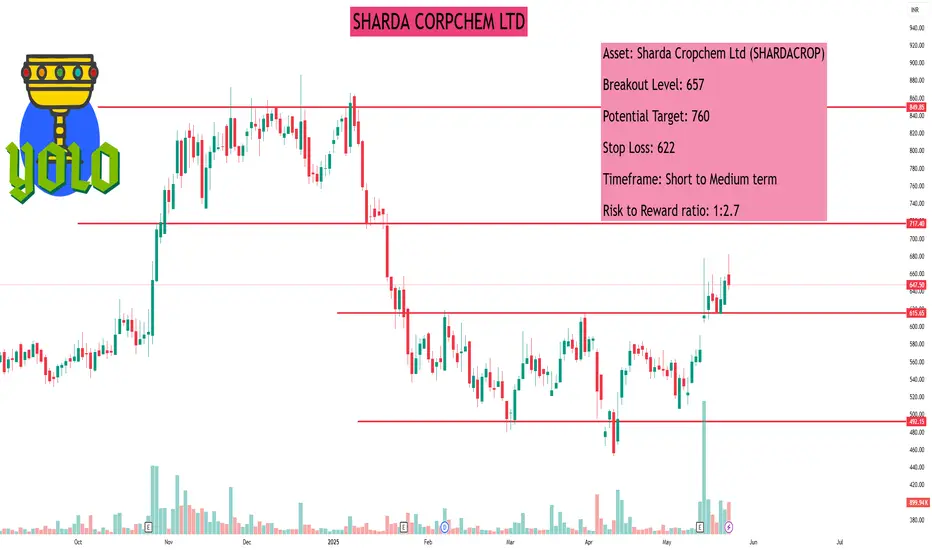
SHARDA CROPCHEM LTD.SHARDA CROPCHEM LTD.
#SHARDACROP
Asset: Sharda Cropchem Ltd (SHARDACROP)
Breakout Level: 657
Potential Target: 760
Stop Loss: 622
Timeframe: Short to Medium term
Risk to Reward ratio: 1:2.7
Rationale:
Fundamentals-
Fundamentally decent stock with the following attributes:
* ROCE - 19.3%
* ROE - 12.8%
* Debt to Equity - 0
* Stock PE 19.3 / Industry PE - 29.5 || Stock PBV 2.35 / Industry PBV 2.5- Company is underpriced
* EPS / Revenue - Increasing over last 6 months
Technicals -
* Overall structure - Forming a large cup on weekly charts
* Multiple timeframe analysis - Stock poised for up move as the daily/weekly/ monthly charts are showing formation of a cup (over 5 months)
* On daily charts, the price surged ~3.3% yesterday and surfing the 200 DMA
* The 10 DMA is above the 20 DMA and hints towards continued up move
* Increasing momentum / RS
* ADR 5.5%
Market analysis
* Forecasted for ~33% further increase
* Promoter holding high at 74.82% and remains steady
* Fils increasing holding
*MFs and Dils are increasing stake
* Retail reducing
Cons
* Considering that the price has gapped up, there could be some pull back but overall structure of the 200 DMA line remains up
This analysis is for educational purposes only and should not be considered as financial advice. Trading and investing in financial markets involve significant risk, and past performance is not indicative of future results. You should conduct your own research and consult with a qualified financial advisor before making any trading or investment decisions. The author is not responsible for any financial losses or damages that may result from the use of this information.
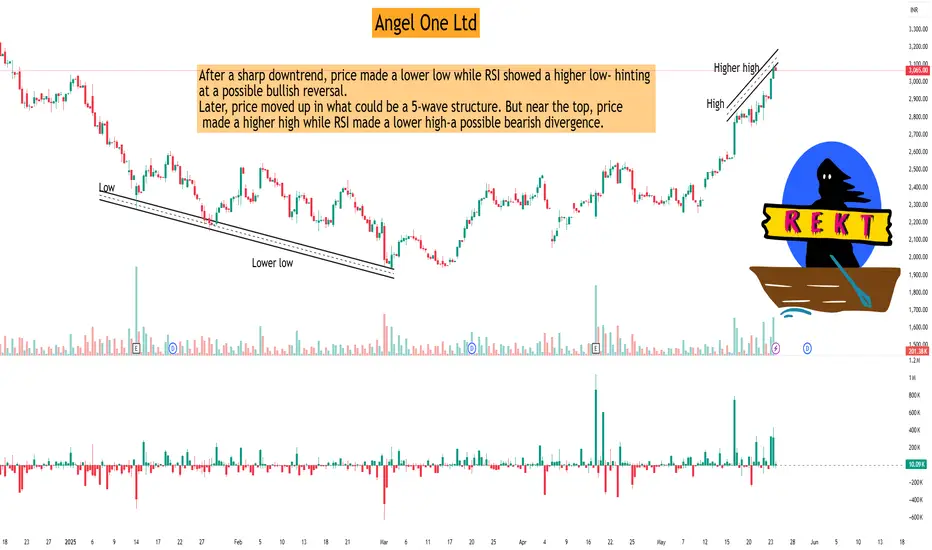
ANGEL ONE LTDANGEL ONE LTD
Finding Market Clues with Simple Tools
This is not a trade I took - just an observation I found fascinating and wanted to share.
In ANGEL ONE's recent price action, I applied a simple 3-step process:
Identify a turning point
Spot a potential 5-wave Elliott Wave structure
Look for RSI divergence at key highs/lows
After a sharp downtrend, price made a lower low while RSI showed a higher low- hinting at a possible bullish reversal.
Later, price moved up in what could be a 5-wave structure. But near the top, price made a higher high while RSI made a lower high-a possible bearish divergence.
I didn't trade this setup - but it's fascinating how often these simple techniques reveal potential market shifts. It's not about being right every time, but about learning to read the market structure better.
Books like Elliott Waves Made Simple by Steve Sinclair have helped me more than any social media post. They teach you to think with structure, not noise.
This isn't a buy/sell recommendation. Just sharing something I'm practicing. Mistakes will happen, but that's part of the learning curve. The market is always there - it's on us to keep improving our technical reading.