IDFC First Bank cmp 83.79 by Weekly Chart viewIDFC First Bank cmp 83.79 by Weekly Chart view
- Support Zone 66 to 75 Price Band
- Resistance Zone 84 to 93 then ATH 100.70
- Bullish Cup and Handle setup made on the chart
- Falling Resistance Trendlines Breakouts well sustained
- Volumes are in close sync with the average traded quantity
Idfcfirstbank

IDFC FIRST BANK: Reversal Play for 20% upside⚡️Price Analysis:
1️⃣ Price broke the resistance.
2️⃣ Price structure is bullish.
3️⃣ Price trading above EMAs
4️⃣ Strong candle formation.
✨ Key Observations:
➡️ RRR favorable at CMP.
➡️ Price should break the immediate marked resistance to build further strength & momentum.
➡️ Overall banking sector is strong.
⚠️ Disclaimer: This is NOT a buy/sell recommendation. This post is meant for learning purposes only. Views are personal. Please, do your due diligence before investing.⚠️
💬 Share your thoughts in the comments below! ✌️
🔥Trade Safe!✅🚀
IDFC First (D) - High-Volume Breakout Confirms Bullish ReversalAfter a significant downtrend from its All-Time High in September 2023, IDFC First Bank has been in a clear trend reversal since April 2025. This new uptrend has just been powerfully confirmed by a high-volume breakout, signaling strong buyer commitment.
This Week's Decisive Breakout
The past week has been pivotal for the stock, culminating in a decisive technical event:
- Massive Weekly Volume: The stock has surged +9.85% so far this week, supported by an enormous total volume of 207.92 million shares .
- Today's Confirmation: Today's session (Thursday, October 23, 2025) saw a +2.85% gain on a massive 94.12 million shares, confirming the bullish conviction.
- Key Resistance Breach: Most importantly, the stock broke out and closed above a key short-term horizontal resistance trendline that had been in place since July 2025.
Broad-Based Technical Strength
This bullish price action is strongly underpinned by a powerful alignment of momentum indicators across all major timeframes (Monthly, Weekly, and Daily):
- Short-Term EMAs: All three timeframes are in a bullish Positive Crossover (PCO) state.
- RSI (Relative Strength Index): The RSI is also in a rising trend on all three timeframes.
This multi-timeframe alignment indicates that the bullish momentum is broad, synchronized, and strengthening.
Outlook and Key Levels to Watch
With the resistance now cleared, the path of least resistance has shifted upwards.
- Bullish Target: If this bullish momentum continues, the next logical area of resistance and potential target is the ₹90 level.
- Critical Support: The recently broken resistance now becomes the most critical new support level. A successful retest of this level would be a strong sign, while a failure to hold it would be a warning. A deeper support level exists at ₹70 , but the immediate focus should be on the new breakout zone.

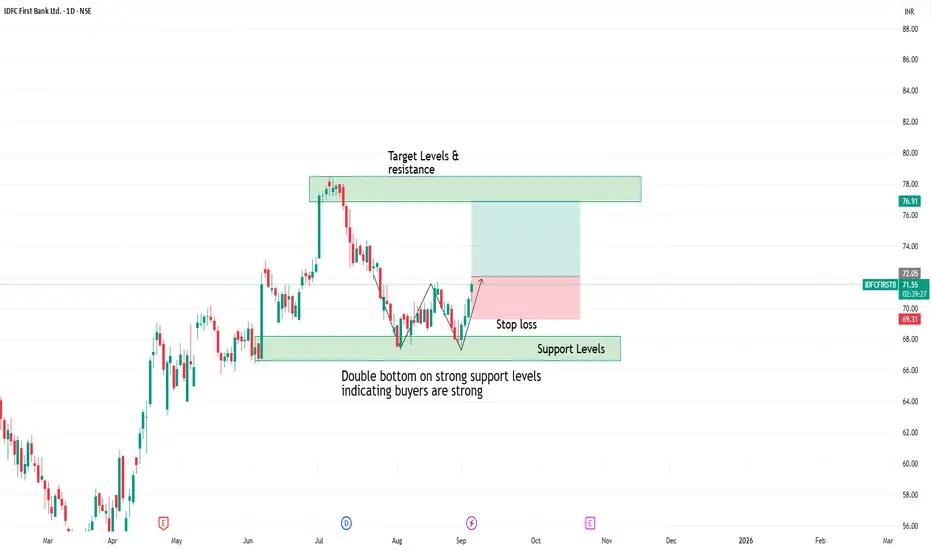
Double bottom created in idfc first bank Double bottom created on support levels
which indicates buyers are strong and accumulating at support levels
one can observe this for upside movement with strict stoploss
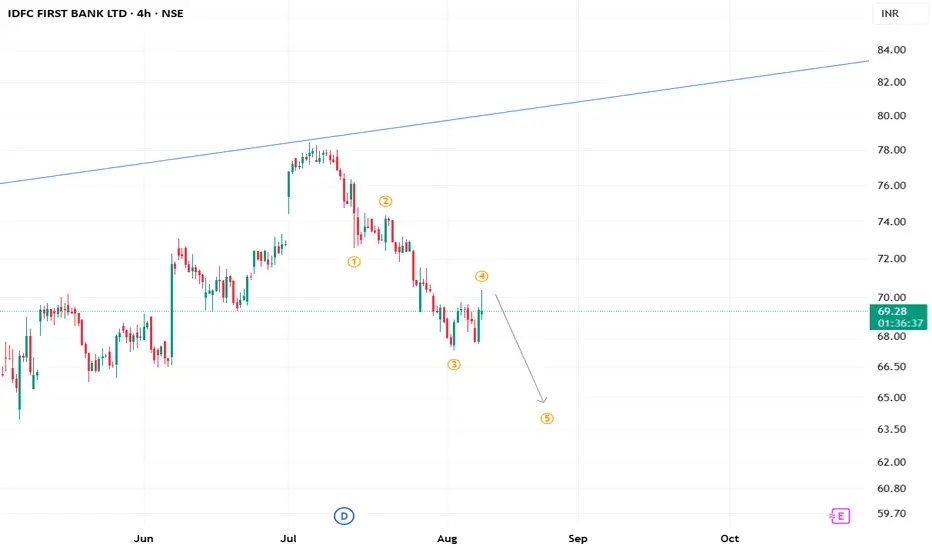
IDFC First Bank to make fresh lows?With intense pressure from the top, we may say a fresh low in IDFC First Bank. Currently looking to have completed its micro degree wave 4 in its downtrend
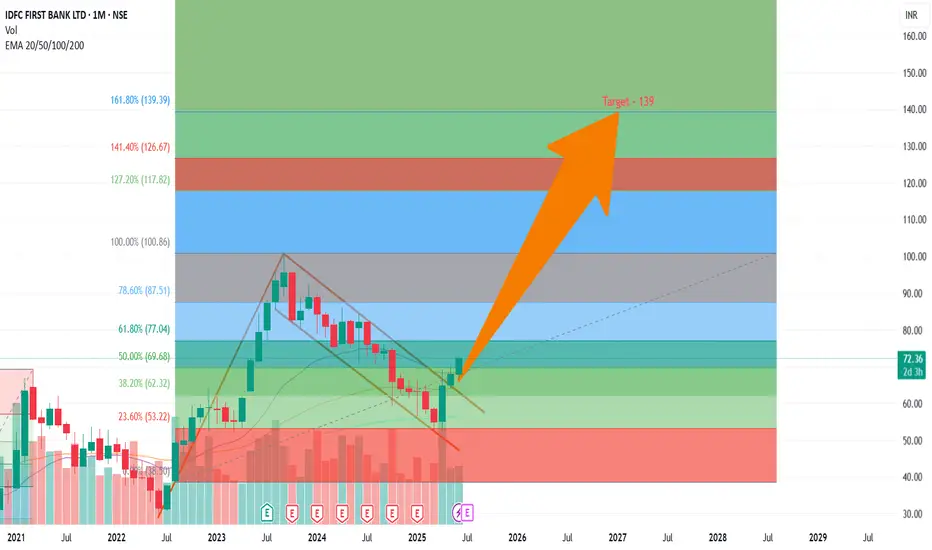
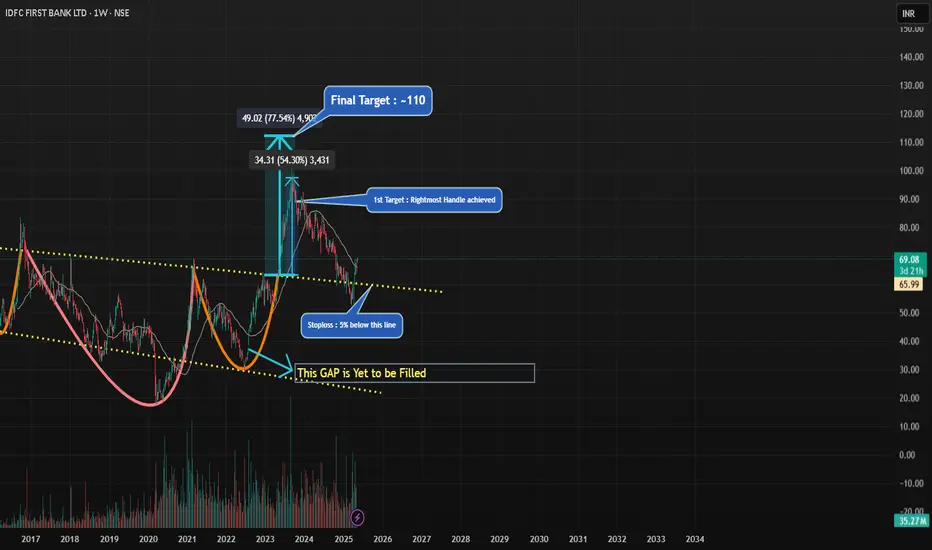
LONG IDFC FIRST BANK - Target - 139On Monthly chart IDFC first Bank has broken out from flag and Pole pattern.
Indicating a strong bullish Momentum.
Stop Loss is 61
Target 1 - 100
Target 2 - 110
Target 3 - 139
IDFC FIRST BANKIDFCFIRSTBANK.
Anything above 112 should be part of euphoria that may extend upto 164.17 (if sentiment allows); corrective 5th may end around 50-53 and then final thrust towards new high (5th) should begin. (If , moves past 80-83 without 5th correction , corrective wave count will be invalid).
Labelling of counts can be wrong in this, but you get the idea.

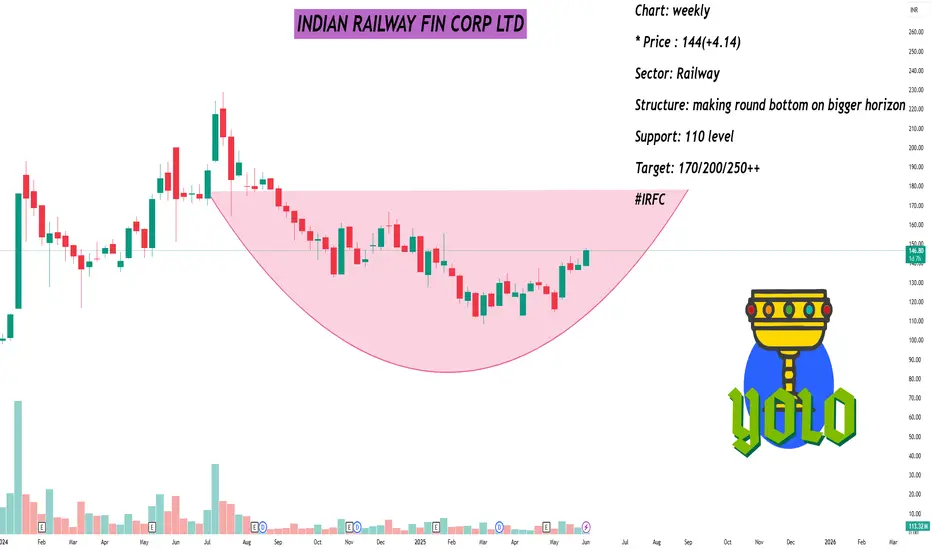
INDIAN RAILWAY FIN CORP LTDSTOCK OF THE DAY
Stock: Indian Railway Fin Corp L
Chart: weekly
* Price : 144(+4.14)
Sector: Railway
Structure: making round bottom on bigger horizon
Support: 110 level
Target: 170/200/250++
#IRFC
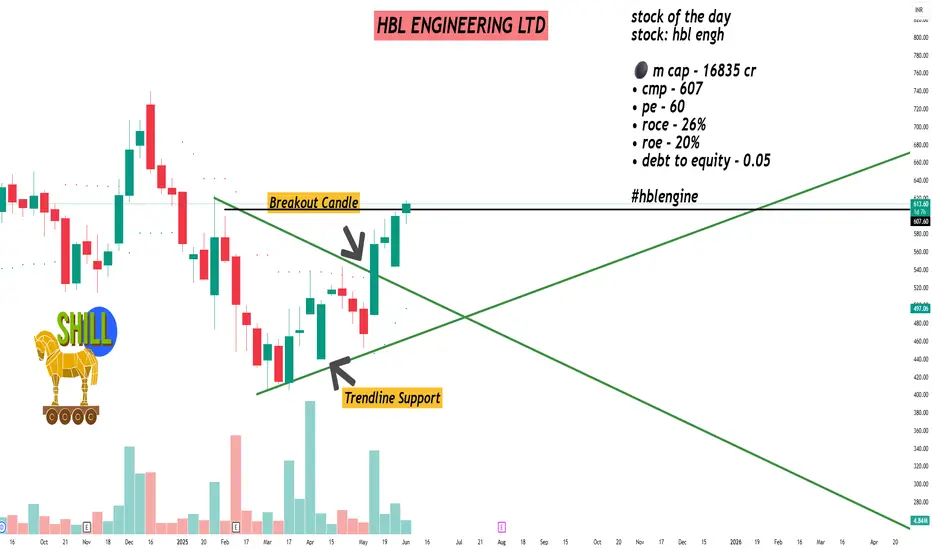
HBL ENGINEERING LTDstock of the day
stock: hbl engh
⚫ m cap - 16835 cr
• cmp - 607
• pe - 60
• roce - 26%
• roe - 20%
• debt to equity - 0.05
#hblengine
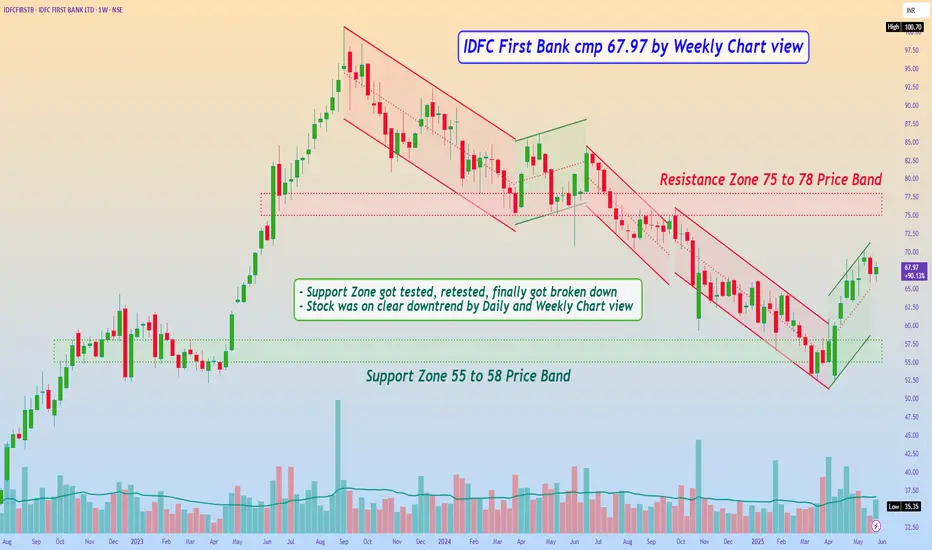
IDFC First Bank cmp 67.97 by Weekly Chart viewIDFC First Bank cmp 67.97 by Weekly Chart view
- Support Zone 55 to 58 Price Band
- Resistance Zone 75 to 78 Price Band
- Support Zone got tested, retested, finally got broken down
- Stock was on clear downtrend by Daily and Weekly Chart view
- Stock took support near old price level 50 to 52 to reverse upside
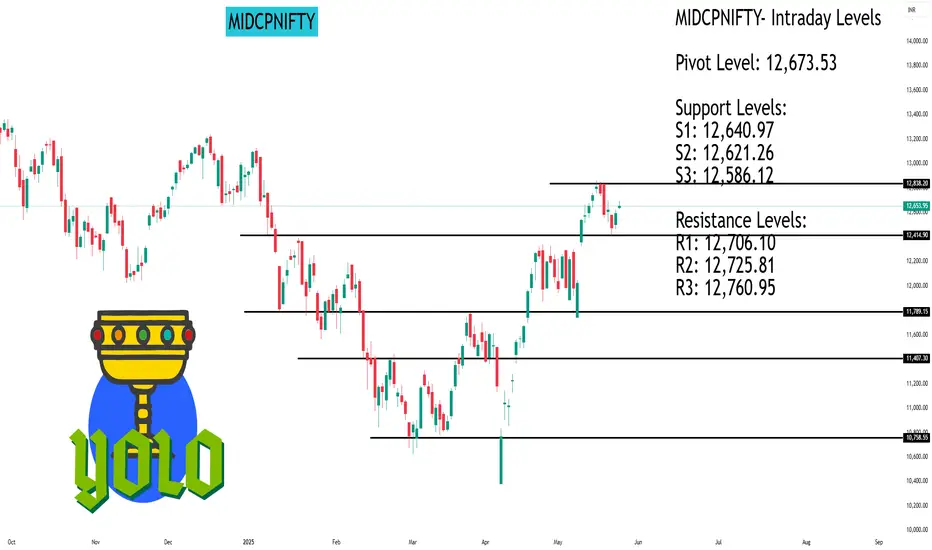
MIDCPNIFTY MIDCPNIFTY- Intraday Levels
Pivot Level: 12,673.53
Support Levels:
S1: 12,640.97
S2: 12,621.26
S3: 12,586.12
Resistance Levels:
R1: 12,706.10
R2: 12,725.81
R3: 12,760.95
Intraday Strategy:
Bullish Scenario:
If MIDCPNIFTY sustains above 12,687.25, consider long positions targeting 12,706.10-12,725.81-12,760.95.
Stop-Loss: 12,682.10
Bearish Scenario:
If MIDCPNIFTY breaks below 12,659.82, consider short positions targeting 12,640.97-12,621.26-12,586.12.
Stop-Loss: 12,682.10
#MIDCPNIFTY
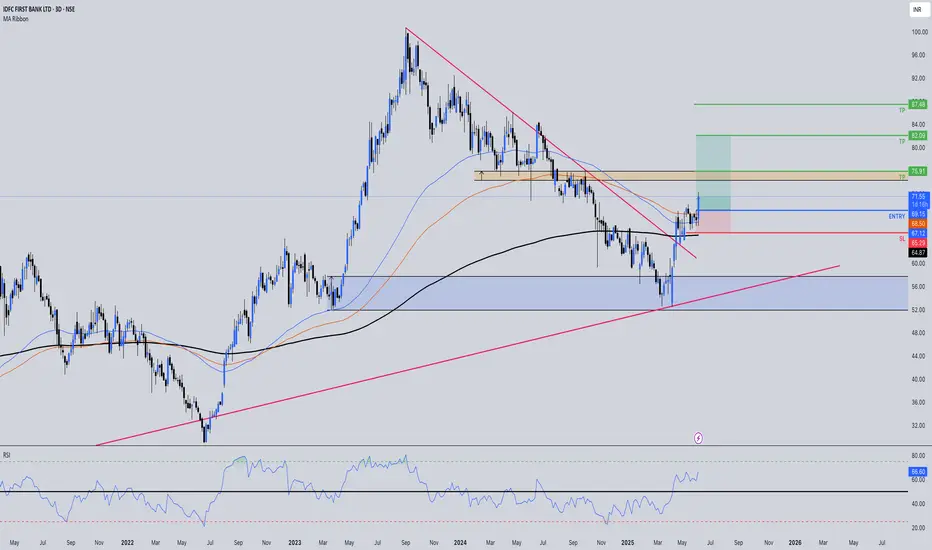
IDFC First Bank : ~70% upside is waitingIts best to select your stocks based on company bussiness (Check Q-o-Q & Y-o-Y sells, profit, debt level, NPA if bank/nbfc).
I believe in buy & hold good stocks (as per above parameters) having favorable technical pattern and sell once target is achieved.
So I keep my stolosses really deep and don`t believe in frequent entry and exit in stocks based on stoplosses .
Target & Stoploss are mentioned on the self explanatory chart .
Please feel free to comment or share your views on my analysis .
Note : I am not SEBI registered advisor . Please consider my analysis for education purpose only .
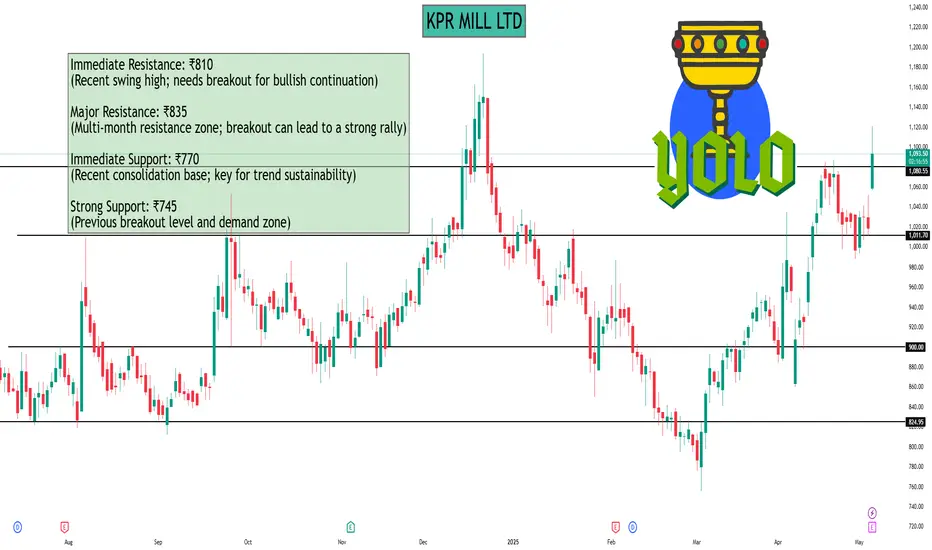
KPR MILL LTD KPR MILL LTD – 1-Day Chart Support & Resistance
Support and Resistance Levels (Daily Timeframe):
Immediate Resistance: ₹810
(Recent swing high; needs breakout for bullish continuation)
Major Resistance: ₹835
(Multi-month resistance zone; breakout can lead to a strong rally)
Immediate Support: ₹770
(Recent consolidation base; key for trend sustainability)
Strong Support: ₹745
(Previous breakout level and demand zone)
Trend Insight:
KPR Mill is in a medium-term uptrend, but facing consolidation near ₹810. A sustained close above ₹810 may trigger momentum, while ₹770 acts as a crucial support zone.
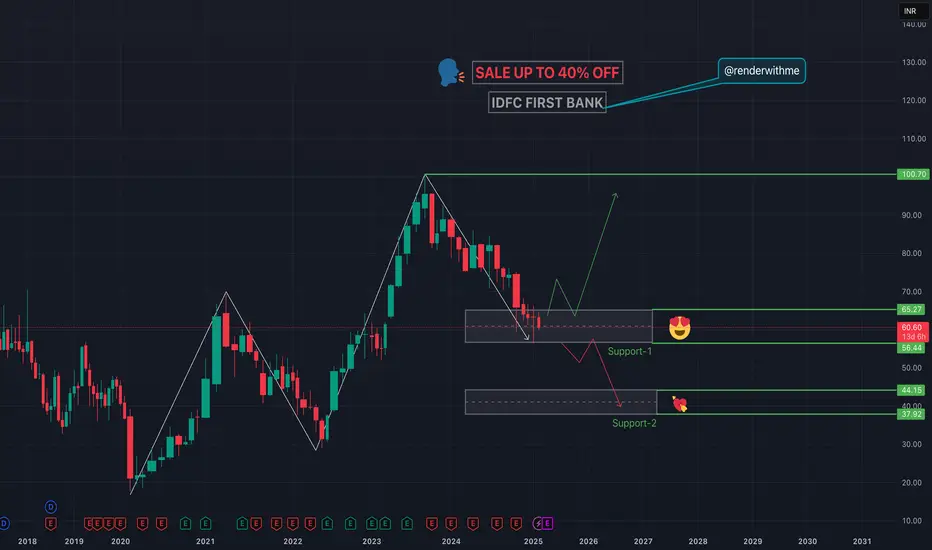
IDFC FIRST BANK - TECHNICAL#idfcfirstbank is an Indian private sector bank based in Mumbai, known for its wide range of banking services including personal banking, loans, accounts, cards, and investments. Here are some key levels in the chart about the bank #BankNifty #Nifty #renderwithme
IDFC FIRST BANK by KRS Charts5th Nov 2024 / 2:34 PM
Why IDFCFIRSTB ❓❓
1. First thing BULLS COUNTER ATTACK visible after correction.
2. Previous Gap got filled last Candle.
3. On higher TF Price is at Old Support zone.
4. Swing Entry Due to B.C. Attack setup what it means, mentioned in Chart.
Target - 86 Rs & 100 Rs.
SL 1D Closing - 63.80 Rs.

Double Rounding Bottom | HDFC BANK1️⃣ News on HDFC Bank
📍IPO Launch: ₹12,500 crore IPO for its subsidiary, HDB Financial Services
📍Profit Growth: 5.3% increase in net profit for the last quarter
📍Stock Surge: HDFC Bank shares have risen nearly 20% in three months
📍Market Position: High market cap and favorable investor sentiment
2️⃣Technical Analysis
⭕️Support around ₹1,500; important for maintaining upward momentum.
⭕️Breakout above ₹1,700 for potential buy signals.
⭕️Moving averages indicate bullish momentum.
⭕️Overbought territory suggests potential short-term corrections.
⚠️Conclusion
Strong fundamentals, including solid revenue growth The merger with HDFC Ltd. enhances its market presence, but it faces some margin pressures. Overall, it’s a good time to buy HDFC Bank stocks for long-term stability and growth, while keeping an eye on potential short-term volatility.
✅Check out my TradingView profile to see how we analyze charts and execute trades.
🙋♀️🙋♂️If you have any questions about this stock, feel free to reach out to me.
📍📌Thank you for exploring our idea! We hope you found it valuable.
🙏FLLOW for more !
👍LIKE if useful !
✍️COMMENT Below your view !

MY first choice IDFC FIRST BANK IDFC FIRST BANK have previous records and pattern and that repeat again
Technical points
1 - down rising channel
2- Strong support on bottom
3 - hold the top of fab. point
4 previous bull run was came when is go down in channel pattern
First channel performance
Date 31-jan-2022 to 6-dec-2022
first reached on top of 50 and came down 28 in the channel when given reversal to 62
second channel performance
6-dec-2022 to 5-sep-2023
on the top of 62 he came down and reached 52 and than get reversal and make top of 100
third 6-sep-2023 to 27-november today
now its reached at same price of 62 and create bottom now we looking for a fresh reversal and channel breakout
First TRG - 86
Second TRG -98 & 102
Third TRG 120 and above 140
SL 48
only for the long term time duration minimum 1 year

IDFCfirst Bank CUP & Handle Breakout RetestHello Everyone,
HDFC First Bank making Retest from Cup & handle Chart pattern Breakout restest with trendline also taking Support of 200ema.
Fibbo 61% retracement completed and rsi oversold with making repeated pattern as earlier.Stock price cmp 66 is 34% down from lifetime high of 100.

"It’s been a year now—could this be the turning point?"❓What do you think about this merger and future growth of IDFC First Bank?
⭕️"Can IDFC First Bank still become the next HDFC Bank?"⭕️
📍An order block zone is a price range where large institutions have placed significant buy or sell orders, creating strong support or resistance. These zones often lead to price reversals or consolidations
📍It help traders identify where the "smart money" (institutional money) has previously influenced the market, giving insight into likely future price reactions around these levels.
✅Technical Analysis:-
"For now, there is a bearish trend with a strong sell sentiment. However, once the order block is confirmed, the price may shoot up like any other stock."
✅Fundamental Analysis:-
⚡️A rise in IDFC Ltd could enhance sentiment towards IDFC First Bank.
⚡️Increased stock may improve the combined entity's market valuation.
⚡️profit after tax of ₹201 crore for Q2 FY25, up 28% compared to last year
⚡️The merger aims to enhance operational efficiencies and align management practices with leading private sector banks
✍️Nifty50 is officially below the BUDGET2024 swing low as of today. The support level of 23900 was tested and sustained today. Considering the chart structure more weakness is expected.(Take this into consideration too, while investing or trading)
👀IDFC First Bank's stock has declined recently due to the following issues:
⭕️The bank experienced a 10% drop in net profit for Q4 FY24
⭕️Provisions increased to ₹722 crore, raising concerns about managing non-performing assets effectively
💡Conclusion🎯
IDFC First Bank has established itself as a significant player in the Indian banking sector, focusing on retail and corporate banking services. The recent merger with IDFC Ltd. is expected to enhance its growth trajectory and operational efficiency.
✅Check out my TradingView profile to see how we analyze charts and execute trades.
⭕️ Swing Trading opportunity: Price Action Analysis Alert !!!⭕️
🙋♀️🙋♂️If you have any questions about this stock, feel free to reach out to me.
📍📌Thank you for exploring our idea! We hope you found it valuable.
🙏FLLOW for more !
👍LIKE if useful !
✍️COMMENT Below your view !

IDFC FIRST BANK - BREAKOUT / BREAKDOWNYou guys are smart if you really know how to trade this Pattern !
A rectangle chart pattern forms during a period of consolidation, where the price moves between parallel support and resistance levels. This pattern indicates indecision in the market, with buyers and sellers in equilibrium. The price bounces between these horizontal levels multiple times, creating a rectangular shape. Traders look for a breakout from this range to signal the next move. A bullish breakout occurs above the resistance, while a bearish breakout happens below the support. Volume typically decreases during the formation and spikes during the breakout, confirming the pattern’s validity.
Clear Accumulation/Distribution Happening, pay attention even if you dont want to trade it's fine !

IDFC | All Trendline Bull Breakout at the Same Time⭕️ Swing Trading opportunity: Price Action Analysis Alert !!!⭕️
💡FNO Stocks Trading📉📈📊
✅Check out my TradingView profile to see how we analyze charts and execute trades.
✅We can't conduct a thorough analysis in such a short span of time. We need to review it, post our findings, and then take action.
🙋♀️🙋♂️If you have any questions about this stock, feel free to reach out to me.
📍📌Thank you for exploring our idea! We hope you found it valuable.
🙏FLLOW for more !
👍LIKE if useful !
✍️COMMENT Below your view !

IDFCFIRSTBNK | Looking Bullish ⭕️ Swing Trading opportunity ! Hourly Analysis Alert !!!⭕️
#ThankU For Checking Out Our IDEA , We Hope U Liked IT 📌
🙏FOLLOW for more !
👍LIKE if useful !
✍️COMMENT Below your view !

IDFC FIRST BANK | Double Bottom | 62% RetracementEntry@74, SL-70,TG-84/98
IDFC First Bank Stock has complete 4th Wave and is now moving into 5th wave.
