Nifty Futures 22nd June 2023 EXPIRYIt would be very interesting to observe what happens when
1. Price opens within the range marked of Red, Blue and Green Lines.
2. Price opens below / above the range but within the range of the previous day
3. When there is a Gap up and Gap down opening.
If You are studying the charts in lower Time frames and observing price action, Let me know in comments your observations on the points 1,2 and 3 mentioned above.
Keep Following for LIVE UPDATES
Index

Bank Nifty Futures 22nd June 2023 ExpiryIt would be very interesting to observe what happens when
1. Price opens within the range marked of Red, Blue and Green Lines.
2. Price opens below / above the range but within the range of the previous day
3. When there is a Gap up and Gap down opening.
If You are studying the charts in lower Time frames and observing price action, Let me know in comments your observations on the points 1,2 and 3 mentioned above.
Keep Following for LIVE UPDATES

NIFTY : RoC CONTINUED ITS DIVERGENCE. Nifty today broke yellow uptrend line in morning and was well below it l. During last hrs ifty recovered and regain uptrend line. But ROC continue its divrgence and move further down near zero. On 18 considerig RoC divergence precautionary approach was taken and on 19 th nifty after making double top at 1880 it gave up all gains and short were considered at 18800.
Today nifty had made low of 18660, recovered all loss and closed at 18816 where shorts were onsidered.
How to Manage trade in this volatile Market.
Since double top is at 18880, risk reward ratio is 1: 11 ( for next expiry.). Short is considered at 18800. So loss is 5000 , going by chart if RoC continues its divergence then first target is at 20 D ema at 18650 ( today nifty almost did its target). Next support is at 18440, as ifty had managed to resume its uptrend from this level on 1st June . At this level shorts can covered or trailing SL of 18550 should be maintained since this was area where nifty was indecisive. And last if 18400 is broken then nifty can come to 18000. Here total 800 points profit is earned. I.e 40000 Rs.
To trade this way needs lots of patience and continuous monitoring and capital.
Here nifty levels are given as investors can book profit encash their holdings and re enter at lower levels. Divergence and other indication are looked for judging trend reversals. As soon as trend reversal is noticed precautions are taken (like suggested on 18th June) and start booking g profit.

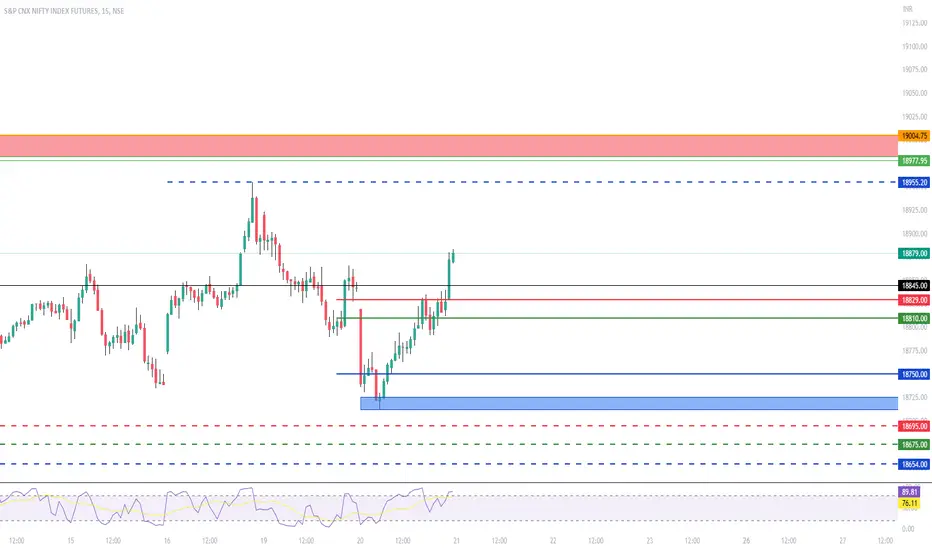
Nifty Futures 22nd June 2023Let's see how the day opens tomorrow. Price action should be watched, and a decision taken accordingly.
Will try and give some live market updates.
Keep following to understand the significance of these lines drawn and how and why these lines are very important.
Please go through the previous charts and check the price action and how these lines responded vis a vis the days open
Bank nifty Futures 22nd June 2023Let's see how the day opens tomorrow. Price action should be watched, and a decision taken accordingly.
Will try and give some live market updates.
Keep following to understand the significance of these lines drawn and how and why these lines are very important.
Please go through the previous charts and check the price action and how these lines responded vis a vis the days open

Nifty Continue ShortAs said ROC is showing divergence, todY nifty broke 3mths lo v uptrendine and regain it again. But ROC today had reached near zero today even though nifty recovered. When divergence analysis as uploaded 2 day before ,ROC was 1.64 and today evenghouvh nifty recovered ROR has gone below to 0.55. This means nifty is loosi g its strength and can come down to 18400 near 20 dema.
SL is 52 week high or double top @ 18890/19000

Nifty Futures 20th June 2023Lets see how the day opens on Monday. Price action should be watched and a decision taken accordingly.
Will try and give some live market updates.
Keep following to understand the significance of these lines drawn and how and why these lines are very important.
Please go through the previous charts and check the price action and how these lines responded vis a vis the days opening.

NIFTY : CLEAR DIVERGENCE OF ROC Nifty is in uptrend from March 23 (yellow trend line). ROC had made top of 5 and continously declining . (Yellow line slope on ROC. ROC is change in price b/w current price and price for certain no of periods ago.) This means current price is declining continously wrt to price certain no of periods ago, but nifty is moving continously in upward direction. This means ROC is moving in opposit direction to nifty from March 23 as shown with yellow lines drawn on nifty and ROC. This is known as divergence. Since this divergence is continued from last three months and now nifty near 52 week high, it is time for precaution. Also we can see that ROC is trying to move above the divergence line(yellow). If ROC cut the divergence line and move higher, it can be taken as upmove is continued, If ROC keep its divergence continued and move below 0 line, Its is to be taken as trend is reversing and confirmation will come only of yellow trend line is broken on down side.
Mac D is not showing any movement and is flat from last month
Conclusion.
Precautions to be taken while entering long.
Strict stop loss to be maintain
Concure FOMO, and wait for clear entry levels.

NIFTY FUTURES 16th JUNE 2023It would be very interesting to observe what happens when
1. Price opens within the range marked of Red, Blue and Green Lines.
2. Price opens below / above the range but within the range of the previous day
3. When there is a Gap up and Gap down opening.
If You are studying the charts in lower Time frames and observing price action, Let me know in comments your observations on the points 1,2 and 3 mentioned above.
Keep Following for LIVE UPDATES

Bank Nifty Futures 15th June 2023 levelsIt would be very interesting to observe what happens when
1. Price opens within the range marked of Red, Blue and Green Lines.
2. Price opens below / above the range but within the range of the previous day
3. When there is a Gap up and Gap down opening.
If You are studying the charts in lower Time frames and observing price action, Let me know in comments your observations on the points 1,2 and 3 mentioned above.
Keep Following for LIVE UPDATES

DOW REVERSING FROM RESISTANCE30th January,6th, and 13 Feb week were indecisive weeks at 34387. Today Dow had reversed from the same indecisive level which means Dow is not able to take out that resistance. Dow is looking like a shooting star bearish reversal. If Dow ends up with this candlestick pattern then With Sl of 50% of today's high and low, a short opportunity arise. Having said that extended candle above the up-trend channel is not tradable, today's 300 points fall is the answer.

Nifty Futures 14th June 2023I have posted enough Charts here for one to see how the price responds at the lines marked.
We can go down to lower Time frames of 5 min and 3 min to study the price action .
It would be very interesting to observe what happens when
1. Price opens within the range marked of Red, Blue and Green Lines.
2. Price opens below / above the range but within the range of the previous day
3. When there is a Gap up and Gap down opening.
Constant visualization and practice makes one familiar with what type of price action can come and what type of the day it can be.
The dotted lines can be tagged by price as these are untouched area where price can probably reach depending upon upward or downward movement.
Further studying the OI and unwinding on either side can help in deciphering a directional move. Along with the charts the study becomes more interesting.
14 hours ago
Comment:
If You are studying the charts in lower Time frames and observing price action, Let me know in comments your observations on the points 1,2 and 3 mentioned above.

Nifty Futures Levels 14th June 2023I have posted enough Charts here for one to see how the price responds at the lines marked.
We can go down to lower Time frames of 5 min and 3 min to study the price action .
It would be very interesting to observe what happens when
1. Price opens within the range marked of Red, Blue and Green Lines.
2. Price opens below / above the range but within the range of the previous day
3. When there is a Gap up and Gap down opening.
Constant visualization and practice makes one familiar with what type of price action can come and what type of the day it can be.
The dotted lines can be tagged by price as these are untouched area where price can probably reach depending upon upward or downward movement.
Further studying the OI and unwinding on either side can help in deciphering a directional move. Along with the charts the study becomes more interesting.
14 hours ago
Comment:
If You are studying the charts in lower Time frames and observing price action, Let me know in comments your observations on the points 1,2 and 3 mentioned above.

Bank Nifty Future Levels 13th June 2023I have posted enough Charts here for one to see how the price responds at the lines marked.
We can go down to lower Time frames of 5 min and 3 min to study the price action .
It would be very interesting to observe what happens when
1. Price opens within the range marked of Red, Blue and Green Lines.
2. Price opens below / above the range but within the range of the previous day
3. When there is a Gap up and Gap down opening.
Constant visualization and practice makes one familiar with what type of price action can come and what type of the day it can be.
The dotted lines can be tagged by price as these are untouched area where price can probably reach depending upon upward or downward movement.
Further studying the OI and unwinding on either side can help in deciphering a directional move. Along with the charts the study becomes more interesting.

Nifty Futures Levels 13th June 2023I have posted enough Charts here for one to see how the price responds at the lines marked.
We can go down to lower Time frames of 5 min and 3 min to study the price action .
It would be very interesting to observe what happens when
1. Price opens within the range marked of Red, Blue and Green Lines.
2. Price opens below / above the range but within the range of the previous day
3. When there is a Gap up and Gap down opening.
Constant visualization and practice makes one familiar with what type of price action can come and what type of the day it can be.
The dotted lines can be tagged by price as these are untouched area where price can probably reach depending upon upward or downward movement.
Further studying the OI and unwinding on either side can help in deciphering a directional move. Along with the charts the study becomes more interesting.

NIFTY 15 MIN CHART ANALYSISNifty on 29th May was trading in range 18650 to 18550. From last 2 days nifty again had made side ways from 18650to 18550 levels. Nifty support was 18580 before 8th June which was broken. But nifty recovered and went back to 18650. Point here is nifty is less volatile, which can increase in day or two. Nifty range is fixed at 18550 and 18650. Any move above and below range will be buying and selling opportunity. Today option strategy may be closed in profit.
Analysis is for education purpose. Any trade to be taken will be on self responsibility. Option trading needs losts of skill. So trade on your own risk

Nifty option loosing value.As said on 9th June to sell 1 lot call and 1 lot put . Hedge by selling 1 nifty future. Today nifty is as same level and options had lost value . 18600 ce and 18600 pe both have lost 50 Points and nifty is at 18606 . This side ways may continue till green trend is not broken comfortably

BankNifty Futures Levels 12.06.23I have posted enough Charts here for one to see how the price responds at the lines marked.
We can go down to lower Time frames of 5 min and 3 min to study the price action .
It would be very interesting to observe what happens when
1. Price opens within the range marked of Red, Blue and Green Lines.
2. Price opens below / above the range but within the range of the previous day
3. When there is a Gap up and Gap down opening.
Constant visualization and practice makes one familiar with what type of price action can come and what type of the day it can be.
The dotted lines can be tagged by price as these are untouched area where price can probably reach depending upon upward or downward movement.
Further studying the OI and unwinding on either side can help in deciphering a directional move. Along with the charts the study becomes more interesting.

Nifty Futures 11th June 2023I have posted enough Charts here for one to see how the price responds at the lines marked.
We can go down to lower Time frames of 5 min and 3 min to study the price action .
It would be very interesting to observe what happens when
1. Price opens within the range marked of Red, Blue and Green Lines.
2. Price opens below / above the range but within the range of the previous day
3. When there is a Gap up and Gap down opening.
Constant visualization and practice makes one familiar with what type of price action can come and what type of the day it can be.
The dotted lines can be tagged by price as these are untouched area where price can probably reach depending upon upward or downward movement.
Further studying the OI and unwinding on either side can help in deciphering a directional move. Along with the charts the study becomes more interesting.

ACWISince 2009 MSCI All country World index is in parallel channel. 77-72 is imp range to have bounce

NIFTY BREAKING 7 DAYS LOWER HIGHAs discussed yesterday nifty should hold yesterdays lower high . Today it had broken lower high and approaching support at uptrend green line. As per risk management long in nifty should be covered . Since Uptrend Line support is only 100 points, Also said Nifty could trade side ways from 18450 to 18700/800. this make nifty as no trade zone. in this market one can short nifty 1 lot and short put 1 lot and short call 1 lot. If nifty remains side ways you will eat up premium and nifty will be in marginal profit/loss ( Selling nifty is used for hedge) . Point to sell nifty is if in any extreme case market will come down, here nifty short position will protect you. Profit can be booked if you are getting 3% on Investment . Total investment will be around 2L
This is advice only and trade should be taken on personal financial adviser advice.

Nifty Short Term Analysis Nifty was just 100 points shy of making tripple top. Profit booking dragged nifty in red. Onth way down nifty had made new lower higher. 18478 on 2nd June. 18531on 6th June and 18615 today 8th June. The long term up trend is intact as far as nifty is holding 20DEMA at 18450. (Doted green line). If nifty not able to hold the lower high of last 7 days @ 18615,then nifty will see more selling there by dragging nifty to 18450. Since today RBI had hold repo rate, which was positive news. But market had taken it negetive. When ever we see buy rumers and sell news in market, market had corrected significantly. Here case is not today itself market will correct but it's seems on horizon. How deep correction will be or there will be any corrections don't know but it's time for precautions. Mac D is not showing significant cross over. This makes prediction more difficult. Lack of significant sell or buy signal on macd, nifty may behave side way too with 18450 to 18800 range.

Nifty Futures Levels 8th June 2023Special markings in Red, blue and Green solid lines are very important areas and opening of the trade in the morning gives us a reasonable idea along with other factors as to how the day should proceed.
If you have been following the levels from the previous charts by now you would have seen the importance of how correctly marked areas worked .
we can visualize from the chart where a trade with defined risk can be taken.
The dotted lines in red blue and green can be tagged incase of a break on either side. The dotted lines ate the untouched VAH, VAL or poc which can be tagged.
If you carefully watch the previous charts you will understand how the dotted lines get tagged during the course of the day
Keep following for live market updates.
Follow the chart in 5 min and 3 min time frame also
