Support Holds, Volatility Fades — Fresh Rally Ahead for Nifty?Indian markets were volatile last week. Initial uncertainty after the Union Budget was followed by a strong positive reaction to the India–US trade deal.
Nifty moved in a wide range during the week but ended higher.
India VIX fell by around 12%, showing that volatility has reduced after major events.
◉ Key Levels
Immediate Support: 25,400–25,500
Immediate Resistance: 26,000
Strong Resistance: 26,200–26,300
The sharp sell-off after the gap-up opening found a base near 25,500, establishing it as a strong demand zone.
◉ Technical View
The overall trend remains positive above 25,400. A sustained move above 26,000 is needed for further upside, and a clear breakout above 26,300 could lead to the next rally.
◉ Key Triggers for the Week
India–US Trade Deal: Lower US tariffs (18%) improve visibility for exporters and foreign investors, supporting sentiment.
Inflation Data: Domestic CPI/WPI and global inflation prints will influence interest rate expectations and risk appetite.
Q3 FY26 Earnings: Results from banks, financials, IT, and other index heavyweights will drive sector leadership and Nifty direction.
◉ Trading Strategy
Traders should follow a buy-on-dips strategy near support levels and avoid taking aggressive positions until Nifty decisively moves above the 26,000–26,300 zone.
Indexanalysis

ETFs and Index Funds Trading1. Introduction to ETFs and Index Funds
Exchange-Traded Funds (ETFs) and Index Funds are two popular investment vehicles that allow investors to gain exposure to a broad set of securities without directly owning individual stocks or bonds. Both are designed to track the performance of a specific index, such as the Nifty 50, S&P 500, or Sensex. However, they differ in structure, trading mechanism, and investor flexibility.
Index Funds: These are mutual funds that aim to replicate the performance of a benchmark index. They are passively managed, meaning fund managers do not actively pick stocks but instead mirror the index’s composition. Investors buy and sell index fund units at the end-of-day Net Asset Value (NAV).
ETFs: ETFs are similar to index funds in that they track an index or a sector, but they trade like stocks on stock exchanges. Investors can buy and sell ETF shares throughout the trading day at market prices, which may be above or below the fund’s NAV.
Key advantage: Both instruments provide diversification, lower costs, and simplicity, making them ideal for long-term investing and systematic investment plans.
2. Structure and Mechanics
Index Funds
Operate like mutual funds.
Investors place an order to buy or sell, and transactions are executed once a day at the NAV.
NAV is calculated by dividing the total value of the fund’s assets by the number of units.
Ideal for investors looking for passive, long-term wealth creation without worrying about intraday price movements.
ETFs
ETFs are open-ended funds whose shares are listed on stock exchanges.
ETFs can be bought or sold anytime during market hours at the prevailing market price.
The price can deviate slightly from the NAV, creating premium or discount scenarios.
ETFs have a creation and redemption mechanism where institutional investors can exchange a basket of underlying securities for ETF shares or vice versa. This keeps the market price close to NAV.
3. Types of ETFs and Index Funds
Index Funds
Equity Index Funds: Track stock market indices (Nifty 50, Sensex, S&P 500).
Bond Index Funds: Track bond indices, providing fixed-income exposure.
Sectoral or Thematic Index Funds: Follow specific sectors like technology or energy.
International Index Funds: Track foreign indices for global diversification.
ETFs
Equity ETFs: Track stock indices or sectors.
Bond ETFs: Focus on government or corporate bonds.
Commodity ETFs: Track commodities like gold, silver, or oil.
Inverse and Leveraged ETFs: Designed for short-term trading to profit from market declines or magnified returns.
4. Trading ETFs vs. Investing in Index Funds
Trading ETFs
ETFs can be actively traded, making them suitable for short-term strategies.
They allow for stop-loss, limit orders, and margin trading, offering more flexibility.
Suitable for investors who want liquidity and tactical exposure to indices or sectors.
ETF prices fluctuate during the day, so trading requires monitoring market trends and technical analysis skills.
Investing in Index Funds
Index funds are better for long-term buy-and-hold investors.
Simpler to manage as they don’t require daily monitoring.
Contributions can be automated via SIPs (Systematic Investment Plans).
Lower risk of timing the market, focusing instead on consistent wealth accumulation.
5. Costs and Efficiency
Expense Ratios: Both ETFs and index funds are cheaper than actively managed funds. ETFs usually have slightly lower expense ratios, as they don’t have active management costs.
Brokerage Fees: ETFs incur trading commissions similar to stocks. Index funds may have entry or exit loads, depending on the provider.
Tax Efficiency: ETFs are generally more tax-efficient due to the in-kind creation/redemption mechanism, reducing capital gains distributions. Index funds distribute capital gains to investors, which may incur taxes.
6. Advantages of ETFs and Index Funds
Diversification: Both instruments reduce unsystematic risk by spreading investments across multiple stocks or bonds.
Lower Costs: Passive management reduces fees significantly compared to active funds.
Transparency: ETFs disclose holdings daily, while index funds reveal portfolio composition periodically.
Accessibility: ETFs can be purchased in small quantities like individual stocks. Index funds allow SIPs for gradual wealth accumulation.
Liquidity (ETFs only): ETFs provide intraday liquidity, meaning you can buy or sell shares at any time during trading hours.
7. Risks and Limitations
Market Risk: Both are exposed to market fluctuations. Tracking an index means investors bear the ups and downs of the underlying index.
Tracking Error: Minor differences can occur between the ETF or index fund’s performance and the benchmark index due to fees, expenses, or liquidity issues.
Liquidity Risk (ETFs): Some niche or sector-specific ETFs may have low trading volumes, causing higher bid-ask spreads.
No Outperformance: Since both are passively managed, investors cannot expect to beat the market.
8. Popular Strategies for Trading ETFs
Buy and Hold: Similar to index fund investing, suitable for long-term wealth creation.
Sector Rotation: ETFs allow quick exposure to sectors likely to outperform.
Hedging: Using inverse or leveraged ETFs to hedge portfolio risks.
Swing Trading: Taking advantage of short-term price movements of ETFs.
Arbitrage: Exploiting premium and discount differences between ETF market price and NAV.
9. Practical Considerations for Indian Investors
Indian ETFs: Nifty 50 ETFs, Sensex ETFs, Gold ETFs, Bank Nifty ETFs.
Index Funds: Available from major mutual fund houses like SBI, HDFC, ICICI, and Nippon.
SIPs in Index Funds: Ideal for disciplined investing and rupee cost averaging.
Trading Platforms: ETFs require a demat and trading account, while index funds can be bought directly via fund houses or mutual fund platforms.
Regulatory Oversight: SEBI regulates both ETFs and index funds, ensuring transparency and investor protection.
10. Conclusion
ETFs and index funds provide investors with low-cost, diversified, and efficient ways to gain market exposure.
For long-term wealth creation, index funds and ETFs purchased via SIPs offer simplicity and compounding benefits.
For short-term trading, tactical moves, or hedging, ETFs provide flexibility with intraday liquidity and trading options.
Choosing between the two depends on investment horizon, trading experience, risk appetite, and convenience. Savvy investors often use a blend of both: index funds for disciplined long-term investing and ETFs for tactical or sector-specific exposure.

Global Equity Index Trading1. Understanding Equity Indices
An equity index is a statistical measure that tracks the performance of a selected group of stocks. These stocks are chosen based on criteria such as market capitalization, liquidity, sector representation, or geographic location. The index value moves according to the price changes of its constituent stocks, usually weighted by market capitalization or price.
Examples of major global equity indices include:
United States: S&P 500, Dow Jones Industrial Average (DJIA), NASDAQ 100
Europe: FTSE 100 (UK), DAX 40 (Germany), CAC 40 (France), STOXX 50
Asia: Nikkei 225 (Japan), Hang Seng Index (Hong Kong), Shanghai Composite (China)
India: NIFTY 50, Sensex
Global/Regional: MSCI World Index, MSCI Emerging Markets Index
Each index acts as a barometer of economic health and investor sentiment in that region.
2. Instruments Used in Global Index Trading
Global equity indices can be traded through multiple financial instruments:
a) Index Futures
Index futures are standardized contracts traded on exchanges that allow participants to buy or sell an index at a predetermined price for a future date. They are widely used for speculation, hedging, and arbitrage due to high liquidity and leverage.
b) Index Options
Options provide the right, but not the obligation, to buy or sell an index at a specified strike price before expiry. Traders use them for hedging portfolios, volatility strategies, and income generation.
c) Exchange-Traded Funds (ETFs)
Index ETFs track the performance of a specific equity index and trade like stocks. They are popular among long-term investors and swing traders due to transparency and low expense ratios.
d) Contracts for Difference (CFDs)
CFDs allow traders to speculate on index price movements without owning the underlying assets. They are widely used in global markets but are regulated differently across jurisdictions.
3. Why Trade Global Equity Indices?
a) Diversification
Trading an index provides exposure to dozens or hundreds of companies at once, reducing company-specific risk compared to individual stocks.
b) High Liquidity
Major indices like the S&P 500 or NASDAQ 100 have deep liquidity, tight spreads, and smooth price movements, making them suitable for both short-term and long-term strategies.
c) Macro Exposure
Indices respond strongly to economic data, central bank decisions, geopolitical events, and global risk sentiment, making them ideal for macro traders.
d) Extended Trading Hours
Because global markets operate in different time zones, index trading opportunities exist almost 24 hours a day.
4. Key Factors Influencing Global Index Prices
a) Macroeconomic Data
Indicators such as GDP growth, inflation, employment data, PMI, and consumer confidence have a direct impact on equity indices.
b) Central Bank Policies
Interest rate decisions, quantitative easing, and monetary policy guidance from central banks like the Federal Reserve, ECB, BOJ, and RBI significantly influence index trends.
c) Corporate Earnings
Since indices are composed of multiple companies, aggregate earnings growth or decline plays a critical role in index valuation.
d) Global Risk Sentiment
Events such as wars, trade tensions, pandemics, or financial crises cause shifts between risk-on and risk-off behavior, impacting global indices simultaneously.
e) Currency Movements
For international traders, currency strength or weakness can affect index performance, especially in export-driven economies.
5. Trading Styles in Global Equity Index Trading
a) Intraday Trading
Intraday traders focus on short-term price movements using technical analysis, volume, and market profile. High volatility sessions such as US market open are particularly popular.
b) Swing Trading
Swing traders hold positions for several days to weeks, aiming to capture medium-term trends driven by macro data or earnings cycles.
c) Positional and Long-Term Investing
Investors use index ETFs or futures to gain long-term exposure to economic growth, often using dollar-cost averaging or asset allocation strategies.
d) Arbitrage and Spread Trading
Institutional traders exploit price differences between cash indices, futures, and ETFs or between indices across regions.
6. Technical Analysis in Index Trading
Technical analysis plays a vital role in global equity index trading. Commonly used tools include:
Trend Analysis: Moving averages, trendlines, and channels
Momentum Indicators: RSI, MACD, Stochastic Oscillator
Support and Resistance: Key price levels where demand and supply balance
Volatility Measures: VIX, ATR, Bollinger Bands
Market Breadth Indicators: Advance-decline ratios, sector performance
Because indices tend to trend smoothly compared to individual stocks, technical patterns often work more reliably.
7. Risk Management in Index Trading
Effective risk management is essential due to leverage and global volatility:
Position Sizing: Risking a fixed percentage of capital per trade
Stop-Loss Placement: Based on technical levels or volatility
Correlation Awareness: Many global indices are correlated, increasing portfolio risk
Event Risk Management: Reducing exposure before major economic announcements
Professional traders prioritize capital preservation over aggressive returns.
8. Advantages and Limitations
Advantages
Broad market exposure
Lower company-specific risk
High liquidity and transparency
Suitable for hedging and speculation
Limitations
Limited upside compared to high-growth individual stocks
Exposure to systemic risk during global crises
Dependence on macroeconomic and policy factors
9. Role of Global Indices in Portfolio Management
Global equity indices are widely used in asset allocation and portfolio construction. Investors balance exposure between developed and emerging markets, sectors, and regions using index products. They also serve as benchmarks to evaluate fund and portfolio performance.
10. Conclusion
Global equity index trading is a cornerstone of modern financial markets, offering traders and investors a powerful way to participate in worldwide economic growth and market movements. By trading indices, participants gain diversified exposure, high liquidity, and access to macroeconomic themes that shape global finance. Success in this domain requires a solid understanding of economic fundamentals, technical analysis, risk management, and global intermarket relationships. Whether used for short-term trading or long-term investing, global equity indices remain one of the most efficient and widely traded financial instruments in the world.

Nifty Metal - Breakout Setup, Move is ON...#CNXMETAL trading above Resistance of 11523
Next Resistance is at 15060
Support is at 9968
Here are previous charts:
Chart is self explanatory. Levels of breakout, possible up-moves (where index may find resistances) and support (close below which, setup will be invalidated) are clearly defined.
Disclaimer: This is for demonstration and educational purpose only. This is not buying or selling recommendations. I am not SEBI registered. Please consult your financial advisor before taking any trade.

Nifty Metal - Breakout Setup, Move is ON...#CNXMETAL trading above Resistance of 8747
Next Resistance is at 11523
Support is at 6740
Here is previous chart:
Chart is self explanatory. Levels of breakout, possible up-moves (where index may find resistances) and support (close below which, setup will be invalidated) are clearly defined.
Disclaimer: This is for demonstration and educational purpose only. This is not buying or selling recommendations. I am not SEBI registered. Please consult your financial advisor before taking any trade.

Indian Markets on Hold: Nifty Awaits the Next Big TriggerIndian markets remained range-bound last week, with the Nifty ending on a flat note. Participants stayed cautious as volatility showed early signs of revival, with India VIX inching up to 11.37.
◉ Technical Setup
From a technical standpoint, the index briefly slipped below the rising wedge support, but the move failed to attract strong selling pressure. Nifty continues to consolidate in a narrow band, suggesting indecision rather than a trend reversal.
This phase of consolidation is likely to extend into the coming week unless key levels are breached.
◉ Key Levels to Watch
The broader structure remains unchanged from last week.
Resistance: 26,000–26,100
Strong call writing in this zone makes it a tough hurdle.
Support: 25,500–25,400
A solid put base is visible here, offering near-term support.
A decisive break below 25,400 could open the door for a sharp downside move, pulling the index closer to 25,000.
◉ Key Triggers for the Week
Q3 Earnings Season – Results from large and mid-cap companies across sectors will guide stock-specific action and influence overall market sentiment.
India–US Trade Deal – Comments or policy moves around trade negotiations, especially related to agricultural tariffs, could impact sentiment and sectoral stocks.
◉ Weekly Outlook
The near-term outlook remains neutral, with Nifty expected to trade within a defined range until a decisive breakout or breakdown occurs.
◉ Trader’s Insight
Until Nifty decisively holds above 26,000, aggressive long positions across the board should be avoided. A selective, stock-specific approach, backed by strict risk management, is better suited to the current market environment.

Dalal Street Bleeds: Where Is NIFTY Headed Next?Indian markets witnessed a sharp sell-off last week, with the benchmark NIFTY closing 2.45% lower, as weak global cues and rising uncertainty dragged investor sentiment.
Adding to the caution, India VIX NSE:INDIAVIX jumped nearly 16%, settling at 10.92 after hitting multi-month lows earlier. This sudden spike in volatility clearly signals growing nervousness among market participants.
◉ Technical Picture Turns Weak
For the past few weeks, we consistently highlighted the formation of a Rising Wedge pattern on the daily chart—typically a bearish setup.
With Friday’s close below the wedge support, NIFTY has now confirmed a downside breakout, indicating that further pressure may persist in the near term.
To add to the concern, a Double Top pattern has also emerged on the charts, strengthening the bearish undertone for the coming sessions.
◉ Key Levels to Watch
Resistance Zone: 26,000 – 26,100
This area has now turned into a strong resistance, backed by heavy call writing, making it difficult for NIFTY to move higher in the short term.
Support Zone: 25,500 – 25,400
This is the immediate support area to watch closely.
A decisive break below this zone could open the door for a sharp 500-point fall, pulling the index closer to the 25,000 level.
◉ Key Triggers for the Upcoming Week
Q3 Earnings Season Kicks Off
Market focus will be on IT majors—TCS NSE:TCS , Infosys NSE:INFY , HCL Tech NSE:HCLTECH , Wipro NSE:WIPRO , and Tech Mahindra NSE:TECHM —along with heavyweights like Reliance Industries NSE:RELIANCE and HDFC Bank NSE:HDFCBANK . Earnings numbers and management commentary will play a crucial role in shaping near-term sentiment.
US Tariff Verdict
The US Supreme Court’s ruling on January 14 regarding Trump’s tariffs remains a major overhang. This decision could act as a key directional trigger, not just for India but for global and emerging markets as well.
◉ Outlook for the Coming Week
With weak global cues, rising volatility, and clear technical breakdowns, the market is likely to remain highly volatile, with a negative bias in the near term.
◉ What Traders Should Do
With volatility on the rise and technicals weakening, aggressive long positions can quickly turn risky. Until NIFTY shows stability above key support levels, traders are better off staying cautious, protecting existing profits, and focusing only on selective stocks that continue to show relative strength rather than chasing broad market moves.

Breakout in Nifty Auto...Chart is self explanatory. Levels of breakout, possible up-moves (where index may find resistances) and support (close below which, setup will be invalidated) are clearly defined.
Disclaimer: This is for demonstration and educational purpose only. This is not buying or selling recommendations. I am not SEBI registered. Please consult your financial advisor before taking any trade.

NIFTY Set to Sign Off 2025 Quietly—Could 2026 Bring a Rally?As we enter the last week of 2025 and approach the first week of 2026, Nifty is doing something familiar—consolidating in a tight range.
Everything looks calm at first glance: volatility is very low (India VIX at 9.15), trading volumes are light, and price changes are small. But history shows that such calm often comes before a big move.
◉ What it means actually?
● Nifty near lifetime highs, but breadth remains weak
● Low volatility → calm market, but risk of sudden moves
● Traders aren’t chasing the market, they’re waiting for a trigger rather than pushing prices higher.
◉ Technical View
● From a technical standpoint, Nifty continues to trade within a rising wedge pattern, which carries bearish implications in the short term.
● Looking at the broader structure, a cup-and-handle pattern is forming, typically pointing to a potential upside move once the neckline is decisively breached.
◉ Important Levels to Watch
● Immediate Resistance: 26,100 - 26,200
● Immediate Support: 25,900 - 26,000
Strong breakout or breakdown from here will decide the next big leg.
◉ Looking Ahead
As 2026 begins, markets will closely track:
● FOMC minutes, which could influence global rate expectations.
● Rupee movement and FII flows, key drivers of short-term sentiment.
◉ Strategy Insight
Until fresh catalysts emerge, markets may stay range-bound as they digest year-end positioning. With volatility compressed, stock-specific strategies and relative-strength setups may offer better opportunities than broad index trades.

NIFTY at a Pause: Consolidation Shapes the Near-Term TrendIndian equity markets ended the week on a slightly softer note, with the benchmark NIFTY slipping 0.53% on a weekly basis. While a supportive rate cut by the US Federal Reserve helped improve global sentiment and led to two consecutive sessions of gains, the broader trend remains mixed.
Adding to this, India VIX dropped 2.01% to 10.11, suggesting calm market conditions.
◉ Technical Setup: Key Pattern in Focus
On the daily chart, NIFTY is forming a rising wedge pattern and has recently bounced from its trendline support.
● Typically, a rising wedge reflects bearish undertones, especially near maturity.
● However, if the index manages to break above the upper resistance line and sustain, it could invalidate the bearish setup and shift sentiment positively.
● On the flip side, a decisive breakdown below support may open the door for a meaningful correction in the coming sessions.
◉ Important Levels to Watch
Based on open interest data, two critical zones are emerging as key for the current monthly expiry:
● Strong Support: 25,900 – 26,000
● Strong Resistance: 26,400 – 26,500
With no major triggers visible in the near term, NIFTY is likely to remain range-bound, consolidating between these levels.
◉ Strategy: Trade Smart, Stay Selective
Traders should maintain a moderately cautious stance in the current setup.
● Book or protect profits near higher levels.
● Avoid aggressive long positions until a clear breakout above 26,400–26,500 is confirmed.
● Prefer a stock-specific approach, focusing on names showing relative strength, while keeping risk management front and center.

Nifty Defence: Watch for Breakout or Pullback📈 Uptrend still intact but price is consolidating near highs.
📊 Testing key trendline support—will it hold or break? 🤔
🔺 Resistance: 7,634 | 8,135-8,302 | 8,870-9,195
🔻 Support: 7,369 | 6,347-6,707 | 5,025-5,132
🔝 Breakout to 9,195? Or pullback to 6,347? Eyes on the trendline! 👀
#NiftyDefence #IndexAnalysis #Trendline #BreakoutOrBreakdown #Investing #ChartAnalysis #PriceAction
📌 #Disclaimer: This analysis is shared for educational purposes only. It is not a buy/sell recommendation. Please do your own research before making any trading decisions.

NIFTY 50 – Near All-Time High | Breakout or Pullback? Chart Analysis 📈 (Weekly + Daily Analysis)
Nifty50 is trading close to its All-Time High zone around 26,350–26,400, showing strong bullish structure visible clearly on the Weekly timeframe with consistent Higher Highs & Higher Lows. Trend remains intact with no signs of major reversal yet.
Weekly Key Levels
Major Resistance: 26,350 – 26,500
Immediate Support: 25,950 – 26,000
Key Swing Support: 25,600
Major Trend Support: 24,900 – 25,100
Daily Observation
Price is consolidating near the resistance zone.
Volume is slightly decreasing → indicating a possible momentum slowdown
If price breaks above 26,400 with volume, a fresh breakout can lead to a strong continuation rally.
Breakout & Downside Scenarios
🟢 Bullish Breakout Above 26,400
Target Levels: 27,200 / 27,500
🔻 Pullback Scenario
First support: 26,000
Deeper support: 25,600
Market View
Long-term trend remains bullish
Short-term consolidation or mild pullback possible
Watch price reaction around 26,350–26,400 zone for next move confirmation
Summary
Nifty is at a decision point. A breakout above 26,400 can trigger a strong upside continuation, while a rejection can bring a healthy correction towards 26,000–25,600. Trend remains positive as long as the index holds the weekly support of 25,600.

NIFTY Hits New Highs but Breadth Weakens — What’s the Signal?The NIFTY 50 closed the week with a neat gain of 134.80 points (0.52%), touching fresh lifetime highs of 26,310.45.
Sounds impressive, right?
Yes — but there’s a twist.
A deeper look shows the Nifty 500 is still over 2.5% below its all-time high.
Meaning? This rally is not broad-based — it’s being carried by select large-cap heavyweights.
Meanwhile, the India VIX dropped 14.77% to 11.62, keeping volatility calm… for now.
◉ Key Levels to Watch This Week
Support Zones
● 26,000 — Strong and immediate support. Heavy put writing is visible here.
Resistance Zones
● 26,200 – 26,300 — Near-term supply zone
● 26,500 — Major resistance to beat
◉ Key Triggers This Week
1. RBI Policy – December 5
A 25 bps rate cut is widely expected, but the RBI may take a cautious approach as it balances low inflation with rising growth momentum.
2. Q2 GDP at 8.2%
The stronger-than-expected GDP print boosts sentiment but reduces the urgency for aggressive rate cuts, shifting the policy outlook toward a more measured stance.
3. India–US Trade Deal
Both countries are close to finalizing the agreement by year-end, which could support IT, manufacturing and export-focused sectors.
4. Rupee Weakness
The rupee’s slide to ₹89.49/$ raises import costs and potential inflation risks, adding pressure on the RBI while impacting corporate margins differently across sectors.
◉ December Outlook — What’s Likely Ahead?
● Base Case: NIFTY stays in a 26,000–26,500 range, with most upside already priced in.
● Bull Case: A breakout above 26,500 could send it toward 26,700 by month-end.
● Caution: If market breadth weakens further, volatility may creep back in.
◉ Strategy:
● As long as NIFTY holds above 26,000, sentiment stays positive.
● Dips above 26,000 = buying opportunity
● Avoid chasing breakouts blindly — focus on quality sectors and high-volume confirmations.
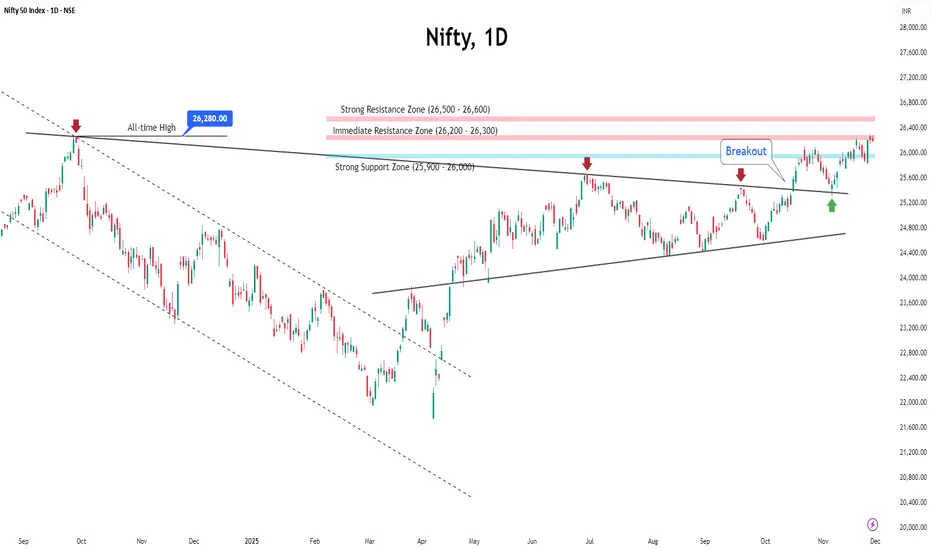
Nifty Breaks Above 26,000 — Can the Index Sustain This Strength?Indian markets ended the week on a positive note, with the Nifty rising 0.61% to close at 26,068. This came right after the index hit a fresh 52-week high of 26,246 on November 20 before cooling off.
Meanwhile, the India VIX jumped 14% to 13.63, reminding traders that volatility is quietly tightening its grip.
◉ Key Levels to Watch
Support Zones
Immediate support: 26,000.
Major support: 25,400 – 25,500, where strong put writing is visible
Resistance Zones
Near-term resistance: 26,200 – 26,300
Major resistance: 26,500
◉ Key Triggers This Week
Q2 GDP Data (Nov 28)
India’s GDP print for Q2 FY25–26 will be released this week.
Economists expect another strong reading, especially after Q1 GDP exceeded projections.
India–US Trade Deal Progress
Comments from Commerce Minister Piyush Goyal—hinting at “good news soon”—have lifted sentiment.
The proposed agreement aims to increase bilateral trade from $191 billion to $500 billion by 2030.
◉ Outlook & Strategy
For the coming week, a buy-on-dips approach remains favourable as long as Nifty sustains above 26,000.
A breakdown below this level could shift momentum, but for now, the bias stays positive with caution due to higher volatility.
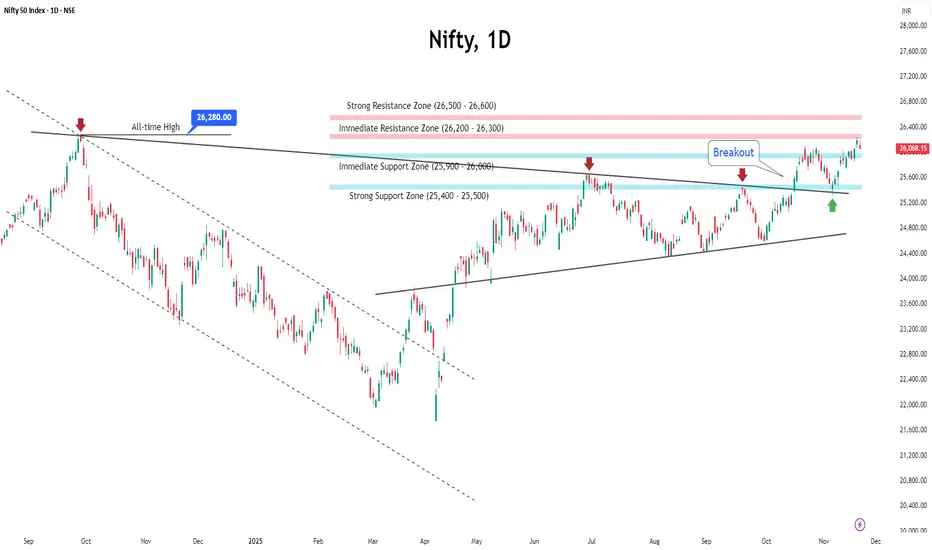
Nifty Builds Momentum, Breakout Looks Within ReachThe Indian market ended last week on a positive note, supported by the stronger-than-expected performance of the National Democratic Alliance (NDA) in the 2025 Bihar elections.
Nifty jumped over 1.5% to close at 25,910, just below the key resistance level of 26,000. Volatility also eased, with the India VIX falling over 5% on a weekly basis to settle at 11.93.
Open interest data suggests that the 25,700–25,800 zone will now act as immediate support, while 25,500 remains a strong support level.
Recent price action indicates that Nifty may attempt to break above the 26,000 resistance in the coming sessions.
In the week ahead, the overall sentiment is expected to stay positive due to strong domestic cues. Globally, market direction will depend on key U.S. economic releases, including the minutes of the latest FOMC meeting.
Investors should stick to a stock-specific approach, focusing on sectors supported by domestic demand. For traders, a buy-on-dips strategy remains favourable as long as Nifty holds above its key support zones.
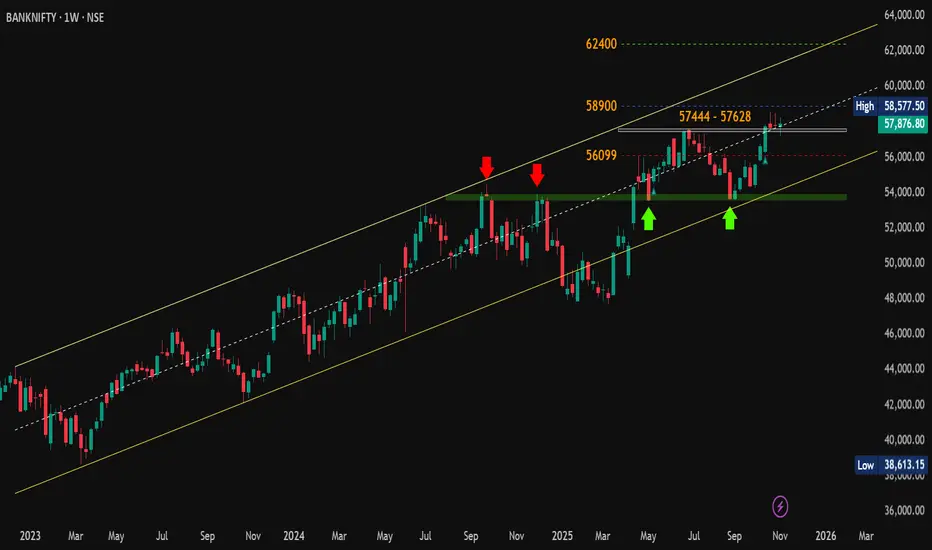
#BankNifty Weekly UpdateThe index is holding strong above the breakout zone 💪 confirming support around 57444 - 57628 .
With sustained strength, #BankNifty looks set for the next breakout towards 58,900 → 62,400 🎯
As long as the ✅ green zone support holds, the 🐂 bullish structure remains intact.
#BankNifty | #BullishTrend | #AllTimeHigh | #TechnicalAnalysis | #PriceAction
📌 Disclaimer: This analysis is shared for educational purposes only. It is not a buy/sell recommendation. Please do your own research before making any trading decisions.
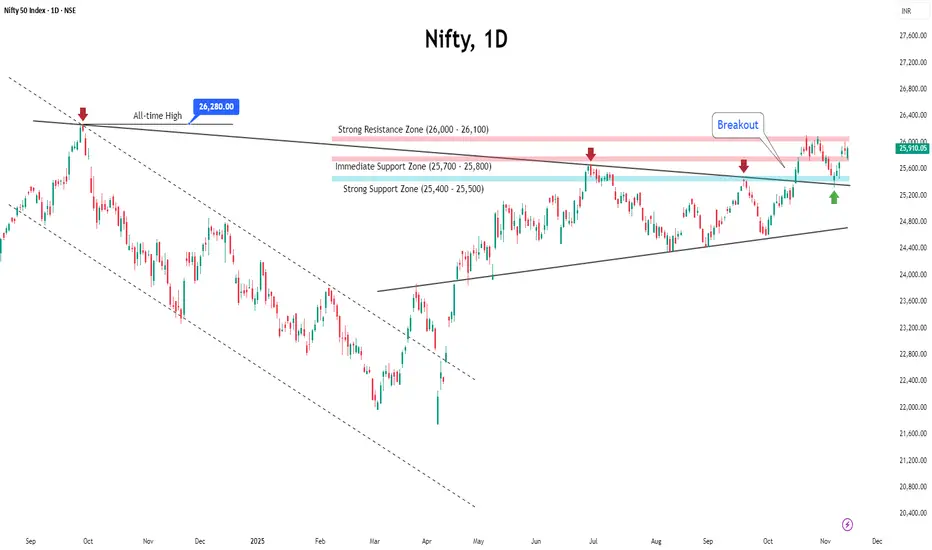
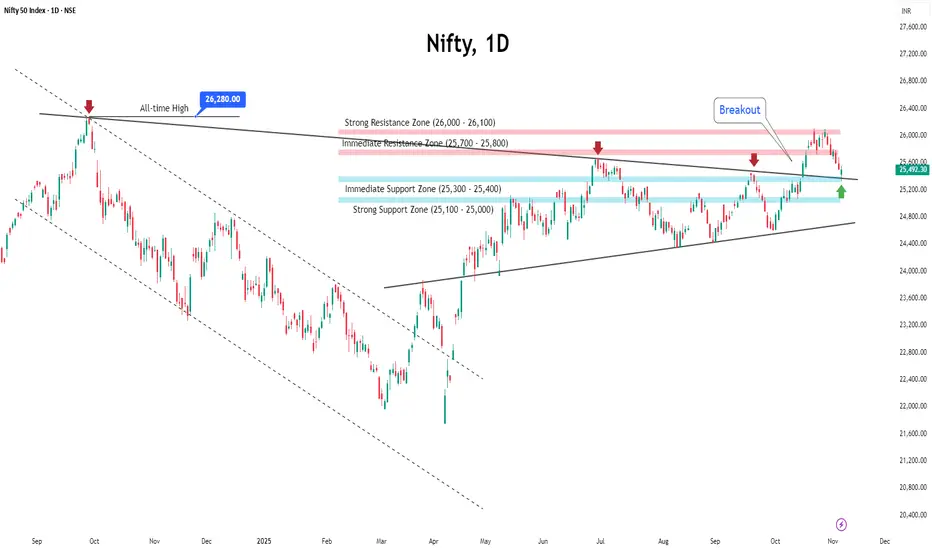
Nifty Slips for 2nd Week: Consolidation Ahead amid Rising VIXIndian markets ended lower for the second straight week, weighed down by persistent foreign fund outflows, mixed corporate earnings, and cautious global cues.
Nifty slipped nearly 0.8% to close at 25,490, while India VIX rose over 3% to 12.55, reflecting a slight uptick in market volatility.
Key Levels to Watch
Nifty is currently retesting the apex of its ascending triangle breakout, around the 25,300–25,400 zone. This area is supported by significant put writing, as reflected in recent open interest data, making it an important near-term support.
Below this, the next strong support lies near 25,000.
On the upside, the 25,700–25,800 zone could act as an immediate resistance due to heavy call writing, while 26,000 remains a major resistance level to watch.
Outlook
Given the current setup, markets are likely to trade within a neutral range in the coming week. Volatility may stay elevated as global uncertainties, FII outflows, and a busy flow of economic and earnings data continue to influence sentiment.
While near-term sentiment remains cautious, strong domestic macro fundamentals and steady corporate performance are expected to provide underlying support to the broader trend.
Traders are advised to stay stock-specific, focusing on banking and financials—particularly PSU banks—which continue to display relative strength.
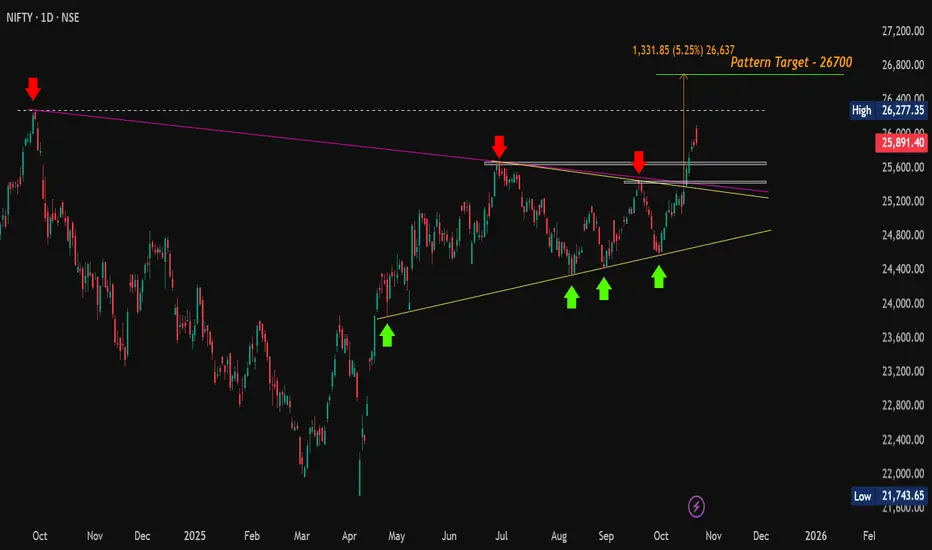
#Nifty | Breakout Confirmed, Now Eyes on Support for Next Move#Nifty Update (Daily):
CMP: 25,891.40
Following our previous update at 25,285, Nifty has decisively broken out above the Symmetrical Triangle pattern and surged to a high of 26,104 today. Price action formed a bearish candle but managed to close positively on the daily chart.
🔄 What to expect next?
A potential retest of breakout levels is likely as profit booking is expected after a strong rally of over 1,500 points from the swing low. Watch the key support zones closely for a possible bounce.
🔽 Support Zones to watch :
25,669 - 25,638
25,449 - 25,424
⚡️ If Nifty holds these levels and reverses, it could set the stage for a renewed upmove aimed at surpassing the all-time high (ATH) at 26,277.
🔼 Resistance Zones to watch :
26,104 (recent high)
26,216 - 26,277 (ATH)
📈 A sustained break above the ATH will confirm continuation toward the symmetrical triangle’s ultimate target near 26,700 .
#Nifty | #Nifty50 | #BreakOutRetest | #SymmetricalTriangle | #ChartPatterns | #SwingTrading | #PriceAction
📌 Disclaimer: This analysis is shared for educational purposes only. It is not a buy/sell recommendation. Please do your own research before making any trading decisions.
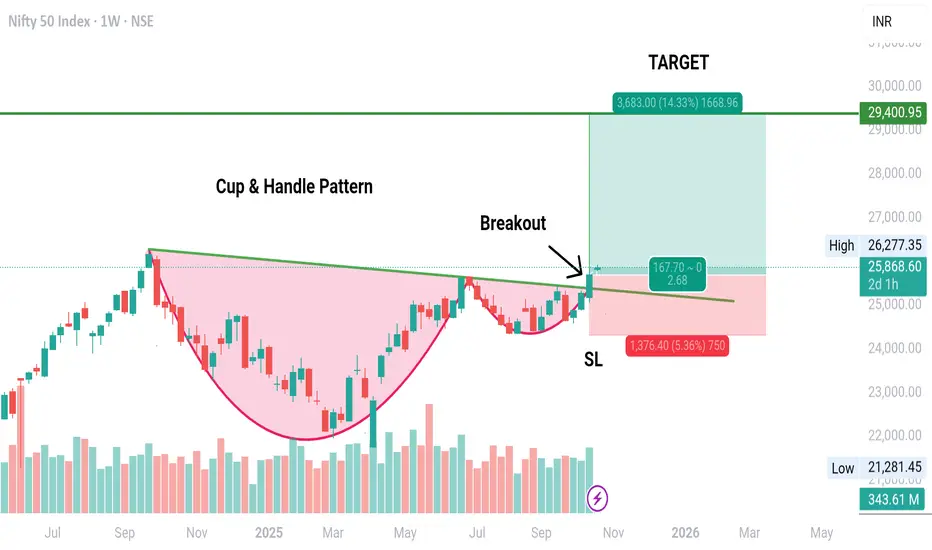
CUP & HANDLE Pattern Breakout in NIFTYA Breakout with good volume has happened in NIFTY 50 INDEX.
The breakout is has happened in weekly Time Frame 😱😱.
A Big target of 29400 is available to be achieved🎯
SL will be below the Handle's Low on sustaining Basis.
A better entry could be the one after retracement💡. As there are high chances of retracement from here as the price is very near to lifetime high.
One should always be cautious with the trade as the time is weekly. And, there can be many factors which can become hurdle like War, Tariff War, US economic bubble burst leading to crash etc etc.
However, entry target and SL are also mentioned in the chart.
Subscribe to my YouTube Channel for more details and more analysis.
Note: This analysis is for Educational Purpose Only. Please invest after consulting a professional financial advisor.
#Nifty Weekly Outlook – Cup & Handle in Focus!CMP: 25,285
Primary Trend: Uptrend (Bullish Bias)
🔽 Support Zones
• 25154 – 25084
• 24858 – 24768
• 24588 (Major swing support)
🔼 Resistance Zones
• Immediate Resistance: 25424 – 25449
• Next Hurdles: 25638 – 25669
• Key Breakout Level: 26179 – 26277.35 (ATH)
Pattern: Cup & Handle ☕️
A classic Cup & Handle pattern is forming on the weekly timeframe , following a strong uptrend, which is a bullish continuation setup.
• 🧭 Neckline breakout (sloping white trendline) is the key trigger.
• 🎯 Target Projection: ~29,500 (~16% upside potential post-breakout)
🔒 Pattern Invalidation Level
• Weekly close below 24,337 negates the pattern.
⏳ Awaiting Breakout Confirmation
• A weekly close above the neckline with solid volume will confirm the breakout .
• Until then, price remains in a healthy consolidation.
✅ Dips into support zones can be used for positioning, with proper risk management.
#Nifty | #Nifty50 | #CupAndHandle | #ChartPatterns | #SwingTrading | #PriceAction
📌 Disclaimer: This analysis is shared for educational purposes only. It is not a buy/sell recommendation. Please do your own research before making any trading decisions.

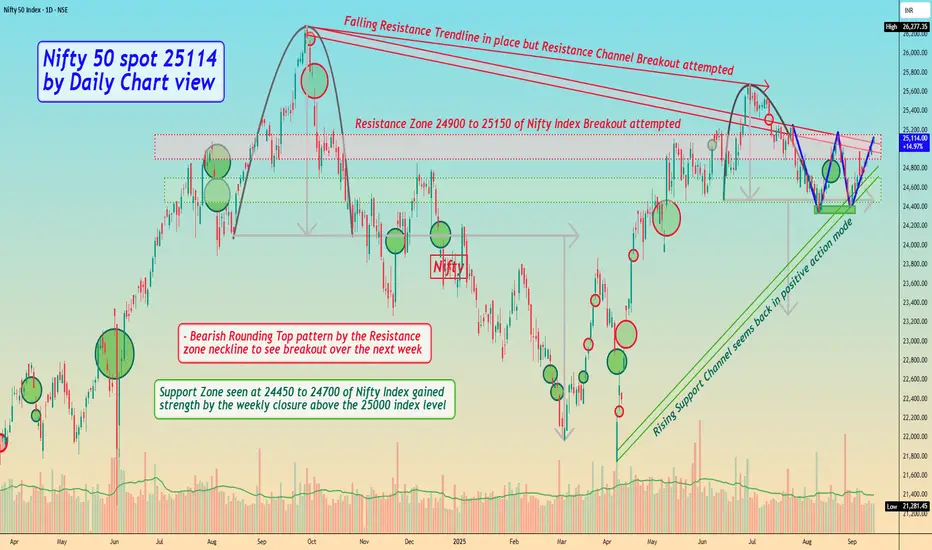
Nifty 50 spot 25114 by Daily Chart view - Weekly UpdateNifty 50 spot 25114 by Daily Chart view - Weekly Update
- Rising Support Channel seems back in positive action mode
- Resistance Zone 24900 to 25150 of Nifty Index Breakout attempted
- Falling Resistance Trendline in place but Resistance Channel Breakout attempted
- Bearish Rounding Top pattern by the Resistance zone neckline to see breakout over the next week
- Bullish "W" with Double Bottom formed below Support Zone, seems instrumental for uptrend momentum
- Support Zone seen at 24450 to 24700 of Nifty Index gained strength by the weekly closure above the 25000 index level
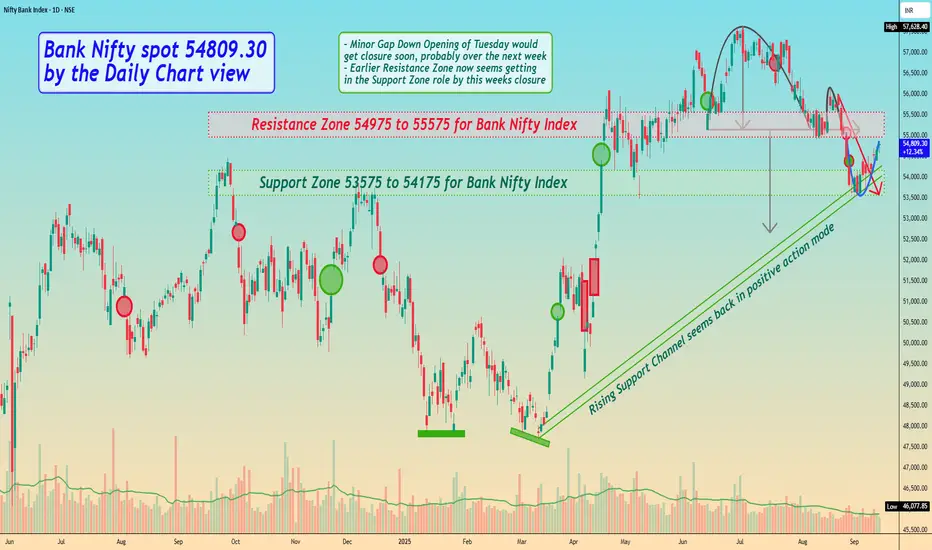
Bank Nifty spot 54809.30 by Daily Chart view - Weekly UpdateBank Nifty spot 54809.30 by Daily Chart view - Weekly Update
- Support Zone 53575 to 54175 for Bank Nifty Index
- Rising Support Channel seems back in positive action mode
- Resistance Zone 54975 to 55575 of Bank Nifty Index may act as a strong barrier to cross
- Minor Gap Down Opening of Tuesday would get closure soon, probably over the next week
- Earlier Resistance Zone now seems like getting in the Support Zone role by this weeks closure
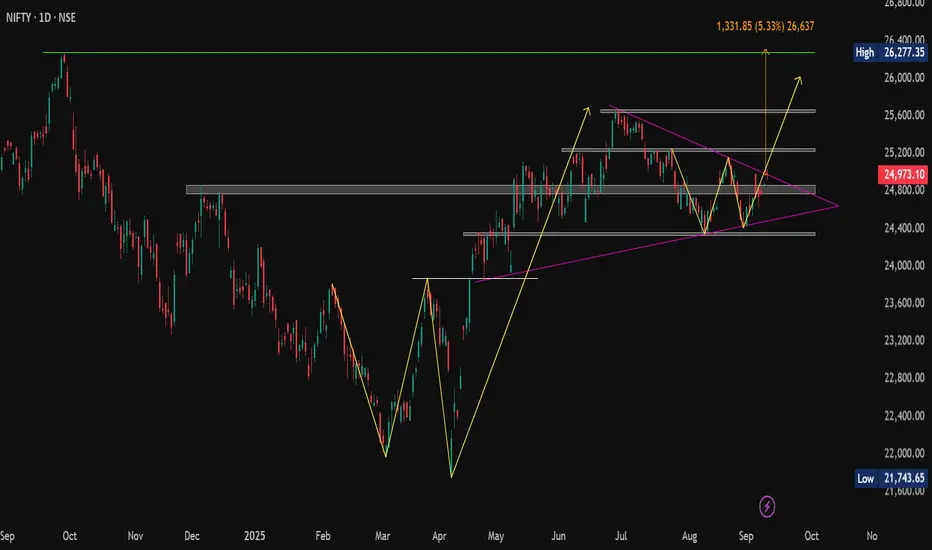
NIFTY: Ascending Triangle Breakout In PlayTechnical Outlook:
CMP: 24,973
📍 Immediate Support Zone: 24,858 – 24,768
📍 Strong Support Zone: 24,363 – 24,329
📍 Immediate Resistance Zone: 25,083 – 25,255 (Clustered zone)
📍 Strong Resistance Zones:
• 25,638 – 25,669
• 26,216 – 26,277 (All-Time High vicinity)
📈 Breakout Alerts:
✅ W-Pattern Breakout above 25,154 (Daily Candle Basis)
🎯 Target: 26,000
✅ Ascending Triangle Breakout above 24,972.50 ( Confirmed on Closing Basis today )
🎯 Target: 26,304 – aligning closely with the ATH of 26,277.35
Conclusion:
With two bullish patterns triggering nearly simultaneously, momentum is building. A sustained move above the immediate resistance cluster could fuel a rally towards uncharted territory.
Watch 25,154 and 25,255 – a clean move above could be the gateway to new all-time highs.
#BreakoutAlert | #TechnicalAnalysis | #ChartPatterns | #PriceAction