INDIAN BANK STOCKNSE:INDIANB Stock is trade above the best support level of 530 rupees,
Buying level is break and close above the 555 rupees in one day candle,
Target is 575 to 585 rupees,
Stoploss is close below the support line (atleast one day candle)
Indianbank

INDIAN BANK - Swing Trade - 21st May #stocksINDIAN BANK (1D TF) - Swing Trade Analysis given on 21st May, 2024
Pattern: ASCENDING TRIANGLE BREAKOUT
- Resistance Breakout - Done ✓
- Volume Buildup at Resistance- Done ✓
- Change of Polarity - In Progress
* Disclaimer

Short Term Trading Opportunity in Indian BankHi,
NSE:INDIANB has given a Bullish Inverted Head & Shoulder Breakout on Daily charts with very good volume.
MACD is also on the bullish side on Daily and Monthly time frames. RSI is also on the bullish side on daily, weekly and monthly time frames.
In the current market scenario, I am expecting that the bullish momentum will continue.
Complete price projection like entry, stop loss and targets mentioned on the charts for educational purpose.
Don't Forget to Follow me to get all the updates.
Please share your feedback or any queries on the study.
Disclaimer: Please consult your financial advisor before making any investment decision.

CHANNEL BREAKOUT IN INDIANB (INDIAN BANK)INDIAN BANK has got a strong channel breakout with heavy Volumes and RSI. Stock is also favourable as per technical analysis, Bollinger Bands, and other tools.

INDIANB Analysis & PredictionThis is the analysis of INDIANB in Weekly Time Frame. Watch carefully. The chart explains itself.
There are some prediction levels. These Levels act as Support and Resistance according to position of price. You have to trade according to level breakout or breakdown.
Always maintain your risk management.
Book your profit according to your “STOMACH”.
Disclaimer:
This is not investment advice. I am not a SEBI Registered Analyst. Anything posted here is my own analysis and views. This is created for educational purposes only. Always consult your Financial Advisor before taking any decision or trade.
Happy trading.
About INDIANB :
Indian Bank engages in the provision of banking products and services. It operates through the following segments: Treasury, Corporate/Wholesale Banking, Retail Banking, and Other Banking Operations. It offers NRI-Foreign Exchange, Applications Supported by Blocked Amount for IPO, wealth management services, supreme current accounts, educational loan, centralized pension processing, interest subsidy for educational loans, and financial inclusion plan. The company was founded by V. Krishnaswamy Iyer on March 5, 1907 and is headquartered in Chennai, India.

Indian Bank Stock Analysis: Spordiac Buy Signal on short term📈 NSE:INDIANB - January 5, 2024, 12:52 PM
Current Trading Price: ₹435.10 🏷️
Opening & Key Levels:
Today's Opening: ₹432.40 (Above 0.618 Fibonacci Level) ✅
Near 50-Day Moving Average: Indicating Bullish Trend 📊
Technical Indicators:
EMA & MA: No crossover yet 🔄
MACD: Histogram at 0.48, MACD at 0.70, Signal at 0.22 (Positive Crossover) 📈
RSI: Currently at mid-range, K at 55.02, D at 37.62 (Viable Range) 🎯
%R: At -29.83 (Supportive of Bullish Trend) ⬆️
Fisher Indicator: Positive crossover, Fisher at 0.80, Trigger at 0.27 (Mid-Range) ✨
Parabolic SAR: Buy signal at ₹391.00 🟢
Target Prices & Stop Loss:
Target 1: ₹443.65 (0.786 Fibonacci Level) 🎯
Target 2: ₹458.00 (Level 1 of February Series) 🎯
Stop Loss: If falls below ₹424.50 (0.5 Fibonacci Level) ⛔️
Overall Outlook: Bullish in the short term, but confirmation needed from other indicators. Volatility noted. Investors are advised to monitor closely.
Disclaimer: This analysis is for informational purposes only and should not be construed as investment advice. Investment decisions should be based on individual research and risk appetite. 🚫
#IndianBank #StockAnalysis #TechnicalAnalysis #Investing #StockMarket #BullishTrend #TradingTargets #RiskManagement

INDIAN BANK Ready for 30% upside in next 4 MonthsINDIAN BANK Ready for 30% upside in next 4 Months
On the Weekly charts it has been moving up & will soon touch its all time high.
LTP - 329
Targets - 435+
Timeframe - 4-5 Months.
In last few Years FII has increased there stake from 0.5% to 4% in the stock whereas Public has decreased stake form 8% to 4%.
Happy Investment.

Trade-28/100-INDIANB-R:R Experiment-Buybuying INDIANBANK in DAILY positional trade
Good structure making HH-HL.

Indian Bank forming Pole and FlagStock after BO, trading in consolidation zone making pole and flag pattern, any BO above 409, will give next targets.

QUICK ANALYSIS ON ICICIBANKDear Indian Traders and Investors, I made a quick analysis for you on ICICIBANK to let you know that you still can buy it since the market is following the strong support level that it couldn't break for the past 3 years, and the price will go for longer.
The comment secion is all yours for further questions!


Indian BankINDIANB:- Rounding pattern is formed and stock is moving in a small range from last 2 months, if it crosses 310 level then we may see upside movement, keep your eye on the stock
Hello traders,
As always, simple and neat charts so everyone can understand and not make it too complicated.
rest details mentioned in the chart.
will be posting more such ideas like this. Until that, like share and follow :)
check my other ideas to get to know about all the successful trades based on price action.
Thanks,
Ajay.
keep learning and keep earning.

INDIANB - Ichimoku Bullish Breakout Stock Name - Indian Bank
Ichimoku Cloud Setup :
1). Today's close is above the Conversion Line
2). Future Kumo is Turning Bullish
3). Chikou span is slanting upwards
All these parameters are showing bullishness at Current Market Price
and more bullishness AFTER crossing 276
#This is not Buy and Sell recommendation to any one. This is for education purpose and a helping hand to learn trading in Market.
# Cloud Trading
# Ichimoku Cloud
# Ichimoku Followers
I hope you all like my analysis.
Please do share your thoughts into comment section.
Please give a like, it motivates me to do analysis.

YR 2022 Idea #164: Long on INDIANBThis is a public swing trade idea and is only for Learning and observational purpose. Please understand your risk and take full responsibility of your actions. I might trail my stoploss after I get an entry but even if my original Stoploss hits, i exit the trade with pre-planned loss (risk). At target, I book usually 75% positions and trail stoploss for rest. Our objective to help anyone who wants to learn technical analysis using charts by demonstrating my real trade entries. You can post your queries in comment section here and we will try to answer them asap.

Indian Bank, a strong PSU with 3x potentialIndian Bank is currently trading at half of its Book Value of 360 and at a P/E of 5.85.
it has recently brokeout after formation of Inverse Head and Shoulder pattern and once achieving its targets it will reach its old resistance that forms the CUP with a depth of over 371 points (2x its existing price) which might lead to price to 750+
This is not a BUY or Sell recommendation and has been posted as an outcome of my observation and practice

ICICI BANK CAN CONTINUE THE MOVE AND ACHIEVE FEW NEW TARGET…..¿I had bought this stock at the price of 780. As per my pri-research for this stock price was 777 but i wait for confirmation and I bought 1000 qty lets see what happen.

INDIAN BANK forming an triangle patternINDIAN BANK (INDIANB) stock is forming a triangle pattern on DTF. Wait for triangle BREAKOUT and go LONG (BUY) OR SHORT (SELL) based on the breakout

Indian Bank : Trend line BreakoutTrend line Breakout in Indian Bank
Good Accumulation in Last 4 days (volume)
Rsi looks Strong

INDIANB - Swing Trade INDIANB
Buy-Above 150
Sl-130
T-185 195 210+
The stock given a given a trendline breakout in daily TF after making a base at 135-140. However if it sustains above 210 then it can test 260 in mid term.

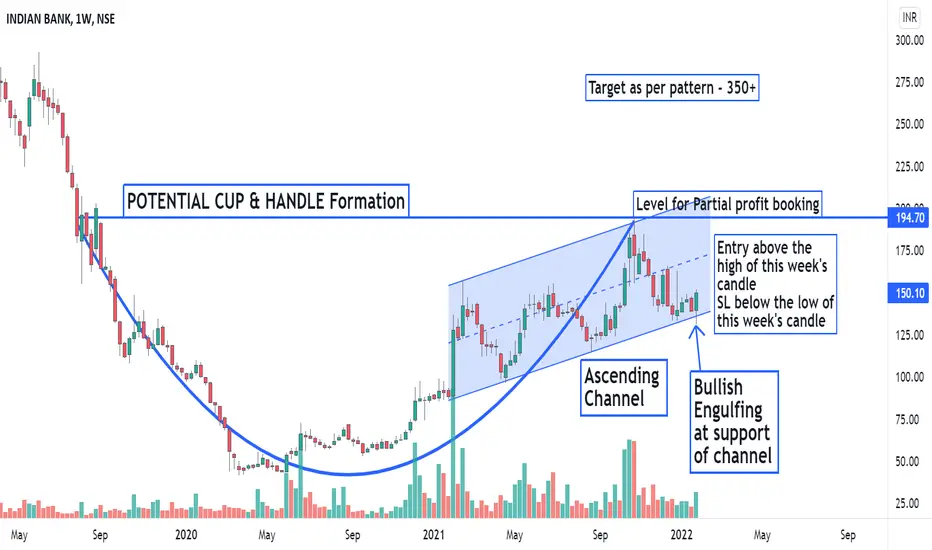
INDIANBANK -Potential Cup & Handle formation + Ascending ChannelThe analysis is done on weekly TF hence price may take few weeks to few months in order to reach the targets.
Trade setup is explained in image itself.
The above analysis is purely for educational purpose. Traders must do their own study & follow risk management before entering into any trade
Checkout my other ideas to understand how one can earn from stock markets with simple trade setups. Feel Free to comment below this or connect with me for any query or suggestion regarding this stock or Price Action Analysis.
INDIAN BANK TARGET UPDATE 7-12-2021Look fresh in range 140-146 for upside 190-220 med term with SL 120..!!

Indian Bank Technical View!INDIANB took Support at previous resistance after falling 10%.
Looks good for target of 192
Please do your own analysis before making any decisions and also let me know if I missed something.
Let's learn together.

Bank Nifty AnalysisHey folks,
Bank Nifty support zone marked
Three confluences in weekly outlook
1. trendline
2. 20 EMA
3. Previous swing high
Thanks and happy trading! NSE:BANKNIFTY
