What is Short Selling? – The Beginner’s GuideShort selling is the practice of selling securities that an investor does not currently own. The investor sells them with the expectation that the price will decline. Later, the investor buys them back at a lower price to earn a profit.
In simple words, short selling means selling a borrowed instrument and buying it back later at a lower price. If the price rises instead of falling, the short seller incurs a loss. This process is also known as shorting.
I am trying to explain the basic concept and its features.
SEBI allows retailers, domestic mutual funds, and institutional investors to short sell. However, banks and insurance companies are not permitted to participate.
Key Features of Short Selling in Indian Market
Short selling allows traders to sell a stock they do not own, with the expectation of buying it back at a lower price. Below are the key features in the Indian market:
• All types of investors can participate in short selling
• Investors can earn a fee by lending shares to short sellers
• It helps provide liquidity to the market
• Assists in correcting overvalued stock prices
• Promoters may misuse it for price manipulation (risk factor)
• Investors must disclose borrowing arrangements before placing the order
📈 Benefits of Short Selling
Short selling provides opportunities for both traders and market efficiency.
1️⃣ Allows traders to profit during falling markets
2️⃣ Investors earn from price declines
3️⃣ Requires comparatively lower capital (especially in derivatives)
4️⃣ Simple execution process in F&O segment
5️⃣ Unlike the cash market, you can sell without owning (via futures). Sometimes futures trade at a premium to spot price
🎯 Why You Should Short Sell
There are mainly two core reasons:
1️⃣ Trading & Profit Opportunities
Short selling enables traders to profit in bearish market conditions.
2️⃣ Hedging
Used to protect long-term investments.
Investors offset the risk of long positions by taking short positions in related instruments.
🔄 Types of Short Selling (India)
There are two primary types:
• Covered Short Selling
Shares are borrowed before selling. Delivery can be arranged properly.
• Naked Short Selling
Shares are sold without arranging borrow in advance.
This is restricted/not preferred due to regulatory risks and lack of documentary proof.
👥 Types of Short Sellers
Certain categories of market participants prefer short selling:
• Hedgers – Use short positions to reduce risk on long holdings
• Speculators – Trade purely for directional profit
• Day Traders – Actively short based on intraday setups
Major short activity is usually done by hedgers and speculators.
⚠️ Risks of Short Selling
Every financial instrument carries risk. Short selling has unique risks:
• Unlimited loss potential if price rises sharply
• Short squeeze can push prices higher instead of lower
• Going against the trend can be dangerous
• Timing is critical – short sellers must act quickly
• Unlike long investors, waiting indefinitely is not an option
🏁 Conclusion
Short selling is not an “easy money” strategy.
It is closer to speculation than traditional investing.
While profit potential exists in falling markets, losses can also be significant.
Success requires:
✔ Proper risk management
✔ Clear entry and exit plans
✔ Understanding of market structure
✔ Discipline
Trade wisely. Risk smartly.
Indianmarket

Dalal Street Shaken Ahead of Monthly Expiry — What’s Next?Indian equity markets witnessed a sharp corrective move last week, with the Nifty sliding nearly 2.5% to close around 25,050. The sell-off came at a sensitive juncture—just ahead of monthly expiry.
Adding to the nervousness, India VIX jumped sharply by 24.8% to 14.19, signaling a sudden rise in uncertainty and trader caution.
A combination of geopolitical tensions, pre-Union Budget 2026 jitters, and mixed Q3 earnings weighed heavily on market sentiment, prompting profit booking across sectors.
◉ Technical Setup
Nifty is currently testing the lower end of its rising channel, a technically important area. A mild relief bounce is possible from these levels.
However, a decisive breakdown below the channel support could trigger another leg of sharp selling in the coming sessions, making this zone extremely crucial for near-term direction.
◉ Key Levels to Watch
Support Zones
25,000 – 24,900: Immediate psychological and technical support
24,500 – 24,400: Strong base with heavy put writer concentration
Resistance Zones
25,400 – 25,500: Immediate hurdle with significant call writing
26,000 – 26,100: Major supply zone and strong resistance
◉ Near-Term View
Volatility is likely to remain elevated in the coming week. While the broader structure has weakened, a short-term bounce from the 25,000 zone cannot be ruled out, given oversold conditions and strong psychological support.
That said, any recovery should be viewed with caution and may face stiff resistance at higher levels.
◉ Suggested Strategy
A cautious, stock-specific strategy is preferred for the week ahead. Short-term oversold signals may support a bounce, but the broader trend has weakened. Avoid aggressive longs and focus on protecting gains.

Weekly analysis of Nifty...Here is weekly analysis of Nifty...
Please do follow me if you liked the idea💡...
Disclaimer ⚠️: This analysis is for educational purposes only and does not constitute investment advice. Please do your own research (DYOR) and check with your financial advisor before making any trading decisions ⚠️⚠️.

EOD analysis of Nifty......Here is end of the day analysis of Nifty....
Disclaimer: This analysis is for educational purposes only and does not constitute investment advice. Please do your own research (DYOR) and check with your financial advisor before making any trading decisions.

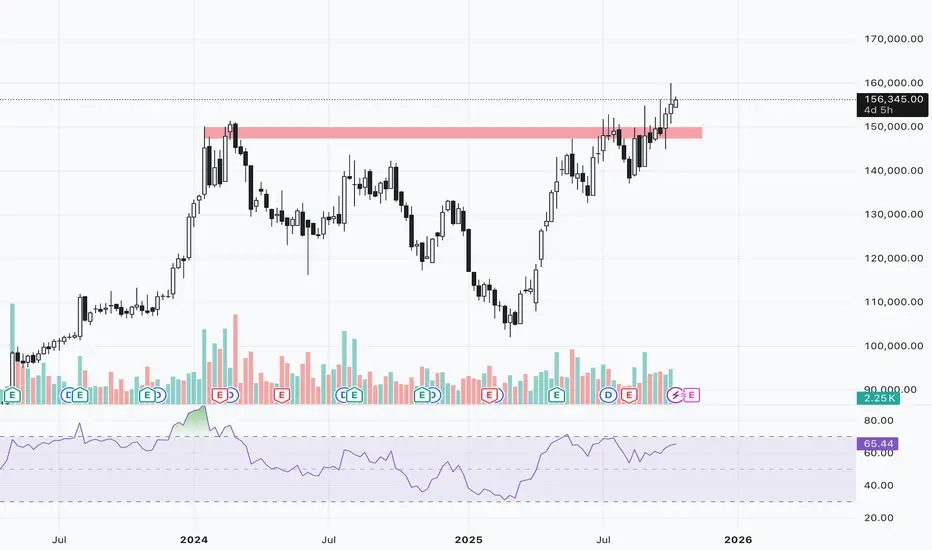
MRF Breakout Swing CandidateChart Analysis :
The stock has broken out above the all time high resistance and major psychological level of 150000 and is sustaining above the zone. A long position can be considered around 156500 zone.
Key Levels :
Entry : 156350-156500
Targets : 160000/163170
Stop-Loss : 152500 below day tf close
Disclaimer:
I am not SEBI registered. This analysis is for educational purposes only and not investment advice. Please do your own research before trading or investing.
Bullish Iron Condor on Nifty (30th September 2025 expiry)Hello Traders!
Just like we shared the August Iron Condor setup, here comes the fresh plan for September expiry.
Nifty is trading around 24,840 and we are witnessing a defined range between 23,750 – 25,500.
Such ranges are perfect for premium eating strategies like the Iron Condor, where time decay works in our favour as long as the index stays inside the zone.
So here’s the September plan:
Position Details
Sell 2 lots 24,700 PE @ 140.30
Buy 2 lots 24,400 PE @ 71.60
Sell 2 lots 25,500 CE @ 53.95
Buy 2 lots 25,750 CE @ 22.95
We expect Nifty to consolidate between 23,750 – 25,500 as per our technical chart analysis .
200-DEMA is acting as dynamic support
Strong resistance capped near 25,500 – 26,270
Until a breakout happens on either side, premium sellers can stay in control
This Iron Condor gives us a balanced risk-reward setup and benefits from time decay while keeping risk well-defined.
Why I Like This Setup:
Limited loss , defined by hedge positions
High probability of success as long as Nifty remains in the range
Best suited for traders focusing on consistent income from option writing
Rahul’s Tip 👉 Discipline in trade management is always more important than the setup itself.
For income-based option strategies, always check for:
Key events and news (policy, RBI, FED, budgets, etc.)
Breakout signals beyond short strikes
Quick exit or adjustment if market moves out of range
Disclaimer This post is for educational purposes only . Please manage your risk and position sizing wisely.
Avoid large quantities at once – it’s always better to scale in gradually once the range confirms.

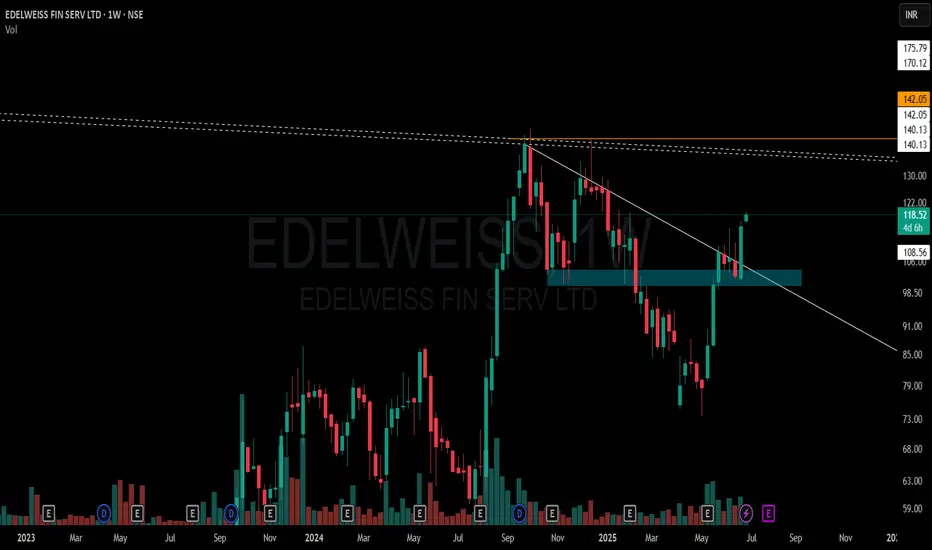
EDELWEISS FIN SERV LTD – Weekly Structure A few key observations on this weekly chart without any forecast bias:
🔹 White Solid Trendline – Marks the active CT (counter-trend) level which has now been decisively taken out.
🔹 Blue Zone – A previously tested supply and demand area has been regained and price is now sustaining above it.
🔹 White Dotted Lines – Multiple short-term weekly hindrances lie just above, acting as micro-resistances.
🔹 Orange Line – Reflects multi-timeframe level confluence and a known volume cluster region to watch ahead.
🔹 Volume has seen a healthy pickup during this breakout, suggesting participation.
📌 Not a recommendation. Just sharing chart structure and price behavior.
Can NIFTY reach 26000? It's a question that requires careful thought, hitting that sweet spot between straightforward and complex.
The Indian equity market has been a story of resilience and growth, with the NIFTY 50 consistently scaling new peaks. The current buzz among investors and analysts is whether this upward trajectory can carry the benchmark index to the 26,000 mark.
While it's impossible to predict market movements with absolute certainty, a confluence of favorable factors suggests that NIFTY 26,000 is indeed a plausible, if not probable, milestone in the near to medium term.
Driving Forces Behind the Potential Rally:
S trong Economic Fundamentals : India continues to be a global bright spot, with various reports, including those from the OECD and World Bank, projecting it as the fastest-growing major economy in 2025 and 2026, with GDP growth rates estimated to be around 6.3-6.4%. This strong macroeconomic backdrop provides a fertile ground for corporate earnings growth.
Robust Corporate Earnings: Sustained earnings growth is the bedrock of any market rally. Analysts anticipate healthy earnings performance across various sectors, which will provide the fundamental validation for higher index levels. Sectors like financials, insurance, and telecom are showing resilience and are expected to contribute significantly.
Supportive Monetary Policy: The Reserve Bank of India (RBI) is expected to maintain an accommodative stance, with potential for further interest rate cuts. Lower borrowing costs can spur economic activity, boost consumption, and enhance corporate profitability, all of which are positive for the stock market.
Increasing Domestic Participation: The growing awareness and participation of Indian retail investors through Systematic Investment Plans (SIPs) have acted as a strong counter-balance to foreign institutional investor (FII) outflows. This sustained domestic liquidity provides a solid floor to the market and fuels its upward movement.
Government Initiatives and Capital Expenditure: Government focus on infrastructure development and structural reforms are expected to continue driving economic growth and creating opportunities for various industries, further boosting corporate performance.
Despite the optimistic outlook, the path to 26,000 may not be without its bumps. Global trade tensions, commodity price volatility, and any unexpected shifts in monetary policy globally could introduce short-term corrections. Furthermore, valuations, while considered reasonable by some, might still be elevated in certain segments, necessitating selective stock-picking.
In Conclusion:
The journey to NIFTY 26,000 appears to be driven by a powerful combination of India's resilient economic growth, improving corporate earnings, supportive domestic policies, and increasing investor confidence. While market volatility is an inherent part of investing, the fundamental strengths of the Indian economy make NIFTY 26,000 a very realistic and exciting prospect for investors looking at the Indian market horizon.

Nifty Bank Intraday levels(For Education Purpose)20.05.2025📉 Bearish (Sell) Setup:
Sell Below: ₹55,480 (confirmed breakdown)
Targets:
🎯 Target 1: ₹55,400
🎯 Target 2: ₹55,300
🎯 Target 3: ₹55,180 (if heavy selling continues)
Stop Loss: ₹55,580 (or ₹55,600 for conservative SL)
///📈 Bullish (Buy) Setup – Only if Reversal Happens:
Buy Above: ₹55,600 (strong reversal with volume & green candles)
Targets:
🎯 Target 1: ₹55,700
🎯 Target 2: ₹55,800
🎯 Target 3: ₹55,900
Stop Loss: ₹55,480

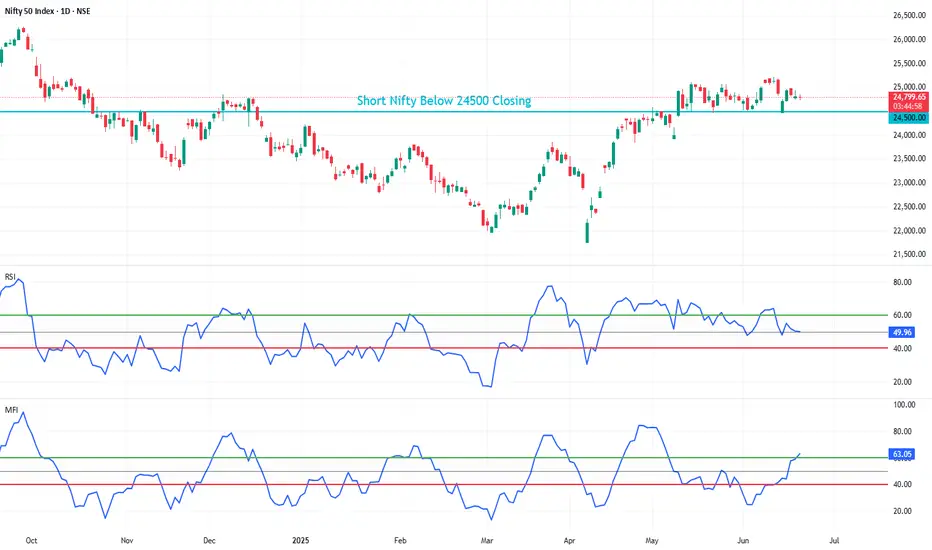
NIFTY (OVERALL MARKET) SETUP FOR SHORTING Please don't look for longs if nifty breaks below 24500, if it is above 24500 then you can see signs of recovery and re-asses your trades but untill then please wait for nifty to fall below 24500₹ levels to short
If nifty breaks then overall markets fall, for better optimization look for stocks now which you think are overvalued now
and then when nifty breaks 24500 then sell or buy PE (any ways you want to) that overvalued stock because that will usually have a larger fall if markets fall.
Please be prepared apart from your daily trading !!
May you all be happy, May you all be profitable :)
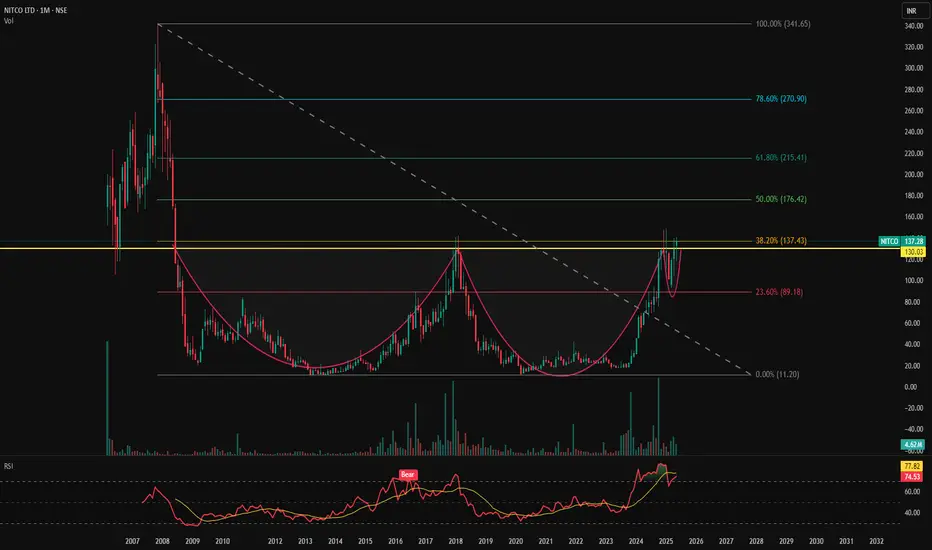
NITCO LTD | Monthly Chart Analysis📊 NITCO LTD (NSE:NITCO) | Monthly Chart Analysis
📅 Date: June 1, 2025
📈 CMP: ₹137.28 (+6.02%)
📌 Ticker: NSE:NITCO
📉 Chart Pattern Insight
🏆 Massive Cup and Handle Breakout Formation (18-Year Base)
NITCO is breaking out of a textbook multi-decade Cup and Handle pattern, forming over 17+ years. This type of structural breakout on a monthly timeframe is rare and typically leads to multi-fold rallies.
💥 The breakout zone lies around ₹130.03 – previously a strong resistance from 2007, 2017, and now being tested again with a strong monthly close above it.
📊 Indicator: RSI + Moving Average Cross (Icon shown)
🔎 RSI (Relative Strength Index): Currently at 74.53, signaling strong bullish momentum
📈 RSI has also crossed above its moving average, and the "Bear" label in the past has flipped, suggesting a shift in long-term trend direction.
🔑 Key Levels
🔸 Breakout Zone: ₹130.03 (now acting as support)
🎯 Target Zones (based on Fibonacci & historical zones):
₹180
₹250
₹320+
🛡️ Stop Loss (Monthly Close Below): ₹120
💡 Trading Strategy
Entry: On successful retest and hold above ₹130
SL: ₹120 (monthly candle close basis)
Target: Positional hold for ₹180–₹320+
Time Frame: Long-term multi-month to multi-year potential
⚠️ Disclaimer
This is for educational purposes only. Please do your own research or consult a registered advisor before taking positions.
Explosive Price Action in Premier Explosives – The Name Says It 🧠 Key Technical Insights:
✅ Main Counter-Trendline (CT) Breakout:
A clean breakout above the white CT line with a strong, high-volume bullish candle. This confirms a reversal of the prior corrective structure.
✅ Hidden Resistance Cleared:
The breakout also pierced a WTF hidden line (dotted white), further validating momentum.
✅ SD Conversion Zone Flip:
The green zone highlights a supply-to-demand flip. Price has respected this zone multiple times and now turned it into strong demand support — a textbook S→D conversion.
✅ Candle Structure:
The breakout candle not only has volume and size, but also follows a healthy higher low structure — signifying smart accumulation.

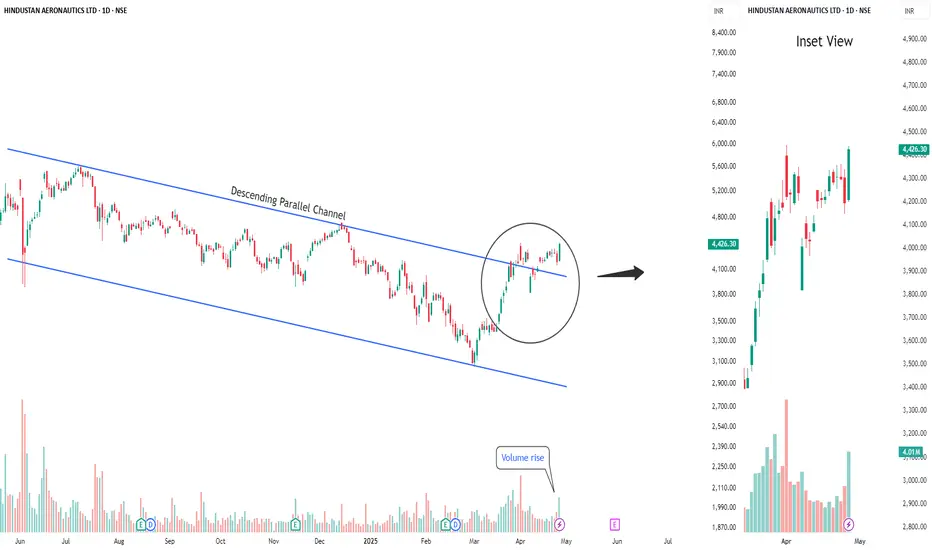
Buy Hindustan Aeronautics Limited Short Term Trading Advice by Goodluck Capital
Buy Hindustan Aeronautics Limited
Buy Range- 4250 - 4400
Target- 4600 - 4700
StopLoss- below 4100
Upside Potential- 6% -9%
Approx trade duration 14 - 15 days
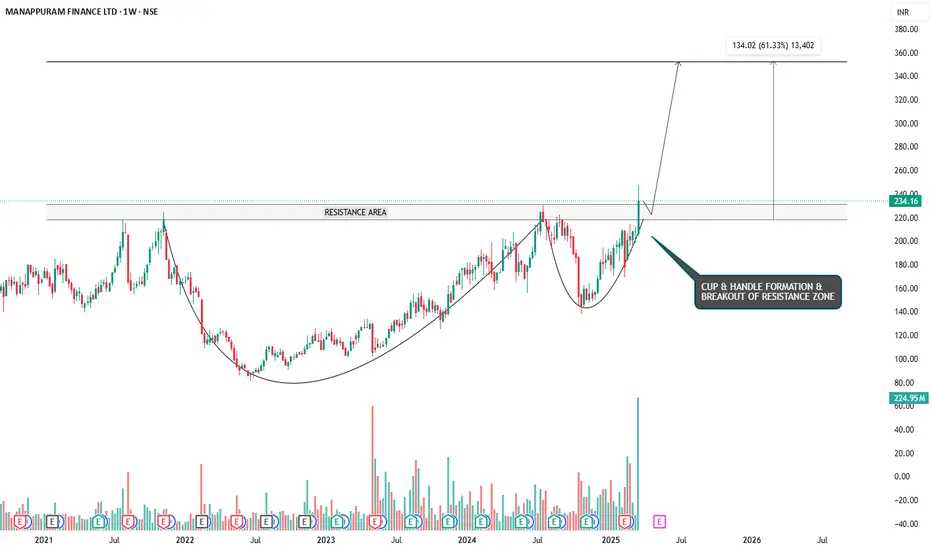
RIDING THE WAVE - CUP & HANDLE BREAKOUT IN MANAPPURAM FINANCESymbol - MANAPPURAM
CMP - 234.16
Manappuram Finance is a Non-Banking Finance Company (NBFC), which provides a wide range of fund based and fee based services including gold loans, money exchange facilities, etc. The Company is a Systemically Important Non-Deposit taking NBFC.
Manappuram Finance Ltd. has recently demonstrated a significant bullish breakout, having formed a classic cup and handle pattern on a larger time frame and breaking out with strong volume. The cup and handle pattern is a well-regarded bullish breakout formation, and when it occurs on weekly or larger time frames, it tends to be highly reliable, indicating a robust upward momentum.
Currently, the stock price may retest the breakout zone, which coincides with the previous resistance area; now turned support - around the 230 to 217 range. This retest is a natural price action behavior and offers an attractive entry point for long positions before the stock continues its upward trajectory.
The target for this breakout, based on technical projections, is around 350, representing a 60% upside from the current market price. Given the strength of the breakout and the established pattern, this target appears achievable over the medium term.
For risk management, a stop loss can be placed around the 197 level, providing a reasonable cushion in case of a price reversal.
From a broader perspective, the formation of a cup and handle pattern coupled with a successful breakout on higher time frames adds a significant bullish bias to the stock. Investors looking for a favorable risk-to-reward setup may find this an opportune time to initiate or add to their positions in Manappuram Finance.
Disclaimer: The information provided here should not be construed as a buy or sell recommendation. It reflects my personal analysis and my trading position. Please consider this trading idea for educational purposes only. Thank you!
HINDUSTAN FOODS Swing Trade (Long)Strong buyers entered again trapping the sellers on monthly time-frame and making a liquidity pool.
On daily time-frame price is in up-trend and is going up by sweeping lows.
If Nifty holds current levels of 23000, (ie. if Nifty is not bearish) then there are high chances of
HINDUSTAN FOODS reaching the target levels.
1:5 Risk to Reward
Follow me for more such simple trade setups based on Trend and Liquidity.
Happy Trading!

Bharti Airtel Swing TradeBharti Airtel has grabbed monthly liquidity and is ready to make ATH if overall market holds current level ie Nifty holds 22000.

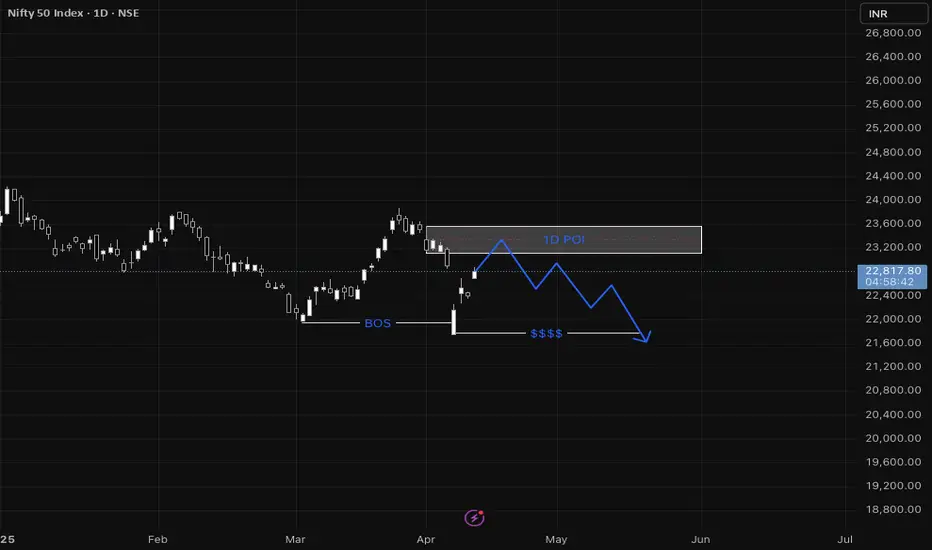
NIFTYNifty has broken structure on the daily timeframe. I’m now waiting for it to collect liquidity and retest the daily point of interest. Looking for confirmation on the one-hour timeframe is a strategic approach to refine the entry.
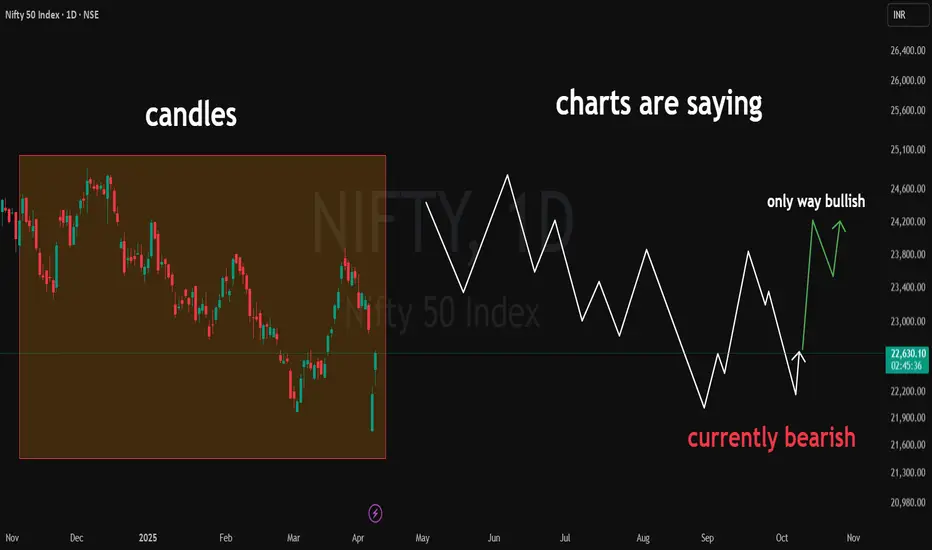
NIFTY 50 – Top-Down Analysis Amidst Tariff TurbulenceWith global markets shaken by Trump’s recent tariff rhetoric, it's time we zoom out and analyze what Nifty 50 is actually saying — from a multi-timeframe lens. Price tells a story, and here's how it's unfolding across the Monthly, Weekly, and Daily charts:
🟩 Monthly Chart (1M) – The Bigger Picture
The macro trend is nearing a critical MTF decision point.
🔁 This is the make-or-break zone for the larger structure.
🟥 Weekly Chart (1W) – Bearish Momentum Still in Play
Structure is currently bearish, with lower highs and lower lows.
🧠 Key Thought: Don’t assume trend change without structure breaking clearly.
🟧 Daily Chart (1D) – Battle Zone
Price action is noisy but insightful.
We have a potential bullish scenario unfolding — but it’s fragile
Only bullish structure is if price defends recent lows and breaks above resistance in a clean impulse-retrace-impulse fashion.
Despite external triggers like Trump’s tariff announcements, the technical structure across timeframes is telling us one thing:
⚠️ “No bias until structure confirms.”
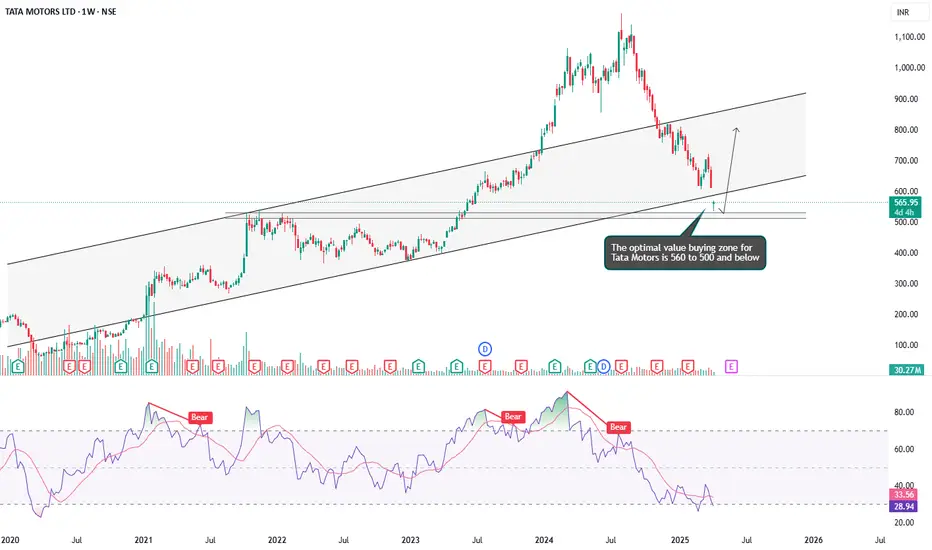
IS TATA MOTORS READY TO REV UP? A SOLID PICK FOR INVESTORSSymbol - TATAMOTORS
CMP - 539
TATA Motors, a leading global automobile manufacturer with brands like Jaguar and Land Rover, has been on a downtrend in recent months. However, it is now approaching an important demand zone, making it an attractive opportunity for medium to long-term investors. The stock is currently trading at a good valuation, offering significant value at these levels.
Despite the recent decline, TATA Motors boasts solid fundamentals, with a diversified business model in both passenger and commercial vehicles. The company’s growing focus on electric vehicles (EVs) positions it well for long-term growth. As the global demand for EVs increases, TATA Motors is likely to benefit, making the stock an appealing pick for investors.
The downside risk appears limited, and a recovery or consolidation at these levels is highly likely. This creates a strong entry point for investors seeking long-term value. Overall, TATA Motors presents a solid investment opportunity given its strong market position and growth potential in the evolving automotive industry.
Disclaimer - Do not consider this as a buy/sell recommendation. I'm sharing my analysis & my trading position. You can track it for educational purposes. Thanks!
BANKNIFTYBank Nifty has taken support and shown a change of character on the daily timeframe. I’m now waiting for it to collect liquidity and retest the daily point of interest. Seeking confirmation on the one-hour timeframe would also be a prudent approach.

GOLD SURGE CONTINUES – FEAR, WAR & END-OF-MONTH VOLATILITYGold opened this week with a strong upside gap, once again reminding us of how unpredictable Mondays can be following highly volatile weekends.
As always, when the market gaps significantly after the weekend, it's best to wait for price to absorb the remaining volume before locking into new setups.
As mentioned in previous outlooks, the current BUY pressure is still high, driven by a global wave of FOMO and fear, caused by:
Rising geopolitical tensions,
Global economic instability,
And even natural disasters now hitting parts of Asia.
Asian stock markets dropped sharply this morning after weekend developments escalated — with the Russia–Ukraine war showing no signs of de-escalation. In fact, new reports suggest a broader regional impact, further boosting risk-off sentiment.
💡 Safe Haven Flows Are Back in Full Force
Right now, gold is the #1 asset investors are paying attention to.
It's being treated as the ultimate flight-to-safety amid global panic and uncertainty.
And with this momentum, new ATHs may still be ahead.
📅 End-of-Month Candle Close – Expect Whipsaws
Today also marks the final trading day of the month, meaning we could see aggressive stop hunts and liquidity sweeps as large players look to close their monthly books.
➡️ Be extra cautious today — sharp moves up or down may occur due to end-of-month positioning.
Whether BUY or SELL, it’s best to trade tight, scalp smart, and respect your SL/TP.
Key Levels for 01/04:
🔺 Resistance: 3116 – 3132
🔻 Support: 3092 – 3085 – 3076 – 3066
🎯 Trade Plan:
SELL ZONE: 3130 – 3132
SL: 3136
TP: 3125 – 3120 – 3115 – 3110 – 3105 – 3100
BUY ZONE: 3066 – 3064
SL: 3060
TP: 3070 – 3075 – 3080 – 3085 – 3090 – 3095 – 3100
Stay sharp and trade with discipline.
End-of-month volatility is not for the weak hands.
— AD | Money Market Flow

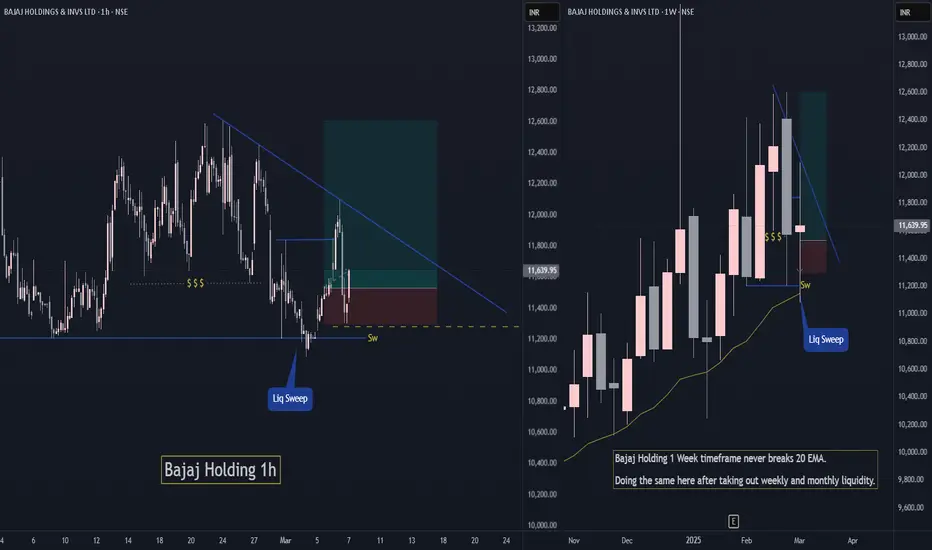
Bajaj Holding Short Term Swing TradeBajaj holding has grabbed monthly and weekly liquidity while maintaining is uptrend.
If Nifty holds current levels ie. above 22400 then Bajaj Holding has high chances to move up and continue its trend.
Do like or follow for more Trading ideas like these. You can comment your views on this analysis.
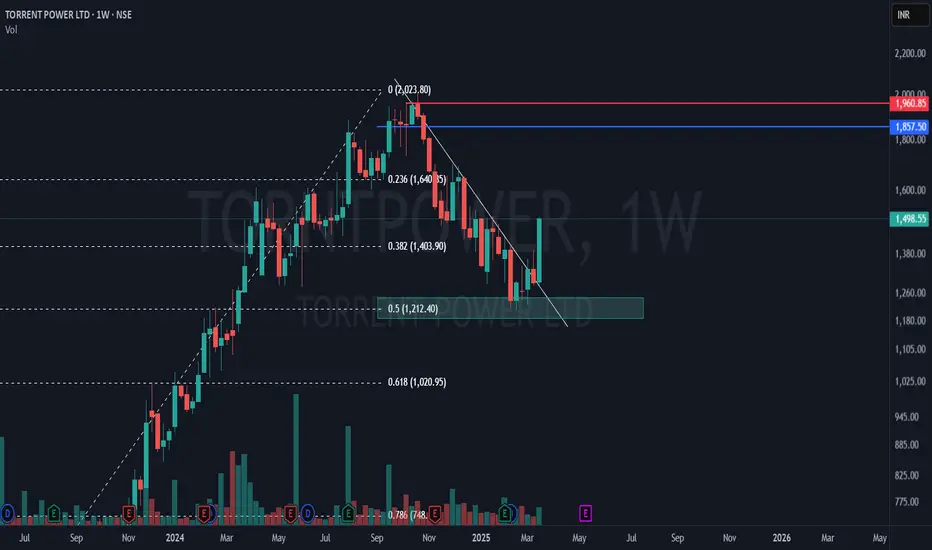
Torrent Power – 50% Fibonacci Retest & Breakout Play!📊 Technical Breakdown:
🔹 50% Fibonacci Retracement at ₹1,212 – a crucial support where buyers stepped in!
🔹 Falling trendline breakout with a massive +16.06% green candle – trend reversal confirmation?
🔹 Volume surge suggests strong buying interest but relatively still lower than as it used to be in this stock year ago
🔹 Blue and Red lines are nearest supply zone created by a weekly and monthly time frame