Advance Breakout Entry - NRAIL📊 NR AGARWAL INDUSTRIES (NRAIL) - Technical Setup
Current Price: ₹448.00 (+5.58%)
📈 BULLISH OUTLOOK
✅ Stock consolidating after higher high
✅ RSI showing hidden divergence (bullish continuation)
✅ Previous resistance at ₹548 - breakout will confirm next leg up
🎯 TARGETS:
• Target 1: ₹548 (Resistance breakout)
• Target 2: ₹641 (Fib 1.272)
• Target 3: ₹692 (Fib 1.414)
• Grand Swing: ₹760 (Fib 1.618)
🛡️ STOP LOSS: ₹376 (below 0.5 Fib support)
📊 KEY LEVELS:
Support: ₹417 (0.618 Fib), ₹377 (0.5 Fib)
Resistance: ₹548
Risk-Reward: 2.7:1 (to Target 2)
⚠️ DISCLAIMER: This is for educational purposes only, not financial advice. Trading involves risk. Do your own research and consult a financial advisor before investing.
#NRAIL #StockAnalysis #TechnicalAnalysis #NSE
Indianstock

DIXON Technologies - Swing Trade Analysis
#Dixon Technologies (India) Ltd. - Technical Analysis Report
Current Price:15,697.00
Timeframe: Weekly Chart Analysis
Market Structure Overview
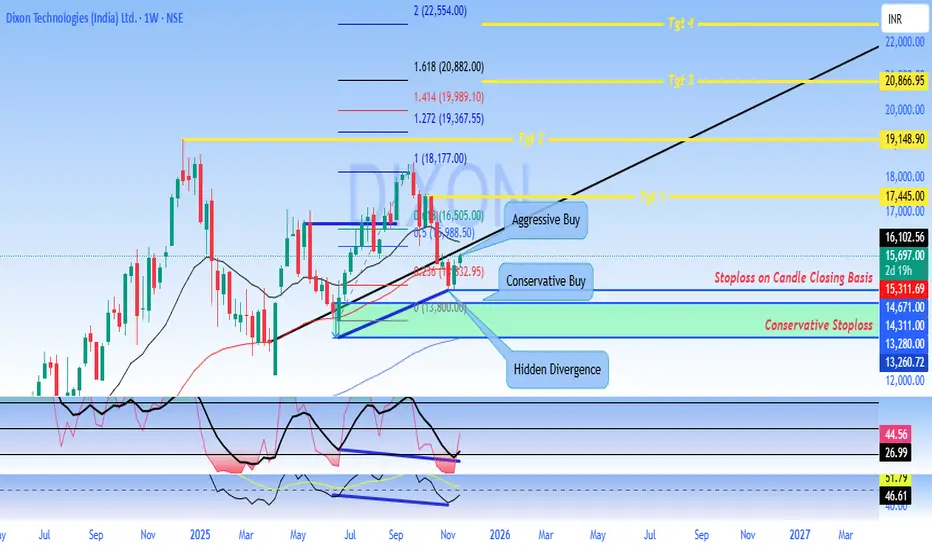
Dixon Technologies is currently trading at 15,697, showing signs of potential #bullish #momentum after a period of #consolidation. The #stock has been forming a significant base pattern following its decline from #all-time highs near 18,177.
#Key Technical Levels
#Support Zones
- Primary Support: 13,800 - 14,311 (Conservative Stoploss zone)
- Secondary Support: 13,260 - 13,280
- Critical Support: 12,000 (major psychological level)
#Resistance Zones
- Immediate Resistance: 16,102 - 16,505
- Key Resistance 1: 17,445 (Target 1)
- Key Resistance 2: 19,148 (Target 2)
- Major Resistance: 20,866 - 22,000 (Target 3 & 4 zone)
#Chart Pattern Analysis
The weekly chart reveals a **potential bullish reversal pattern** with the following characteristics:
1. Hidden Divergence: The chart shows hidden bullish divergence on momentum indicators, suggesting underlying strength despite recent price consolidation
2. Consolidation Box: A clear accumulation zone has formed between 13,800 and 16,500
3. Trend Channel: A rising trend channel indicates the potential for continued upward movement toward the 20,000+ zone
#Trading Strategies
#Aggressive Buy Setup
- Entry Zone: 16,505 - 16,102 (on breakout confirmation)
- Target Sequence: 17,445 → 19,148 → 20,866
- Stop Loss: Below 15,311 on candle closing basis
- Risk-Reward: Favorable 1:3+ ratio
#Conservative Buy Setup
- Entry Zone: 15,697 - 15,311 (current levels)
- Target Sequence: 17,445 → 19,148
- Stop Loss: Below 14,311 on candle closing basis (Conservative Stoploss)
- Risk-Reward: Approximately 1:2.5 ratio
#Momentum Indicators
The lower panel indicators suggest:
- Recovery from oversold conditions
- Building positive momentum
- Potential for sustained upward movement if key resistance levels are breached
#Fibonacci Levels
Key Fibonacci retracement/extension levels marked on the chart:
- 1.618 Extension: 20,882
- 1.414 Extension: 19,989
- 1.272 Extension: 19,367
- 1.000 Level: 18,177
#Outlook
Bullish Scenario: A sustained move above 16,505 with strong volume could trigger momentum toward 17,445 initially, with extended targets at 19,148 and potentially 20,866+. The stock appears to be in an accumulation phase with potential for a significant upside breakout.
Bearish Scenario: Failure to hold above 14,311 on a closing basis would invalidate the bullish setup and could lead to a retest of 13,260-13,280 support zone.
#Risk Management.
- Always use stop-loss orders on a candle closing basis - Position sizing should not exceed 2-3% of total portfolio value - Avoid overleveraging in options or futures - Monitor volume confirmation on breakout levels
DISCLAIMER
This analysis is for educational and informational purposes only and should NOT be considered as financial advice or a recommendation to buy or sell securities.
- Past performance is not indicative of future results - Trading and investing in stocks involves substantial risk of loss - All investment decisions should be made based on your own research, risk tolerance, and financial situation - Please consult with a SEBI-registered financial advisor before making any investment decisions - The author/analyst is not responsible for any profits or losses incurred based on this analysis - Technical analysis has limitations and should be combined with fundamental analysis - Market conditions can change rapidly, and all levels mentioned are subject to change
**Trade at your own risk. Always do your own due diligence.**
*Analysis created using TradingView charts | Not SEBI Registered Investment Advice*
L&T Multiyear BreakoutLarsen & Toubro Limited - Multi-Timeframe Breakout Analysis
Current Price:4,004.40
CRITICAL SETUP ALERT
L&T is at a pivotal moment with breakouts confirmed on weekly and monthly timeframes. The stock is now in a crucial period that will determine the validity of this range breakout.
KEY TECHNICAL OBSERVATIONS
Weekly Chart Analysis:
- Nearly 1.9 Years of Consolidation (2023-2025) between 3,200-3,800
- Clean breakout above 3,800 resistance with strong momentum
- All major EMAs (20/50/100/200) aligned bullishly
- Long accumulation phase suggests institutional participation
Monthly Chart Analysis :
- Breakout confirmed above 4,250 resistance box
- Strong bullish candle with healthy volume expansion
- EMAs: 20 | 50 |100 I 200 - all rising
Current Status:
✅ Breakout happened on weekly/monthly charts
⏳ Awaiting confirmation via follow-up candle close
📈 Price holding above breakout zone shows strength
🎯 PRICE TARGETS
Based on the range breakout and Fibonacci projections:
- Target 1: 4,451.25 (Immediate resistance)
- Target 2: 4,809.60 (Major psychological level)
- Target 3: 5,424.35 (Extended target - 35% upside)
- Target 4: 5,750+ (Bullish scenario)
📌 CRITICAL LEVELS
Support Zones:
- S1: 3,740 (Breakout retest level)
- S2: 3,611 (20 EMA on weekly)
- S3: 3,419 (Consolidation top - breakdown level)
WHAT MAKES THIS SETUP SPECIAL?
1. Time Factor: 1.9 years of consolidation = strong base building
2. Multi-Timeframe Alignment: Breakout on both weekly AND monthly charts
3. Volume Confirmation: Significant expansion during breakout
4. Long-Term Trend: Steep uptrend from 2020 lows still intact
For Conservative Traders:
- Wait for successful retest of 3,740-₹3,800 zone
- Confirm with strong bounce and volume
- Enter on confirmation with tighter stops
For Long-Term Investors:
- Accumulate on any dip to 3,700-3,800
- Strong fundamental backing (Infrastructure leader)
- Multi-year breakout suggests sustained momentum
- Target: 5,500-6,000 (12-18 months)
- ❌ Failure Signal: Close below 3,740 = False breakout, back to range
What to Watch:
1. Monthly candle close (crucial for pattern confirmation)
2. Volume sustenance above breakout level
3. No bearish engulfing on weekly/monthly timeframe
4. Hold above previous consolidation high (3,800)
DISCLAIMER:
This analysis is for educational purposes only and NOT financial advice.
- Technical patterns may fail; past performance doesn't guarantee future results - Breakouts can be false; always use stop losses - Conduct your own research and consult a financial advisor - The author may or may not hold positions in L&T - Trading/investing involves substantial risk of capital loss - You are solely responsible for your investment decisions
**Trade responsibly with proper risk management.**
#LarsenToubro #LT #Breakout #TechnicalAnalysis #NSE #Infrastructure #RangeBreakout #MultiTimeframe #BlueChip #IndianStocks

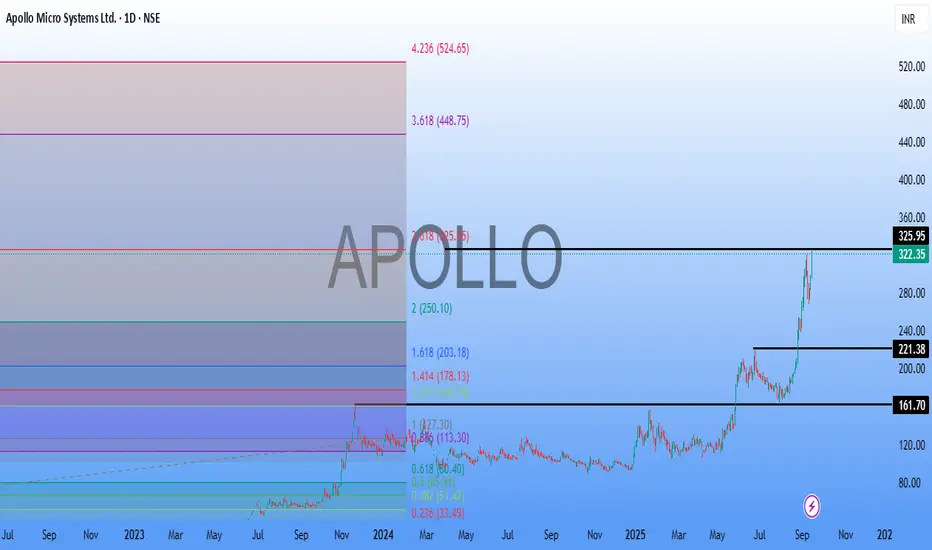
ApolloMicro SystemsApollo Micro Systems (AMS) is an Indian defense and aerospace electronics company poised for growth due to strong order books and expansion plans.
Apart from the Fundamentals, from Technical Point of view based on previous high breakout, stock has reached the Fibo Extension of 325.95. and its the Major Resistance.
Its a buy on dip candidate for a short to long term Investment stock,
with next target of 448.75 / 524.65.
Epigral Ltd. at Buy Support. CMP 2158Epigral Ltd. at Buy Support. CMP 2158. Breakout at 2300. Momentum is strong, needs volumes to support the move.

Hindustan Copper: Charting a Fresh Rally After Breakout📈 **Weekly Time Frame Analysis:**
Sharing the weekly chart of Hindustan Copper, a stock that personally appears quite promising. Here's why:
1. Fresh Breakout: Witness a new breakout on the chart, signaling a potential bullish trajectory.
2. Retest at 197: Notably, the price (197) has been retested in the daily time frame, adding to the positive outlook.
Key Observations:
- Persistent Resistance: The stock had long-standing resistance from a trend line, which was convincingly broken in Feb 2021.
- Rally and Retest: Following the breakout, a substantial rally ensued, and the stock retraced to touch the trend line, confirming it as a retest.
Anticipating a New Rally:
Given these patterns, the stock seems poised for another potential rally. What are your thoughts?

#ABFRL STRONG BUYABFRL Scalling up. After making Higher High, after Forming a Base made a Trend Continuation Pattern.
Trend and Targets are Intact.
Maintain your proper Sl

Technical Analysis for Bank Nifty Tomorrow**Technical Analysis for Bank Nifty Tomorrow**
**Support and Resistance Levels**
* **Support:** 44500, 44400
* **Resistance:** 44700, 44800, 45000
**Option Open Interest**
* **Support:** 44500 Put Writer is huge as compared to CE Writer
* **Resistance:** 44700/44800 and 45000
**Overall Outlook**
The Bank Nifty is expected to move bullish tomorrow. However, it is important to note that there are strong resistance levels at 44700, 44800, and 45000. If the Bank Nifty is unable to break through these levels, it could face selling pressure.
**Key Points**
* The Bank Nifty is in a sideways trend today, with no major buying or selling movement.
* 44900 is a strong resistance level on the upside, while 44400 is a strong support level on the downside.
* The option open interest suggests that there is strong support at 44500 and strong resistance at 44700/44800 and 45000.
* The overall outlook for the Bank Nifty tomorrow is bullish. However, it is important to note that there are strong resistance levels at 44700, 44800, and 45000.
**Trading Strategy**
Traders can go long on the Bank Nifty if it breaks through the 44900 resistance level. However, they should place a stop loss below the 44500 support level. Traders can also go short on the Bank Nifty if it falls below the 44400 support level. However, they should place a stop loss above the 44900 resistance level.
**Disclaimer**
This is not a financial advice. Please do your own research before making any trading decisions.

Persistent Systems in an accumulation phase or will it dip againPersistent Systems have been trading in a broad range for the last few months. It has tested the bottom range thrice and now the prices are hovering near the upper range where we can also spot an accumulation and a confluence of the upper range and another resistance trendline.
As for the bearish section, there is a confluence of 200 EMA and the support trendline, but as for the performance of the sector, my personal belief is that the stock might show us a good rally anytime now.
Trade with due diligence.

Triangle breakout in GNFCIf we look at the daily timeframe for GNFC , we can clearly see there is a triangle breakout with good volumes. The breakout has come almost after 4 months of consolidation inside the triangle. After the breakout, there has been a small consolidation which is really healthy for the stock. At any given day, the stock can gain momentum and rise now. It is also near to the psychological level of Rs 500. Once the stock gives closing above Rs 500 in the daily candle closing, we can see a good move. We can easily aim for 5% - 10% returns from the stock.
Do like it :) It will motivate me to write more

Channel Breakout in HEMIPROPLooking at the chart in daily timeframe for Hemisphere Properties, we can clearly see there is a breakout from the channel pattern after almost a year of consolidation. The upper trend line of the channel has been broken with absolutely huge volume. We can see a small consolidation after the breakout which is a healthy sign for the stock to move upwards. If the momentum continues, it can easily give double digit returns to the investors.
You will also find many other stocks ideas in my profile! Do like it :) It will motivate me to write more

Triangle Breakout In BrigadeLooking at the daily timeframe for Brigade Enterprises, we can clearly see a triangle breakout after 4 months of consolidation. Currently it has broken the upper trend line of the triangle. If we see, the breakout candle was a bearish doji candle but the next 2 candles have confirmed the breakout. The current closing is at Rs 517 which can be considered for buying. It is also near it's all time high. We might be seeing a price discovery from the next few candles. A very high probability of 5% to 10% push in price is possible.
Do like it :) It will motivate me to write more

Triangle Breakout in AsterDm HealthcareIf we see the daily timeframe for Aster DM healthcare, it is clear that the stock has given a breakout after 5 months of consolidation inside the triangle pattern. Currently it has broken the upper trend line with good volumes. It is also near to the psychological level of Rs 200. If it breaks Rs 200 with good volumes and gives a candle closing above it, we might see a aggressive buying in this stock. With the current momentum, we can definitely look out for 5%-10% gain from this stock in the short term.
Do like it :) It will motivate me to write more

Triangle breakout in Gujarat AlkaliesIf we see the char in daily timeframe for Gujarat Alkalies, we can see a triangle breakout with rise in volume. The upper trend line in the triangle has been broken. The momentum has been very good from the past 2 candles. If the bulls support the momentum, it can easily give us more than 5% returns in the short term. This breakout might also lead to All Time High. But we can't predict anything.
Do like it :) It will motivate me to write more


SBIN selling sideHello guys i had find this setup in 1h timeframe which is made some bearish pattern and also broken trendline and made some bearish consolidation pattern we have a great selling opportunity with above swing high sl and below trendline tg and plzz do your own analysis before taking any trade if you like my analysis plzz like share and follow thank you

techm selling sideHello guys i had find this selling setup in 4h timeframe which is at good resistance area and we have a good high risk to reward setup we can sell from here with the sl at above resistance and below channel tg also plzz do your own analysis before taking any trade if you like my analysis plzz like share and follow thank you

Cipla on selling sideHello guys i had find this swing setup in 1D timeframe which made double top and also broken trendline with broken market structure we can short from here with above swing high sl and 1:2 RR tg also plzz do your own analysis before any trade also if you like my analysis plzz like share and follow thank you

Buying side khadimHello guys i had find this positional trade in 1W timeframe which made a very good buying setup and in bullish trend we can buy when it come to retest don't hurry to buy from here we will buy on retracement in weekly timeframe i will update you about this script in coming days also before taking any action on my chart do your own analysis if you like my analysis do like follow share thank you

Sell side sunpharma Hello guys i had find this setup which is made a upper channel resistant and made consolidation pattern and broken we are getting a good selling opportunity with above sl and tg 1:2:3 and plzz before taking any trade do your own analysis also if you like my analysis do share like and follow


I

Easy money in RaymondShort sell with levels mentioned and trail half quantity on hitting 1st target
REASON- Macd divergence + rejection at supply zones
If you like my ideas, reach me out on my twitter handle @Harsh_3700
