USD/JPY Bullish Breakout Setup – Entry, Stop Loss & Target AnalyPair: USD/JPY
Timeframe: 15 minutes
Indicators Used:
EMA (30-period) – Red line
EMA (200-period) – Blue line
Chart Features:
Downward channel (declining trendline)
Identified entry point, stop loss, and target
Key support/resistance zones shaded in purple
🟢 Trade Idea Summary:
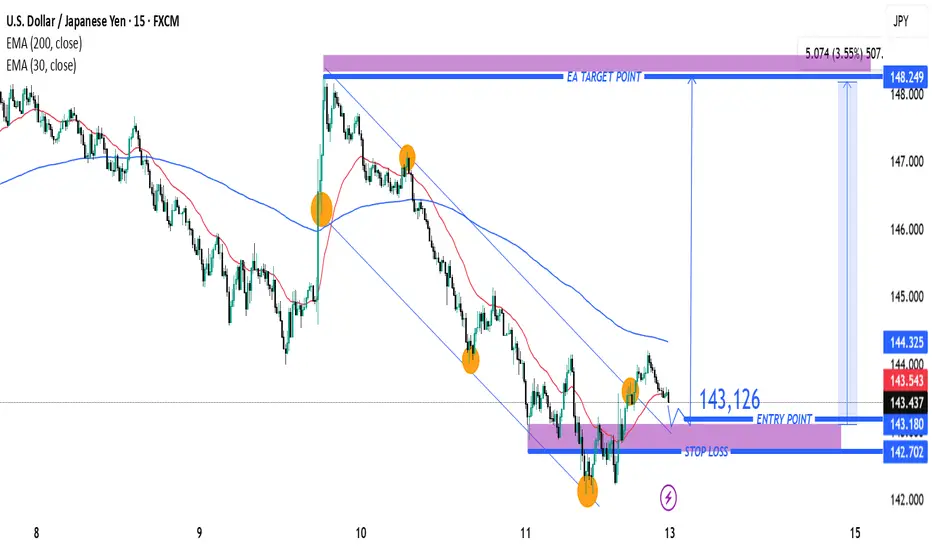
🔹Entry Point: 143.126
🔹Stop Loss: 142.702
🔹Target (Take Profit): 148.249
🔹Risk/Reward Ratio: ~1:5 (Excellent R/R)
🔍 Technical Analysis:
✅ Bullish Breakout Signal
Price has broken above the descending channel and has retested the breakout area (highlighted purple zone) – a classic bullish breakout structure.
The breakout retest near 143.126 is acting as support, with potential to launch a new bullish move.
📈 Moving Average Analysis
EMA 30 is starting to flatten and curve up – indicating potential shift in momentum.
EMA 200 is still above price, but a breakout above it could strengthen the bullish case.
🔁 Support and Resistance
Strong support zone around 143.000 – 143.200 area (highlighted zone).
Major resistance and target zone is between 148.000 – 148.250.
🔔 Trade Plan Suggestion:
Go Long at or near 143.126
Place Stop Loss below support at 142.702
Target 148.249 for profit
Reasoning:
This setup offers a trend reversal potential from a downtrend to uptrend, with a clean breakout-retest-confirmation pattern. The wide take profit range gives room for extended upside as momentum builds.
⚠️ Watch For:
Reaction to the 144.325 (EMA 200) level
Increased buying volume to confirm breakout
Any re-entry into the channel (would invalidate setup)
Indicators
Silver (XAG/USD) Bullish Trade Setup: Entry, Target & Stop-Loss Entry Point: ~32.35619
Take Profit (Target Point): 33.31252
Stop Loss: 31.87803
EMA 200 (Blue): 31.65932 – indicating long-term trend support.
EMA 30 (Red): 32.28304 – indicating short-term trend.
Current Price: 32.38220
The price is above both EMAs, which is typically bullish.
---
Analysis
1. Bullish Bias:
Price has broken and is holding above the entry zone.
Both EMAs are aligned in a bullish configuration (short-term EMA above long-term EMA).
The market structure shows higher lows and sideways consolidation, suggesting potential for a breakout.
2. Risk-Reward Ratio:
Risk (Entry to Stop Loss)

BTCUSD READY TO FLY 3500 POINTS..CHECK IT WORLD CLASS ACCURACY??BTCUSD strong zone above only 85550
there is no resistance upto 89000..3500++ point
wait for active mode
Buy above 85550
Stoploss.............84600......950 points
Target1.............87000........1500 points
Target2.............89000++......3500 points
Disclaimer - This level only for education purpose . Do ur own analysis
Magic Indicator - private only script ( any one want 1 week demo for dm me in tradingview. Sent ur username )

GOLD (XAUUSD) 15-Min Chart – Bearish Reversal Setup with Key EntPrice: $3,232.02 (at time of chart)
Trend: Price is consolidating near a resistance area after an upward move, with potential for a reversal.
🔍 Key Technical Levels
📈 Entry Point: $3,241.88
(Marked for a potential short entry)
🔻 EA Target Point (Take Profit): $3,187.70
This is the target for the short position; aligns with a strong previous demand zone and near the 200 EMA.
⛔ Stop Loss Zone: Above $3,243.48
Purple zone indicates the invalidation area for the short trade.
📉 Resistance Point: $3,229.87
(Red line, also the 30 EMA) – Important level where price is currently hovering.
🔵 Confirm Target Points: $3,223.04 & $3,218.25
Zones to watch for confirmation of downward momentum.
📘 EMA (30): $3,229.87
Acts as short-term dynamic resistance.
📘 EMA (200): $3,182.40
Acts as major support and long-term trend indicator. Also very close to the target area.
💡 Trade Idea Summary
Strategy: Short (Sell) from the resistance/entry point around $3,241.88.
Target: $3,187.70
Stop Loss: Above $3,243.48
Risk-Reward Ratio: Solid (approx. 1:2+ based on visual range)
🔎 Additional Notes
Price is testing resistance after forming a potential double top or lower high.
A breakdown below $3,223 could confirm bearish continuation.
Watch for confirmation candles on 15m or 1h before entering

EMA 30 (Red Line): Currently at 99.700 — tracks short-term trendEMA 30 (Red Line): Currently at 99.700 — tracks short-term trend, and price is hovering near this level.
EMA 200 (Blue Line): At 100.935 — indicates long-term trend, acting as dynamic resistance above.
📈 Trade Setup
✅ Entry Point:
Price: 99.699
Rationale: This level has been tested multiple times, forming a support zone. A bounce here signals a potential long entry.
🎯 Target Point (Take Profit):
Price: 102.738
Distance: ~3.04 points or 3.43% potential move upward.
Note: Marked as EA TARGET POINT, which suggests a calculated area possibly based on previous resistance or algorithmic strategy.
🛑 Stop Loss:
Price: 98.624
Reasoning: Just below the defined support zone (highlighted purple area), ensuring protection against downside breakouts.
📊 Risk-to-Reward Ratio
Entry: 99.699
Target: 102.738 → Gain of ~3.04
Stop: 98.624 → Risk of ~1.08
R/R Ratio: ~2.8:1 — favorable setup
📌 Overall Sentiment
This chart indicates a bullish reversal setup from a strong support zone, possibly targeting a mean reversion or trend reversal toward the 200 EMA and beyond.
However, keep in mind:
The price is currently below both EMAs, so the trend is still bearish.
The trade is counter-trend, relying on support holding and momentum shifting.

BTCUSD READY TO 1800 POINTS FALL CHANCE BTCUSD if break below 84810
there is no suport upto 83000
curent mkt price 84990
Wait for active zone
Sell below ...............84810
Stoploss...................85150...........340 points
Target1...................84150..........660 points
Target2...................83000...........1800 points
Disclaimer - This level only for education purpose.. Do ur own analysis

GBP/USD Short Setup – Rejection from Resistance Zone with High REMA 30 (red line)
EMA 200 (blue line)
---
Key Levels:
Entry Point: 1.31324
Stop Loss: 1.32303
Target (TP): 1.28102
---
Analysis:
1. Trend Context:
The market shows a recent bullish move approaching a key resistance zone (highlighted in purple).
The price is now reacting to that resistance zone and potentially forming a reversal.
2. EMA Insight:
Price is currently trading slightly above the EMA 200 and EMA 30, indicating short-term bullish momentum.
However, the suggested trade setup appears to be short (sell), anticipating a reversal from

"BTC/USD Short Setup: Supply Zone Rejection & 5% Drop Target!"BTC/USD 15-Min Chart Analysis
Trade Setup by EA_GOLD_MAN_COPY_TRADE
---
🔼 SUPPLY ZONE (Resistance)
🟣 Price Area: $83,427.80 – $84,313.06
This is where sellers might step in
Price is expected to reverse or slow down here
🔽 ENTRY POINT
🔵 Sell Entry: $83,427.80
Entering short trade just below the supply zone
Aiming to catch a reversal move down
⛔ STOP LOSS
🔴 Stop: $84,313.06
Placed above the supply zone
Limits risk in case of breakout upward
❗ Protects the trade from loss beyond this point
🎯 TARGET / TAKE PROFIT
🟣 Target: $79,071.05
Major support zone / demand area
Potential Drop: -$4,434.27 (-5.31%)
Big reward zone if price dumps from supply
📈 Trendline & Moving Averages
🔵 Blue = Likely 50 EMA
🔴 Red = Likely 200 EMA
Bullish momentum leading into the supply zone
Trendline supports the prior uptrend, now testing reversal
💡 Conclusion
✅ Trade Bias: Bearish (short)
⚖️ Risk-to-Reward: ~1:5 (Great!)
If price reacts at supply, this setup could pay big
But if it breaks up, stop loss keeps you safe

Bitcoin Trade Setup: Bullish Breakout Targeting $87K!🔹 Key Levels Identified:
📌 Target Point: 87,008.21 USD 🏁🔵
👉 Expected price move (+9.07%) 🚀
📌 Entry Point: 79,719.00 USD ✅
👉 Suggested buying level in demand zone 🏦
📌 Stop Loss: 78,213.25 USD ❌🔻
👉 Risk management level 📉
📊 Technical Analysis:
📈 Trendline Support:
🔵 The price bounced off the trendline 📊, confirming an uptrend 📈
🔵 Demand Zone:
🟦 Marked blue area = Buyer interest 📊
💰 Expected reversal zone if price retests
📊 Moving Average (DEMA 9):
🔸 82,343.85 USD (current level)
🔺 Price slightly below DEMA ➝ possible bullish reversal 🚀
⚡ Trade Setup:
✔️ Risk-to-Reward Ratio:
🟢 Potential profit: +7,220.76 USD
🔴 Risk: -1,500 USD
📊 Favorable trade setup with high reward vs low risk ✅
✔️ Momentum Confirmation:
🟢 Above 79,719 USD = 🚀 Bullish breakout
🔴 Below 78,213.25 USD = ❌ Stop Loss triggered
🔮 Conclusion:
🔥 Bullish setup if price holds demand zone!
🚀 Target: 87,008 USD
⚠️ Manage risk with stop loss! 📉

WTI Crude Oil TradeSetup:Demand Zone Reversal & Trendline Brkout📉 Trendline Resistance
🔴🔴🔴 (Multiple rejection points along the descending trendline)
📊 Demand Zone (Support Area)
🟦 Blue Zone (59.08 - 57.90) → Potential Reversal Area
✅ Entry Point: 59.08
🟡 (Marked in yellow) – Ideal buy zone
🎯 Target Point: 63.90
🔵 (Top Resistance Level) – Profit-taking zone
⛔ Stop Loss: 57.90
🟥 (Risk Management Zone) – To prevent big losses
📈 Possible Scenario:
1️⃣ Price drops into 🟦 demand zone
2️⃣ Bounces ⬆️ off support (bullish move 🚀)
3️⃣ Hits 🎯 target (63.90) ✅
⚠️ Alternative Scenario:
If price 📉 breaks below 🟥 stop loss, downtrend may continue.
This trade setup looks good with a 4:1 risk-reward ratio! 🏆

USD/JPY Bearish Trade Setup – SBR + DBD Zone Rejection📉 Trend Analysis:
🔴 Downtrend confirmed by lower highs and lower lows.
📉 Descending trendline indicates continuous bearish pressure.
🔹 Key Levels & Zones:
🔵 Resistance Zone (SBR + DBD) – 144.123 📍 (Sell Entry Point)
🟠 Stop Loss – 145.209 🚫 (Above resistance to avoid fake breakouts)
🟢 Target Point – 139.694 🎯 (Strong support area)
🏹 Expected Price Action:
🔸 Scenario:
🔺 Price moves up toward the resistance zone (🔵 SBR + DBD Zone)
🔻 Bears take control (Rejection expected)
⚡ Drop towards target at 139.694
📊 Trade Plan:
✅ Entry – Wait for rejection at 144.123 (🔵)
✅ Stop Loss – Keep at 145.209 (🛑🔺)
✅ Take Profit – Aim for 139.694 (✅🎯)
💡 Risk-Reward Ratio: Good (More reward than risk)

Gold (XAU/USD) Trade Setup –Bullish RBR Zone & High Reward Poten🔹 Key Levels:
📍 Entry Point: 3211 🔵
📍 Stop Loss: 3185.109 🔴
📍 Target Point: 3300 🟢
🔹 Market Structure:
📈 The price has formed a Rally-Base-Rally (RBR) zone 📊, which is a bullish continuation pattern 🚀.
🔄 The market surged and is now consolidating within the RBR zone 📦 before potentially resuming its uptrend 📢.
🔹 Trading Plan:
✅ Buy Entry: If price retraces into the RBR zone (around 3211), consider a buy position. 🛒📊
🔻 Stop Loss: Set below the base at 3185.109 to limit risk. ⚠️🚫
🎯 Take Profit: Aiming for 3300, a major resistance level. 🎯📈
🔹 Indicators & Confluence:
📏 DEMA (9): 3223.297 (Currently acting as resistance 🛑)
💰 Risk-Reward Ratio: Favorable setup (High Reward Potential ✅)
🔹 Potential Risks:
⚠️ If price drops below 3185, it could indicate a trend reversal 🔄⛔.
🌎 Economic News & Geopolitical Factors may impact Gold prices significantly. 📰📉
🔹 Conclusion:
📊 Bullish Opportunity 🦅📈 – If the price respects the RBR zone, it may continue upwards towards 3300! 🚀💰

"WTI Crude Oil – Bullish Bounce from Demand Zone? "🔵 . Demand Zone:
⬇️ 60.53 – 59.71
This is the buy zone where bulls are likely to step in!
Price is currently testing this area. Watch closely!
🛑 . Stop Loss (Risk Zone):
📉 Below 59.66
If price falls below here, exit the trade – demand has failed.
🎯 . Target Point:
🚀 63.85
This is the take profit zone. A successful bounce could reach this level!
🟠 . EMA (9-period DEMA):
📉 Currently around 60.86
Price is slightly below EMA, showing short-term bearish pressure.
🟢 . Trade Idea Summary:
• Enter near the blue demand zone
• SL below 🔴 59.66
• TP at 🎯 63.85
• R:R ratio looks favorable (low risk, high reward)
Outlook:
As long as price holds above the demand zone, this setup remains bullish 📈
Let’s see if the bulls can push it to that 63.85 target! 🚀💰

Bitcoin (BTC/USD) Technical Analysis – Bullish Setup🔵 Key Levels:
🎯 Target Point: 87,050.22 (🔼 Expected upward move)
🔵 Support Zone: 79,833.82 (🛡️ Strong demand area)
🔴 Current Price: 82,254.27
📊 Analysis:
🔵 RBS + RBR Zone (🔄 Role Reversal Support & Rally Base Rally) - Possible entry point for a long position.
🟠 Stop Loss: Below 79,833.82 (🚨 Risk Management)
🟣 Resistance Zone: Near 83,000 (🔄 Possible short-term pullback)
📈 Strategy:
1️⃣ Price might retrace to the blue zone (support) before continuing upward.
2️⃣ If it holds, 🚀 potential rally towards 87,050.22 🎯
3️⃣ If it breaks below support, ⚠️ possible downside risk.
✅ Conclusion:
A bullish setup with a 7.45% profit target 📊
Risk managed with a stop loss below support ⚠️

XAUUSD INTRADAY WISE CHANCE UPTO 12.50 POINTSXauusd strong buy above zone 3130.50..
There is no resistance upto 3143.40
Wait for active zone
current mkt price 3122.10
Buy above 3130.50
Stoploss.......3123.50....7 points
Target1........3135.50....5 points
Target2........3143.50....12.50+++ points
If active only above this level applicable
Disclaimer - This level only for education purpose . Do ur own analysis

"Gold Price Rejection Setup – Trendline + Resistance Combo"XAU/USD 1H Chart Analysis 🪙📉
🔹 Trendline 📐
* Descending trendline marked by 3 touches
* Shows consistent bearish pressure
* Price is respecting it—watch for rejections
🔹 Resistance Area ⛔
* Blue zone between $3,014 - $3,025
* Strong supply zone—price failed to break it before
* Potential reversal zone if price touches again
🔹 Entry Point 🎯
* Suggested short entry at $3,014.29
* Just under resistance + near trendline
* Great spot for catching a downward move
🔹 Stop Loss ⚠️
* Placed at $3,025.13
* Above resistance = smart protection
* Keeps risk under control if breakout happens
🔹 Target Point 💰
* Take-profit marked around $2,964.45
* Down at a key support level
* Clean risk-to-reward around 1:5 (sweet setup!)
🔹 Moving Average (DEMA 9) 📈
* Dynamic resistance (line hugging candles)
* If price closes below, confirms bearish move
Summary ✅
This setup is a classic trendline + resistance short. You're betting on price respecting resistance and heading lower.
Bias: Bearish 🔻
Entry: $3,014.29
SL: $3,025.13 🛑
TP: $2,964.45 ✅

XAUUSD READY TO FLY 22 POINTS IN INTRADAYXAUUSD strong zone above 3032
There is no resistance upto 3048....16 points
CURRENT MKT PRICE 3028.70
wait for active zone
Buy above 3032
Stoploss..........3024....8 points
Target1..............3038...6 points
Target2...............3048...16 points
Target3...Risk..........22 points
Disclaimer - This level only for education purpose and papertrade purpose only. Do ur own analysis

XAUUSD INTRADAY TARGET 22 POINTS...3032 TO 3054+XAUUSD strong zone above 3032
There is no resistance upto 3048....16 points
wait for active zone
Buy above 3032
Stoploss..........3024....8 points
Target1..............3038...6 points
Target2...............3048...16 points
Target3...Risk..........22 points
Disclaimer - This level only for education purpose and papertrade purpose only. Do ur own analysis

XAU/USD Holding Above $3,050 – Breakout or Pullback Next?XAU/USD Update 📊
Gold just touched $3,061 and is now hovering around $3,056. Price is holding within the ascending channel, showing signs of consolidation.
🟢 Bullish Scenario: If buyers defend this level, we could see another push toward $3,100+, with $3,153 still in play as a key resistance.
🔴 Bearish Risk: A break below $3,050 - $3,020 could trigger a deeper correction toward $2,980, where stronger demand may step in.
📉 Watching price action closely—let’s see how it reacts from here! 🚀

NFP XAUUSD ANALYSIS 58 PTS -TP -3178- WORLD CLASS ACCURACY ??XAUUSD STRONG BUY ZONE ABOVE 3120
There is no resistance upto 3178
current mkt price 3111
Wait for active zone
Buy above 3120
Stoploss…….3103………17 points
Target1…………3135……….15 points
Target2…………3168……….48 points
Target3… Risk………………..3178...58 points
Disclaimer - This level only for education purpose. Do ur own analysis

Gold Price Analysis:Key Supply & Demand Zones with Potential Bkl🔥 Key Levels & Zones
🔵 Supply Zone (3,135-3,140 USD) 📉
Acts as resistance where selling pressure increases.
If price reaches here, expect a potential pullback.
🟢 Demand Zone (3,085-3,095 USD) 📈
Strong support area with buying interest.
Price has tested this zone multiple times = accumulation.
🎯 Target Point (~3,167 USD) 🚀
If price breaks out, it may rally towards this level!
❌ Stop Loss (~3,080 USD) ⛔
Marked below demand zone to limit risk.
---
📊 Trend Analysis
🔹 Trend Line Break ⚡
The price broke the previous uptrend = potential reversal or deeper correction.
🔹 Market Structure 🏗️
Price consolidating inside the demand zone = possible bullish move ahead.
🔹 Double Bottom Formation (DBF) at Supply Zone 🔄
Shows failed breakout attempts = strong resistance.
---
🔍 Indicators & Insights
📌 DEMA (9 close) at 3,099 USD 📈
Price hovering around this moving average = market indecision.
---
🚦 Possible Scenarios
✅ Bullish Scenario:
If price holds the demand zone & breaks above 3,110 USD, it could rally to supply zone (~3,135 USD).
A breakout above 3,140 USD could lead to the target zone (~3,167 USD) 🚀.
❌ Bearish Scenario:
If price breaks below 3,085 USD, it may hit stop loss (3,080 USD) and continue lower.
---
🎯 Trading Plan
🟩 Long Entry ➡️ Around 3,090-3,100 USD 📊
🛑 Stop Loss ➡️ Below 3,080 USD 🚨
🎯 Target ➡️ 3,135-3,167 USD 🎉

BTCUSD READY TO FLY 1450 POINTS UPSIDE POSSIBLEBTCUSD strong zone above only 82940
There is no resistance upto 84400...
wait for active zone
Buy above 82940
Stoploss 82700...........240 points
Target1.............83200.....260 points
Target2..............83400.....460 points
Target3.... Risk...84400.......1460 points
Disclaimer - This level only for education and papertrade purpose. Do ur own analysis

XAUUSD READY TO FLY 17 POINTS UPSIDE POSSIBLE ABOVE 3099.20 XAUUSD Strong above 3099.20
There is no resistance upto 3116....17 points
Wait for active zone
Buy above 3099.20
Stoploss...........3091.....8 points
Target1........3103.30......4 points
Target2........3109...........10 points
Target3........3116.............17 points
Disclaimer - This level only for education and papertrade purpose. Do ur own analysis
If any doubt dm me
