NIFTY PVT BANK INDEX BREAKOUTBuy Nifty PVT Bank Index At Cmp 23246
SL - 22750 ( Weekly Closing Basis )
Target - 25800
All Pvt Bank Stocks Buy
Indusindbank

IndusInd Bank forming Flag and Pole pattern.Indusind Bank is consolidating in a range after a good rally forming a flag and pole pattern on the weekly charts.
The stock has formed a dragon fly doji and is trading in 5% range for last 40 days which predicts that there will be a nice break out or break down.
It has been trading around the 20 ema on the daily charts and in the last session given a 2% bullish move closing above the moving average.
The stock is holding the recent high and is consolidating around it while the other banking stocks have given a retracement after forming new recent highs.
Previously, the stock has given a nice rally of 13% after the break out. The stock looks in the bullish mode, if the stock gives a break out, cash positions can be carried and hedged future call of current expiry can be carried.
Target :- 1550, 1665
Entry :- After the break out of 1440 levels.
Stop loss :- Close below the previous hourly consolidation.
Watch for the weekly close above the consolidation zone and if the stock gives a close above it in the daily chart, position can be entered with a small Stop loss.
Wait for the price action near the levels before entering the market.

Stop Loss hit for Indusind BankI posted about an H&S pattern breakout in IndusIND bank hourly chart. Stop Loss has been hit for it.

Indusind Bank Head and Shoulder Pattern - hourly timeframeYet another H&S structure is formed in the IndusInd Bank's chart of hourly time frame. In a bull market like the one underway, this pattern has a very high probability of achieving the target. I am going long, are you?
PS: This is NOT a trading call or advice. Please do your own research.

INDUSIND BANKENTRY TARGET SL Mention in the chart.
ALWAYS TAKE TRADE WITH CONFIRMATION
Note : Trading in any financial market is very risky. I post ideas for educational purpose only. It is not financial advice. Do not hold us responsible for any potential loss you may incur. Please consult your financial adviser before trading.

#Nifty IndusInd Bank. Continues next leg of uptrendIndusInd bank after breaking out of long consolidation is looking to go for next leg of up move with strong bullish engulfing candle

INDUSINDBANK STANDING ON RESISTANCEIndusind bank is standing on long term resistance
need to watch if it is going to break it
volume is good,stock to watch
educational idea

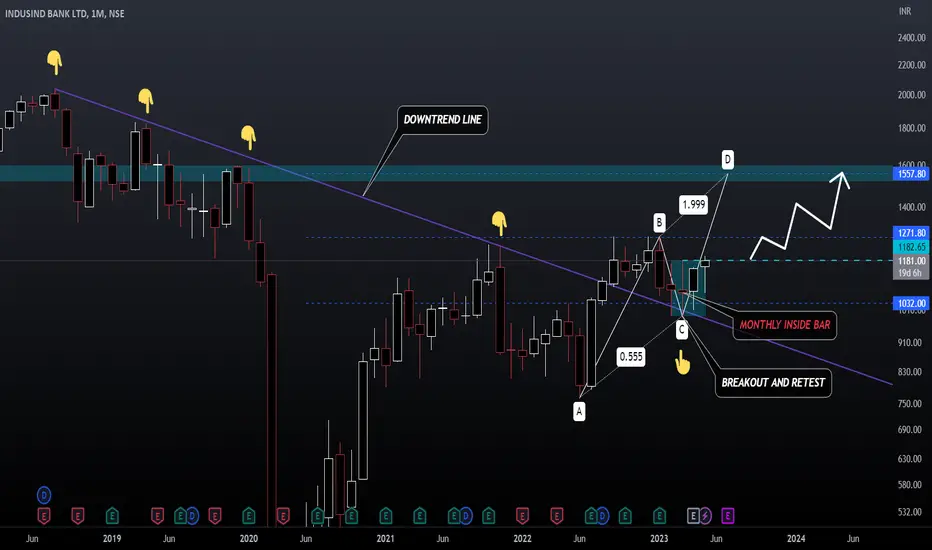
INDUSIND BANK INDUSIND BANK has broken out of its 5 year old downtrend line showing big buyers coming in the stock , retest of support is also done and the stock has formed a good inside bar candle in monthly time frame . Any breakout above the inside bar candle range will be a confirmation of upcoming rally in the stock , ie levels of 1180 , one can go long above this range if a weekly candle closes above it for targets of 1500 levels in medium to long term
INDUSINDBK Ready for breakoutIndusind bank is about to break trend line in daily/weekly chart. Can expect 20% up movement in upcoming days.
This is for education purpose only not recommended to buy/sell.

How to trade possible short term setup on IndusInd bank ltd?How To trade ABC pattern formation on 30 Mins chart of IndusInd bank ltd
1. Price has formed ABC pattern on 30 mins chart (clearly marked as points ABC on chart).
2. A-B retracement is approx. 0.50% which is acceptable criteria for A-B retracement.
3. Marked fibonacci levels (0, 0.236 and 0.382) by using fibonacci tools on range B To C.
4. On this ABC setup, Price crossed 0.382 first time on 23rd march 2023 (marked the date on chart as well) and retraced back to 0.236 and 0.382 levels of fibonnaci and hovering around the same levels.
5. IMPORTANT: Wait for price to cross again 0.382 fibonacci levels , which is price as 1027 (also in chart marked as entry level) keeping stop loss of 1010 (which is below 0.236 fibonacci levels) for the target of 1073.65-1086.55 (which is Point B candle low and high price)
6. RSI divergence occurred as well and same has been marked on charts, which is good indication
7. On fundamental grounds: IndusInd Bank Ltd.’s Revenue was higher than average estimate 3 times in past 3 years.
Note for everyone who came across this study:
This is only for educational purpose.
This is not buying or selling recommendations.
I am not SEBI registered.
Please consult your financial advisor before taking any trade.

WILL #INDUSINDBANK MAKE OR BREAK CRUCIAL MOVING AVERAGE ZONES??Trade Wisely. We Can Just Predict.
Disclaimer: I am not a SEBI registered advisor , so before entering on my view please ask your SEBI Registered Advisor . Profit is your and loss is your.
If you love my analysis Like And Share wherever you want..

#Indusind Bank QML PatternQML Pattern:
Script: Indusind Bank
Entry Range: 872 to 854
T1:1026
T2:1222
SL:758

INDUSIND BANK DOUBLE BOTTOM BREAKOUTIndusind bank giving double bottom breakout
with good volume
trading above 20ema
target can be 1270
only for education

INDUSIND BANK BULLISHINDUSIND BANK trading above 200ema
breaking 20 ema entering in uptrend
1150 is resistance
educational idea

#INDUSFIN BUY at 28, Target 41, SL 22 . #sharemarket #stockmar#INDUS FIN:
Breakout Happened on the upper side of the wave formation. SO we can Expect a Target of 41, with SL 22.
NOTE: Published Ideas are for ‘’EDUCATIONAL PURPOSE ONLY’’ trade at your own risk.
NOTE: RESPECT The risk. SL should not be more than 2% of the capital.
Happy Trading

Indus Ind Bank on support levelsIndus Bank is at a good level. We can start accumulating the stock from here. The stock is at a discounted price.
The fundamentals are good for the bank.
The market has shown good strength today. Tomorrow can be a little jittery but stay strong.

IndusInd Bank: RangeboundNSE:INDUSINDBK is a rangebound:
Range is: 1125-1275. Middle: 1200.
A breakout of 1275 with volume and momentum would take it to 1310/1360/1425.
SL: 1200.

indusind-bank long\short idea the reason why i am recommending you guys this stock is because when last time it reached this level i went for a long position that gave me a good 1:4 R:R target so i am hoping it"ll repeat it again or we can short it below the support level


Indusind Bank BreakoutIndusind Bank chart on daily TF shows breakout on falling wedge pattern. This is bullish signal. We can go long with targets 1230 and 1280
Just for Educational Purpose Only.

Range breakout in IndusInd Price has been sustaining above the range high which was acting as a string resistance in the IndusInd bank daily timeframe chart for a couple of weeks. On an hourly timeframe, the trend line drawn has been acting as a good support. One can look to go long given the sector tailwinds with the trend line as SL on a closing basis.
Best of luck!

IndusInd bank out of the consolidation zone.Indusind Bank has given a break out of the consolidation and crossed the 20 ema on the daily time frame.
The stock has been in consolidation from october and gave a nice break out in the end of november.
The stock can be traded once there is retest of the level and the stock can give nice up side targets.
3 points confirmation.
1. Break out of the consolidation zone.
2. Crossed daily 20 ema and closed above it.
3. The volumes are higher than the previous day.
The stock option and stock can be traded once the stock retest 1160 levels.
Traget:- 1229, 1265
Stop loss :- 1150
The stock can be traded for intraday once it crosses above 1173 and can give a intraday target of 1200.
Wait for the price action and enter once the stock gives a close above the levels.
