INDUSINDBK

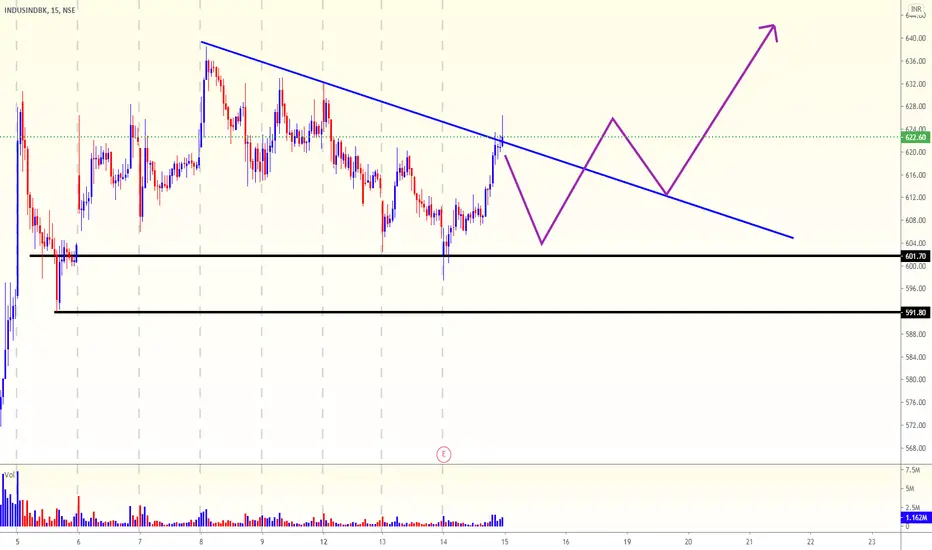
Indusindbk - Intraday buy or sell after breakout levelsIndusind Bank is making Ascending chart pattern...Buy or sell after Breakout lines
Buy if it crosses above 612.
1st Target at resistance 1 - 622
2nd Target at resistance 2 - 630
Short if it breaks below 605
1st Target at support 1 - 600.5
2nd Target at support 2 - 595
*This is my analysis just for the educational purpose.


Indusind bank important levels These are the important levels to watch out for in Indusind bank. Crossing of these levels mean that the stock will be pulled to the adjacent next level.

Indusind Bank #indusindBank still valid for Long. Need to watch the movement with current trendline.

Will Indusind Bank Break HNS patternIndusind Bank is trying to make Inverse Head and Shoulder patter, Stock is trading above all EMA (20,50,100,200).
once pattern is broken, Stock has potential to reach 700+ levels.
Support is seen at 595 level.

Induslnd stock to take long entryBullish mode in stock . Flag pattern long above 632 TGT 680-685 SL 605. Risk to reward ration 1: 2. This is for your educational purpose only.


BANKNIFTY KEY LEVELS SUPPORT AND RESISTANCEBANKNIFTY KEY LEVELS SUPPORT AND RESISTANCE
Levels marked on 1Hr Timeframe, Can be taken for Intraday as well as swing


Induslnd stock to buyInduslnd stock to buy for long entry. levels mentioned on the charts. This is for your educational purpose.

BANKNIFTY KEY LEVELS SUPPORT AND RESISTANCEBANKNIFTY UPCOMING SCENARIO EXPLAINED
SCENARIO 1- FOR UPPER RESISTANCE BREAKOUT
******************
SCENARIO 2- TESTING UPPER RESISTANCE AND THEN BACK TO DOWNTREND

HOW I SAVED MY MONEYTHERE WAS RESISTANCE ,
AS SIMPLE AS IT SOUNDS
.
YES , I DONT USE ROCKET SCIENCE TO MAKE MONEY

Indusind Bank - Bullish breakoutNote: This is for educational purpose only.
There seems to be a channel & descending triangle bullish breakout with volume. Moreover, there is a trend line breakout in RSI as well.
Entry Price: ₹590
SL: ₹535

INDUSINDBK | INDUSINDBANKHi, This tweet for educational purpose not buy sell call... Let's INDUSIND BANK complete C&H pattern OR not.

IndusInd BankIndusInd bank is moving in channel since April. Trade from bottom of channel can be taken to top of channel.
Marked buy zone, target and stop loss.
This is not a trading advise or endorsement, only an educational idea. Consult your investment manager or do your risk assessment before entering any financial position.

INDUSIND BANK CHART ANALYSISTHIS CHART GIVES YOU KNOWLEDGE ABOUT INDUSIND BANK CHART ANALYSIS WITH SUPPORT AND RESISTANCE

NIFTY BANK LOOKING FOR UPSIDE FIRE FOR RANGE 25700-26000-26600NIFTY BANK, As we have seen that it has not made much upside compared to nifty 50
Current scenario says that Nifty Bank can go more upside in which hdfcbank and indusind bank also looking bullishness for short term basis.
BANKNIFTY TRADING WITH BREAKOUT ITS RESISTANCE
BREAKOUT @23650
UPSIDE ZONE AFTER RETRACEMENT -- 25700-26600
NOW SUPPORT ZONE @ 23750
15 TRADING DAYS EXPECTED TIME
{VIEWS ARE ONLY FOR EDUCATIONAL PURPOSE.}

HDFCBANK LOOKING FOR UPSIDE 1200 LEVELS TO TOUCHHDFC BANK, As have seen that Nifty has made good upside campared to Nifty Bank,
But in coming days Nifty bank looks good bullishness for upside Zone in which Hdfcbank and Indusind bank looks good for upside.
HDFCBANK--HOLD VIEW
LOOKS LIKE TRADING IN CHANNEL PATTERN
CMP @1114
GOING FORWARD FOR 1200 LEVELS
DOWNSIDE SUPPORT @1080
SHORT TERM 7 TRADING DAYS
UPSIDE RESISTANCE @1200
{VIEWS ARE ONLY FOR EDUCATIONAL PURPOSE.}

