IndusInd Bank forming Flag and Pole pattern.Indusind Bank is consolidating in a range after a good rally forming a flag and pole pattern on the weekly charts.
The stock has formed a dragon fly doji and is trading in 5% range for last 40 days which predicts that there will be a nice break out or break down.
It has been trading around the 20 ema on the daily charts and in the last session given a 2% bullish move closing above the moving average.
The stock is holding the recent high and is consolidating around it while the other banking stocks have given a retracement after forming new recent highs.
Previously, the stock has given a nice rally of 13% after the break out. The stock looks in the bullish mode, if the stock gives a break out, cash positions can be carried and hedged future call of current expiry can be carried.
Target :- 1550, 1665
Entry :- After the break out of 1440 levels.
Stop loss :- Close below the previous hourly consolidation.
Watch for the weekly close above the consolidation zone and if the stock gives a close above it in the daily chart, position can be entered with a small Stop loss.
Wait for the price action near the levels before entering the market.
INDUSINDBK

Indusind bank is showing some signs of upmove MACD crossover. RSI crossover, trendline breakout..good to study and add to ur track list

INDUSIND BANK - 70% RETURNS!!!BUY - INDUSIND BANK LTD
CMP - Rs. 1248
Target - 1: Rs. 1580
Target - 2: Rs. 1870
Target - 3: Rs. 2150
.
.
Technicals - Cup and Handle Pattern BO
.
This is just a view by an expert analyst, please invest at your own risk.
.
Follow me for more!

30 Jun '23 Post Mortem on BankNiftyComparing with N50, banknifty did close the gap-up opening. Looking at the opening minutes I felt BN had more inclination to fall into the trading range of the previous day, but the way in which NiftyIT was surging - BN would have changed the mind to play along.
BN also hit a new all time high of 44787.1 today, but the thrust to go up was not as convincing as N50. HDFC-HDFCBK may be the primary reason that these indices has got a new-found passion to outperform. Well we had 2 news flow in IndusInd and Federal Bank which helped it jump more than 3%.
The one aspect in today's price action was the helplessness of the bears, they tried to bring down BN on 2 occasions but did not get enough crowd support.
The good news that came in was "Indian banks' gross bad loans fall to a 10-year low of 3.9%: RBI's Financial Stability Report".
One news which looked scary was "Bank of America nurses $100bn paper loss after big bet in bond market". I am not sure if the SPX & SPF has priced this in.
Something is not adding up, either the US FED rates are too high or the Indian RBI rates are not high enough. We have dichotomy in the financial sector - India vs US.
1hr TF
BN has 2 islands vs 3 for N50. The new support level is now 44443 below which we can expect some range-bound trade. As it stands situation is very favorable for the bulls to continue the dream run.

INDUSIND BANKAm I Seeing it correctly ? It is showing good breakout in monthly chart and closing is also there. Keep in watch list


INDUSINDBK bullish flag intradayINDUSINDBK formed a bullish flag pattern in intraday. if it breaks 1135 level it can reach 1183.

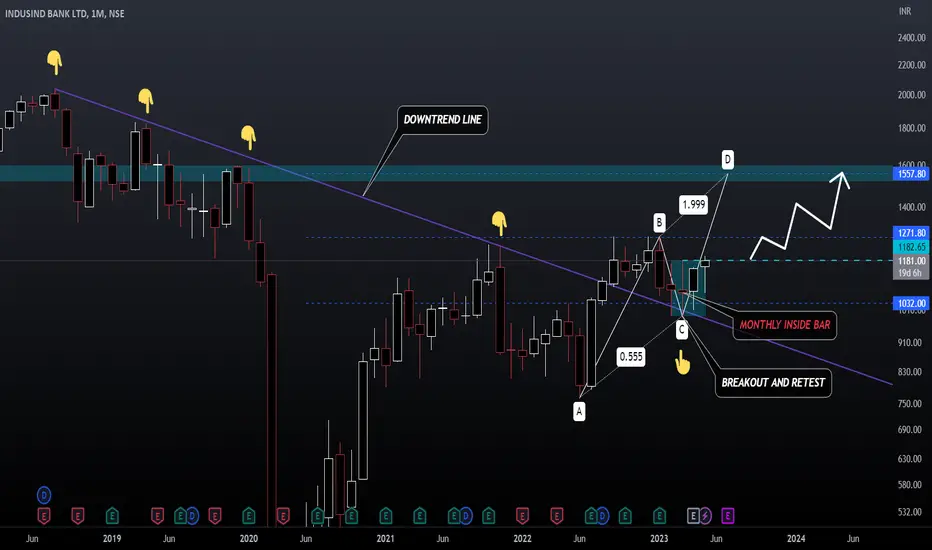
INDUSIND BANK INDUSIND BANK has broken out of its 5 year old downtrend line showing big buyers coming in the stock , retest of support is also done and the stock has formed a good inside bar candle in monthly time frame . Any breakout above the inside bar candle range will be a confirmation of upcoming rally in the stock , ie levels of 1180 , one can go long above this range if a weekly candle closes above it for targets of 1500 levels in medium to long term
INDUSINDBK breakout double top (M)INDUSINDBK looks like breaking the double top (M) pattern.
Sell below 1055 SL 1067 targets 1037, 1021,1003

INDUSINDBK Ready for breakoutIndusind bank is about to break trend line in daily/weekly chart. Can expect 20% up movement in upcoming days.
This is for education purpose only not recommended to buy/sell.

Trendline Breakout in Indusind Bank Limited...Chart is self explanatory.
Disclaimer: This is for demonstration and educational purpose only. This is not buying or selling recommendations. I am not SEBI registered. Please consult your financial advisor before taking any trade.

Indus Ind Bank on support levelsIndus Bank is at a good level. We can start accumulating the stock from here. The stock is at a discounted price.
The fundamentals are good for the bank.
The market has shown good strength today. Tomorrow can be a little jittery but stay strong.


indusind-bank long\short idea the reason why i am recommending you guys this stock is because when last time it reached this level i went for a long position that gave me a good 1:4 R:R target so i am hoping it"ll repeat it again or we can short it below the support level

IndusInd bank out of the consolidation zone.Indusind Bank has given a break out of the consolidation and crossed the 20 ema on the daily time frame.
The stock has been in consolidation from october and gave a nice break out in the end of november.
The stock can be traded once there is retest of the level and the stock can give nice up side targets.
3 points confirmation.
1. Break out of the consolidation zone.
2. Crossed daily 20 ema and closed above it.
3. The volumes are higher than the previous day.
The stock option and stock can be traded once the stock retest 1160 levels.
Traget:- 1229, 1265
Stop loss :- 1150
The stock can be traded for intraday once it crosses above 1173 and can give a intraday target of 1200.
Wait for the price action and enter once the stock gives a close above the levels.

Chart of the Week: Indusind BankIndusind Bank is in downtrend and is due for breakout. The breakour level can be below 1122. Expected Targets mentioned on the chart.

Indusind BankAccumulation or Distribution phase going on
Mostly Accumulation I think, Keep it under your radar for a beneficial move.
Thank you !

INDUSINDBKNSE:INDUSINDBK
Note :
1.One Can Go long with a Strict SL below the Trendline or Swing Low of Daily Candle.
2. Close, should be good and Clean.
3. R:R ratio should be 1 :2 minimum
4. Plan as per your RISK appetite
Disclaimer : You are responsible for your Profits and loss, Shared for Educational purpose!

Indusind bank analysisThe market is in Consolidation mode... Took a reaction from 52 Week's High.
Very important Trendline, If it breaks with a Big candle then we will witness a huge fall.
OI & Volume are to have to be considered.

Breakout in Indusind bank Indusind banks results are way better than you think
Looking good above 1240 with a target of 1588
You can put stop loss of 1090
Results and chart both looking good

breakout found in @indusind_banka monthly breakout found in indusindbank . buy above 1245 to 1250 and 1st and 2nd target is given on chart.

INDUSINDBK (M)INDUSINDBK (M) is in an uptrend (ascending channel).
An ascending channel is the price action contained between upward sloping parallel lines. Higher highs and higher lows characterise this price pattern. Technical analysts construct an ascending channel by drawing a lower trend line that connects the swing lows and an upper channel line that joins the swing highs.
1) An ascending channel is used in technical analysis to show an uptrend in a security’s price.
2) It is made up of two positive sloping trend lines drawn above and below a price series depicting resistance and support levels.
3) Channels are used commonly in technical analysis to confirm trends and identify breakouts and reversals.
After a COVID FALL, INDUSINDBK is facing a resistance trend line which INDUSINDBK broke on the start of August. If INDUSINDBK breaks and sustains above 1250, then 1500, 2000, and 3000 will easily come in future uptrend months.

IndusInd Bank: Weekly chart looks lucrative Note: Weekly Chart:
- Rounding Bottom formation completed with 11 months time horizon (blue arch)
- Convincingly above long term (3 yrs) downtrend line. (blue solid line)
- Cum. Vol delta is positive and in uptrend for last few weeks (below plot)
- In a fresh motive Wave-1 in Elliot Wave since July (purple).
With a SL of 1150, one can long.
For safe trader can create a Bull Call (debit) spread with 1200 CE Buy and 1400 CE Sell (preferably Oct'22 expiry) as it's weekly chart.
