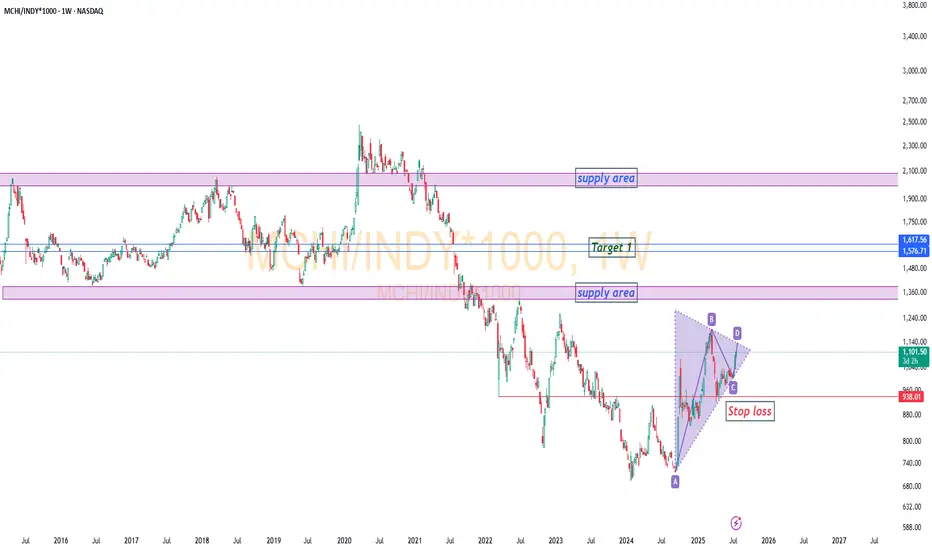
MCHI / IndyRelative Comparison Analysis: MCHI vs. INDY (CMP: 1084)
On the weekly chart, MCHI appears poised to outperform INDY if it sustains above the 1130–1230 zone. The 1330–1390 region may act as an initial supply zone.
Target 1: 1582–1617
(Estimated timeline: ~1 year or more)
Target 2 / Next Supply Zone: 2000–2080
A breakout above the supply zone (1330–1390) could materialize within the next 8 months if momentum builds.
Suggested Stop Loss: 940 (on a weekly closing basis)
This analysis is based on relative strength trends and supply-demand dynamics visible on the long-term chart.
INDY
INDY/EEM Reaching All Time HighsINDY/EEM relative strength chart is reaching its all time high since the introduction of INDY ETF in Nov' 2009.
Background info: INDY is the Nifty 50 ETF trading on NASDAQ which mimics the Nifty 50 index.
EEM is the MSCI Emerging Markets ETF which invests funds in emerging markets such as China, India, Hong Kong, South Korea, South-east Asia etc.
INDY has been rising sharply against EEM thanks to a) Nifty breaching all-time highs and b) Chinese stocks being beaten due to Chinese regulations against their ed-tech companies last month.
Will the INDY/EEM break out from its all time highs or will this resistance lead to a drag in the INDY vis-a-vis the EEM as it did in 2019? We will be watching the price action.

