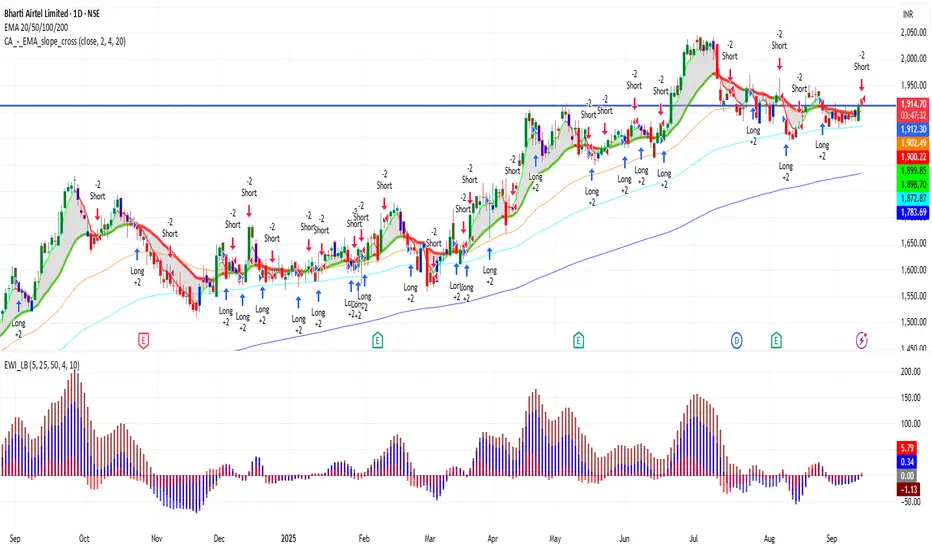
BHARTIARTL 1D Time frame🔢 Current Level
Trading around ₹1,912.00 - ₹1,914.30
🔑 Key Resistance & Support Levels
Resistance Zones:
₹1,925 – ₹1,930 (recent highs; breakout above this may lead to further upside)
₹1,950 (psychological resistance)
₹2,000 (stronger resistance above)
Support Zones:
₹1,900 – ₹1,905 (immediate support; failure to hold above this may lead to a decline)
₹1,880 (short-term support; a break below this could indicate weakness)
₹1,850 – ₹1,860 (deeper support zone if price dips further)
📉 Outlook
Bullish Scenario: If Bharti Airtel holds above ₹1,905, upward momentum may continue. Break above ₹1,930 can open the way toward ₹1,950+.
Bearish Scenario: If it falls below ₹1,880, risk increases toward ₹1,850 – ₹1,860.
Neutral / Range: Between ₹1,905 – ₹1,930, Bharti Airtel may consolidate before a directional move.
Infosys
HDFCBANK 1D Time frame🔢 Current Level
Trading around ₹966 – ₹968
🔑 Key Resistance & Support Levels
Resistance Zones:
₹970 – ₹975 (near-term resistance; breakout above this may lead to further upside)
₹980 (psychological resistance)
₹1,000 (stronger resistance above)
Support Zones:
₹960 – ₹962 (immediate support; failure to hold above this may lead to a decline)
₹950 (short-term support; a break below this could indicate weakness)
₹940 – ₹945 (deeper support zone if price dips further)
📉 Outlook
Bullish Scenario: If HDFCBANK holds above ₹962, upward momentum may continue. Break above ₹975 can open the way toward ₹980+.
Bearish Scenario: If it falls below ₹950, risk increases toward ₹940 – ₹945.
Neutral / Range: Between ₹962 – ₹975, HDFCBANK may consolidate before a directional move.

SBIN 1D Time frame🔢 Current Level
Trading around ₹823.65 - ₹825.00
🔑 Key Resistance & Support Levels
Resistance Zones:
₹824 – ₹826 (recent highs; breakout above this may lead to further upside)
₹830 (psychological resistance)
₹840 – ₹850 (stronger resistance above)
Support Zones:
₹820 – ₹822 (immediate support; failure to hold above this may lead to a decline)
₹810 (short-term support; a break below this could indicate weakness)
₹800 – ₹805 (deeper support zone if price dips further)
📉 Outlook
Bullish Scenario: If SBIN holds above ₹822, upward momentum may continue. Break above ₹826 can open the way toward ₹830+.
Bearish Scenario: If it falls below ₹810, risk increases toward ₹800 – ₹805.
Neutral / Range: Between ₹822 – ₹826, SBIN may consolidate before a directional move.

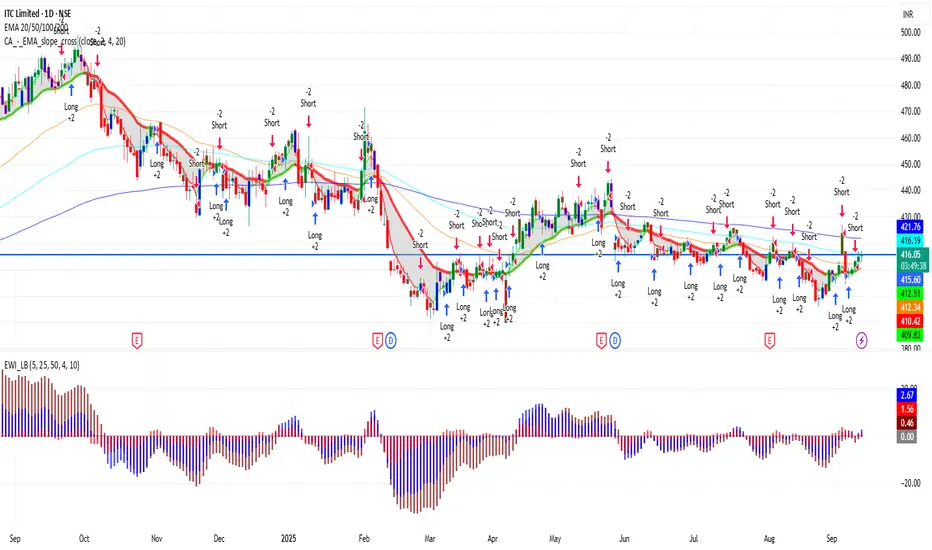
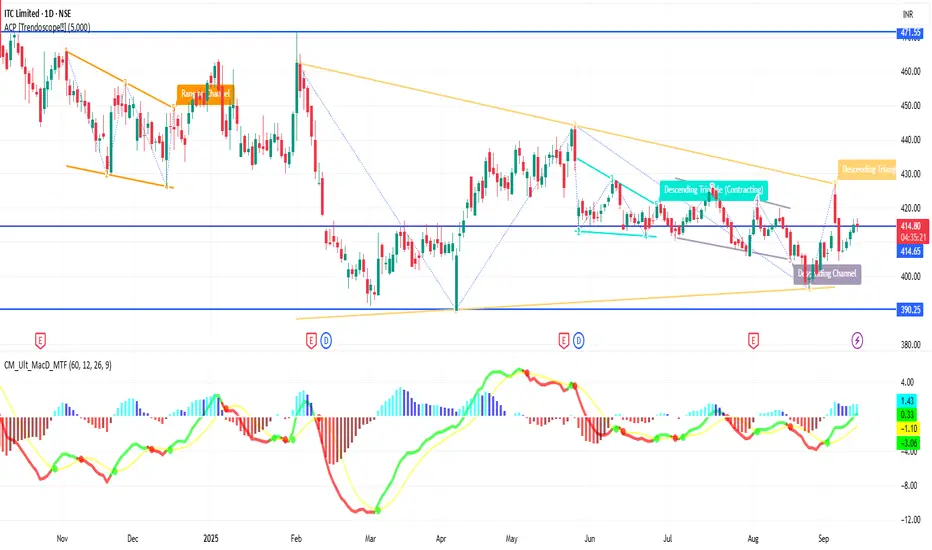
ITC 1D Time frame🔢 Current Level
ITC is trading around ₹413 – ₹416
🔑 Key Resistance & Support Levels
Resistance Zones:
₹416 – ₹421 (near-term resistance; breakout above this may lead to further upside)
₹420 (psychological resistance)
₹428 (stronger resistance above)
Support Zones:
₹412 – ₹413 (immediate support)
₹410 (short-term support; break below may indicate weakness)
₹398 – ₹400 (deeper support zone)
📉 Outlook
Bullish Scenario: If ITC holds above ₹412 – ₹413, upward momentum may continue. Break above ₹417 – ₹420 can open the way toward ₹428+.
Bearish Scenario: If it falls below ₹410, risk increases toward ₹398 – ₹400.
Neutral / Range: Between ₹412 – ₹417, ITC may consolidate before a directional move.
TVSMOTOR 1D Time frame🔢 Current Level
Trading around ₹3,525 – ₹3,530
🔑 Key Resistance & Support Levels
Resistance Zones:
₹3,550 – ₹3,560: Near-term resistance; breakout above this may lead to further upside.
₹3,600: Stronger resistance above.
Support Zones:
₹3,500 – ₹3,510: Immediate support; failure to hold above this may lead to a decline.
₹3,450: Short-term support; a break below this could indicate weakness.
₹3,400: Deeper support zone if price dips further.
📉 Outlook
Bullish Scenario: If TVS Motor holds above ₹3,510, upward momentum may continue. Break above ₹3,560 can open the way toward ₹3,600+.
Bearish Scenario: A drop below ₹3,450 may signal further downside potential.
Neutral Zone: Between ₹3,510 and ₹3,560, TVS Motor may consolidate before a directional move.

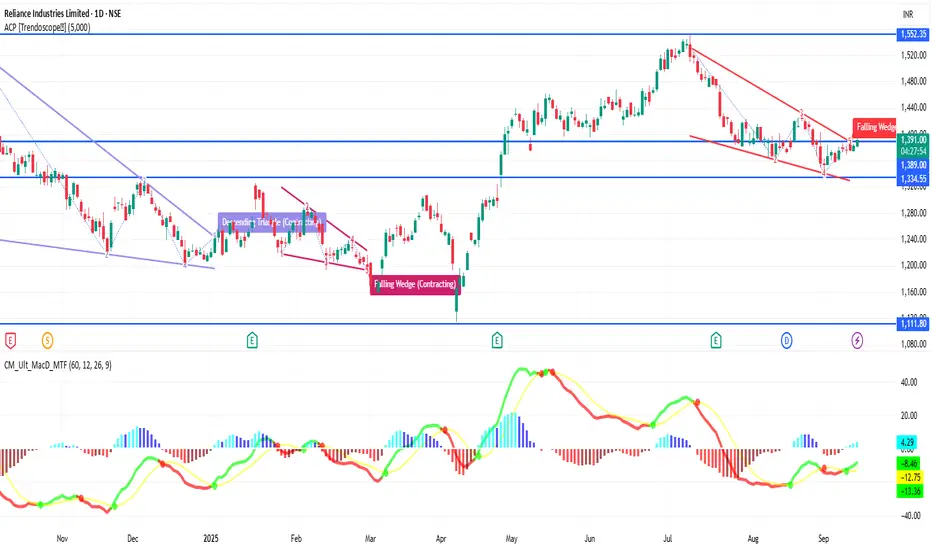
RELIANCE 1D Time frame🔢 Current Level
RELIANCE is trading around ₹1,391 – ₹1,392
🔑 Key Resistance & Support Levels
Resistance Zones:
₹1,392 – ₹1,396 (near-term resistance; breakout above this may lead to further upside)
₹1,400 (psychological resistance)
₹1,427 (stronger resistance above)
Support Zones:
₹1,380 – ₹1,385 (immediate support)
₹1,370 (short-term support; break below may indicate weakness)
₹1,350 (deeper support zone if selling pressure continues)
📉 Outlook
Bullish Scenario: If RELIANCE holds above ₹1,385, upward momentum may continue. Break above ₹1,396 can open the way toward ₹1,400+.
Bearish Scenario: If it falls below ₹1,370, risk increases toward ₹1,350.
Neutral / Range: Between ₹1,385 – ₹1,396, RELIANCE may consolidate before a directional move.
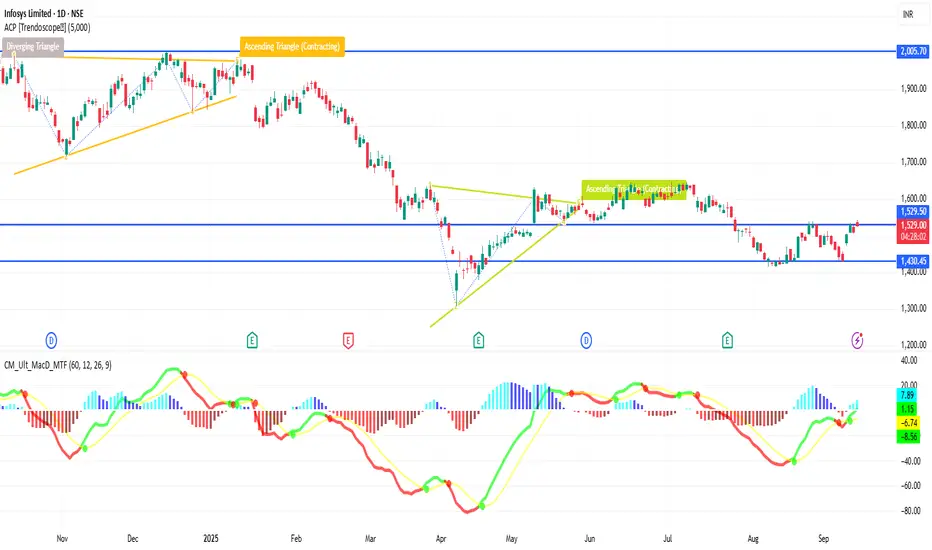
INFY 1D Time frame🔢 Current Level
INFY is trading around ₹1,510 – ₹1,529
🔑 Key Resistance & Support Levels
Resistance Zones:
₹1,518 – ₹1,520 (near-term resistance; breakout above this may lead to further upside)
₹1,530 (stronger resistance above)
Support Zones:
₹1,484 – ₹1,485 (immediate support)
₹1,481 (stronger support if price dips further)
₹1,470 – ₹1,472 (deeper support zone)
📉 Outlook
Bullish Scenario: If INFY holds above ₹1,485, upward momentum may continue.
Breakout Scenario: A move above ₹1,520 can open the way toward ₹1,530+.
Bearish Scenario: If it falls below ₹1,481, risk increases toward ₹1,470 – ₹1,472.
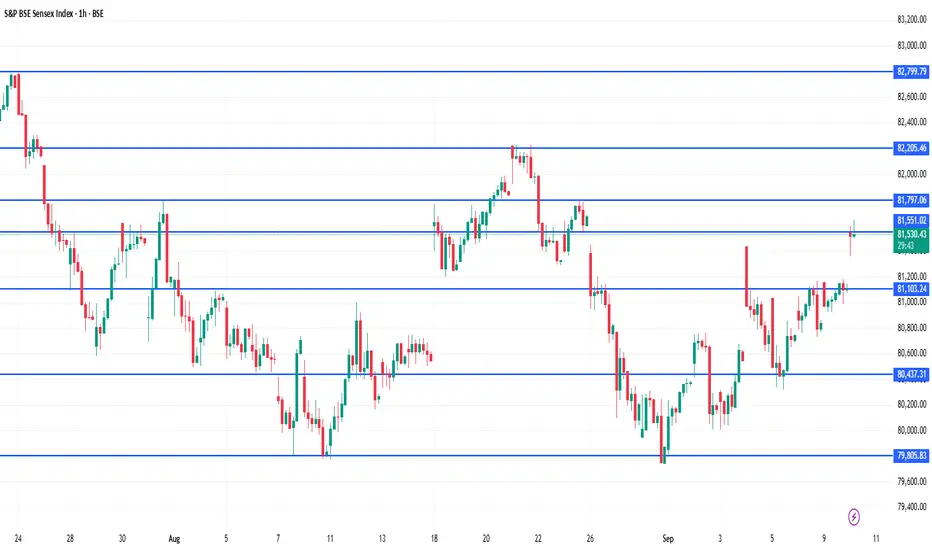
SENSEX 1D Time frame🔢 Current Level
Sensex is around ₹81,800 – ₹81,818
🔑 Key Resistance & Support Levels
Resistance Zones
~ ₹81,900 – ₹82,200 (recent highs / selling pressure zone)
~ ₹82,500 (stronger resistance above)
Support Zones
~ ₹81,300 – ₹81,400 (immediate support)
~ ₹81,100 (stronger support if price dips further)
~ ₹80,800 – ₹80,900 (deeper support zone)
📉 Outlook
If Sensex holds above ~ ₹81,400, bullish scenario remains alive.
Break above ~ ₹82,200 can open upside toward ~ ₹82,500+.
If it loses ~ ₹81,300, then downward risk increases, possibly toward ~ ₹81,100 or lower.

BANKNIFTY 1D Time frame📊 Current Snapshot
Current level: around 54,680 - 54,690
Today’s range: approx. 54,580 – 54,850
🔑 Key Daily Levels
Resistance Zones
54,960 (near-term resistance)
55,172 (major resistance; breakout above this could extend rally)
55,000 (psychological resistance)
Support Zones
54,462 (immediate support)
54,400 – 54,500 (important support band)
54,107 (deeper support if selling pressure continues)
📉 Outlook
Bullish Case: If Bank Nifty sustains above 54,960 – 55,172, it can move higher towards 55,300 – 55,500.
Bearish Case: If it breaks below 54,400, the index may slip toward 54,100 or even lower.
Neutral / Range: Between 54,400 – 54,960, sideways movement is likely until a breakout occurs.

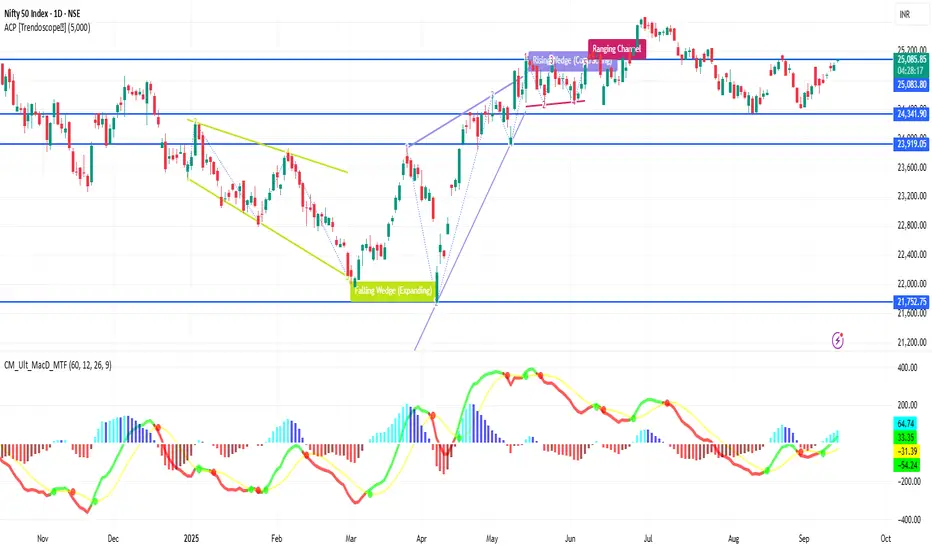
NIFTY 1D Time frame📊 Current Data
Current trading level: around 25,076 – 25,091
Today’s range: approx. 25,038 – 25,095
52-week range: 21,743 – 26,277
🔑 Key Daily Levels
Resistance Zones
25,090 (near-term resistance just above current trading)
25,153 (recent swing high, major resistance level)
Support Zones
24,994 – 24,950 (immediate support range)
24,800 (strong support zone; crucial for trend continuation)
📉 Trend View
Bullish Case: If NIFTY sustains above 25,090 and breaks 25,153, it could push higher towards 25,200+.
Bearish Case: If it fails to hold 24,950–24,994 and slips below 24,800, downside momentum could strengthen.
Neutral Zone: Between 25,000 – 25,050, NIFTY may consolidate before deciding direction.
ITC 1D Time frame🔢 Current Level
Trading around ₹414 – ₹432
🔑 Key Resistance & Support Levels
Resistance Zones:
₹435 – ₹438 (near-term resistance; breakout above this may lead to further upside)
₹442 (stronger resistance above)
Support Zones:
₹425 – ₹428 (immediate support)
₹420 (stronger support if price dips further)
₹415 – ₹417 (deeper support zone)
📉 Outlook
Bullish Scenario: If ITC holds above ₹428, upward momentum may continue. Break above ₹438 can open the way toward ₹442+.
Bearish Scenario: If it falls below ₹420, risk increases toward ₹415 – ₹417.
Neutral / Range: Between ₹428 – ₹438, ITC may consolidate before a directional move.
HDFCBANK 1D Time frame🔢 Current Level
Trading around ₹964.55 - ₹967.80
🔑 Key Resistance & Support Levels
Resistance Zones:
₹970 – ₹975 (near-term resistance; breakout above this may lead to further upside)
₹980 (psychological resistance)
₹1,000 (stronger resistance above)
Support Zones:
₹960 – ₹965 (immediate support)
₹950 (stronger support if price dips further)
₹940 – ₹945 (deeper support zone)
📉 Outlook
Bullish Scenario: If HDFCBANK holds above ₹965, upward momentum may continue. Break above ₹975 can open the way toward ₹980+.
Bearish Scenario: If it falls below ₹950, risk increases toward ₹940 – ₹945.
Neutral / Range: Between ₹965 – ₹975, HDFCBANK may consolidate before a directional move.

HDFCBANK 1D Time frame📍 Current Price Action
Current Price: ~₹968
Day Range: ₹960 – ₹975
Trend: Neutral to mildly bullish
⚙ Technical Indicators
RSI (14): ~53 → neutral momentum
MACD: Slightly positive → mild upside bias
ADX (14): ~32 → moderate trend strength
MFI (Money Flow Index): Mid-range → balanced buying/selling pressure
📊 Moving Averages
Short-term (5, 10, 20-day): Price trading above → bullish signals
Medium to Long-term (100, 200-day): Mixed to weak → acting as resistance
📉 Support & Resistance
Immediate Support: ₹960 – ₹965
Next Support Zone: ₹940 – ₹950
Immediate Resistance: ₹970 – ₹975
Next Resistance: ₹985 – ₹990
🧠 Summary
HDFC Bank is in a neutral to mildly bullish zone on the daily chart. Price is holding above short-term averages, but longer-term averages are acting as resistance. If the stock sustains above ₹975, it may move toward ₹985–₹990. Failure to hold ₹960 could drag it toward ₹940–₹950.

TATACONSUM 1D Time frame📍 Current Price Action
Current Price: ~₹1,105
Day Change: +0.3% approx
52-Week Range: ₹882 – ₹1,234
⚙ Technical Indicators
RSI (14): ~62-65 → bullish momentum
MACD: Positive → upside bias intact
ADX (14): Above 50 → strong trend strength
Stochastic / Williams %R: In overbought zone → short-term pullback risk
📊 Moving Averages
Short-term (5, 10-day): Bullish, price trading above
Medium-term (20, 50-day): Bullish, trend supportive
Long-term (100, 200-day): Bullish, strong structure
📉 Support & Resistance
Immediate Support: ₹1,080 – ₹1,090
Next Support Zone: ₹1,060 – ₹1,030
Immediate Resistance: ₹1,115 – ₹1,125
Major Resistance (52-week high): ₹1,230+
🧠 Summary
Tata Consumer is bullish on the daily chart. Indicators and moving averages show strong momentum, though overbought signals suggest chances of consolidation or mild pullback. Holding above ₹1,080 keeps the uptrend intact. A breakout above ₹1,125 can open the way toward ₹1,230+.

ITC 1D Time frame📍 Current Price Action
Current price around ₹415
Day’s range: ~ ₹412 – ₹417
52-week range: ~ ₹390 – ₹528
⚙ Technical Indicators
RSI (14): ~65 → bullish momentum, nearing higher strength
MACD: Positive → supports upside bias
ADX (14): High (≈ 60-65) → strong trend strength
Stochastic / Williams %R: Showing overbought signals → risk of short-term pullback or consolidation
📊 Moving Averages & Trend Structure
Short/medium/long-term moving averages (10, 20, 50, 100, 200 day) largely give buy signals
The 5-day MA is slightly below current price → short-term pullback potential
🔧 Support & Resistance Levels
Immediate Support: ~ ₹410
Next Support Zone: ~ ₹405 – ₹400
Immediate Resistance / Pivot Territory: ~ ₹416 – ₹417
Higher Resistance: ~ ₹420 – ₹422 (if the current resistance is cleared)
🧠 Summary
ITC is in a bullish trend on the daily chart with strong momentum and multiple indicators supporting upward move. But since some overbought signals are showing up, there’s a chance for a pullback or consolidation near resistance. Key to watch: holding above ₹410 keeps the bullish bias. Breaking above ~₹416-417 convincingly could open up room toward ~₹420+. If price falls below support near ₹405-410, downside risk increases.

MARUTI 1D Time frame📍 Current Price Action
Last traded price: ~₹ 15,096
Minimal intraday change (~0.1%, slightly up)
⚙ Technical Indicators
RSI (14): ~72 → strong uptrend / overbought conditions
Stochastic RSI: Low / showing weakness → possible cooling off
CCI (14): ~92 → uptrend strength
MFI (Money Flow Index): ~84 → strong buying pressure
📊 Moving Averages & Trend Strength
Price is above 50-day and 200-day SMAs & EMAs → long-term trend is bullish
20-day SMA/EMA are more neutral-to-slightly bullish
All major moving averages are broadly supporting upwards bias
🔧 Support & Resistance / Pivot Zones
Support Levels: ~₹ 14,900 – ₹ 15,000
Resistance Levels / Pivot: ~₹ 15,300 – ₹ 15,500
🧠 Summary
Maruti is in a strong uptrend on the daily chart. Overbought indicators like RSI and MFI suggest buying strength is high, which also means risk of a short-term pullback or consolidation. Key support ~₹ 15,000 needs to hold for bulls. If price clears resistance near ₹ 15,300-15,500 convincingly, upward move likely to continue.

INFY 1D Time frame📍 Current Price Action
Current Price: ~₹1,509
Day Change: about –1.5%
Daily Range: ₹1,500 – ₹1,515
⚙ Technical Indicators
RSI (14): ~57–60 → neutral to mildly bullish momentum
MACD: Positive → signals upward bias
Stochastic Oscillator: Near oversold zone → indicates possible bounce
ADX (14): ~26 → moderate trend strength
Money Flow Index (MFI): Mid-range → no extreme buying/selling pressure
📊 Moving Averages
Short-term (5, 10-day): Price trading slightly below → short-term weakness
Medium to Long-term (50, 100, 200-day): Price still above → long-term structure supportive
📉 Support & Resistance
Immediate Support: ~₹1,500
Next Support: ~₹1,480 – ₹1,470
Immediate Resistance: ~₹1,512 – ₹1,515
Breakout Target (if above resistance): ~₹1,530 – ₹1,540
🧠 Summary
INFY is neutral to mildly bullish on the daily chart. Support at ₹1,500 is crucial — holding above it keeps momentum intact. If the stock breaks above ₹1,515, it can push toward ₹1,530–1,540. On the downside, breaking below ₹1,500 may invite weakness toward ₹1,480–1,470.

SENSEX 1D Time frame📍 Current Price Action
Current Level: 81,548
Day’s Range: ~80,320 – 81,550
52-Week Range: 71,425 – 85,978
⚙ Technical Indicators
RSI (14): Around 43 → neutral to slightly bearish zone
MACD: Negative → mild downward pressure still visible
ADX (14): ~35-40 → moderate trend strength
Stochastic Oscillator: Near overbought zone → possible short-term pullback
Moving Averages:
Short-term (5, 10, 20-day): Mixed
Medium & long-term (50, 100, 200-day): Acting as resistance near highs
📊 Key Levels
Immediate Support: 80,800 – 81,000 zone
Immediate Resistance: 81,600 – 81,800 zone
Breakout Levels:
Above 81,800 → upside momentum could target 82,200+
Below 80,800 → downside may test 80,300 – 80,000
🧠 Summary
Sensex is currently at 81,548, near its resistance zone. Trend is neutral to mildly bullish in the short-term. Sustaining above 81,600–81,800 will confirm strength for further rally. A failure to hold could trigger a pullback toward 80,800–80,300.

BTCUSD 1D Time frame📈 Price Action
Previous Close: $113,897.00
Day’s Range: $112,204.00 – $114,451.00
Current Price: $113,897.00
🔧 Technical Indicators
Relative Strength Index (14): 55.39 — Indicates neutral momentum.
MACD: Positive — Suggests upward trend.
Moving Averages:
5-day MA: $112,545.50
20-day MA: $112,519.63
50-day MA: $114,828.28
100-day MA: $109,519.30
200-day MA: $101,144.13
Stochastic Oscillator (14): 67.91% — Indicates bullish momentum.
Average True Range (ATR): $3,177.03 — Suggests moderate volatility.
Directional Movement Index (ADX): 10.23 — Indicates a weak trend.
📊 Support & Resistance Levels
Immediate Support: $112,000
Immediate Resistance: $115,000
🧠 Trend Analysis
Trend: Neutral to bullish
Momentum: Positive
Volatility: Moderate
Summary: Bitcoin is currently trading near $113,897, showing a neutral to bullish trend with positive momentum. The 50-day moving average is above the current price, indicating potential upward movement. Traders should monitor the support level at $112,000 and resistance at $115,000 for potential breakout opportunities.

WIPRO 1D Time framw📈 Price Action
Previous Close: ₹255.75
Today's Close: ₹256.50
Daily Range: ₹253.00 – ₹257.00
Volume: 804,499 shares (significantly higher than the 50-day average of 369,496 shares)
52-Week Range: ₹228.00 – ₹324.55
🔧 Technical Indicators
Relative Strength Index (RSI): 63.59 — Indicates bullish momentum.
MACD: Positive — Suggests upward trend.
Moving Averages:
5-day MA: ₹254.50
50-day MA: ₹249.00
200-day MA: ₹265.00
Trend: Bullish, as the stock is trading above short-term moving averages.
Stochastic Oscillator: 76.47% — Indicates overbought conditions, suggesting potential for a pullback.
Average True Range (ATR): ₹0.05 — Indicates low volatility.
📊 Support & Resistance Levels
Immediate Support: ₹253.00
Immediate Resistance: ₹257.00
Pivot Point: ₹255.00
🧠 Trend Analysis
Trend: Bullish
Momentum: Positive
Volatility: Low
Summary: Wipro's stock is exhibiting a bullish trend with positive momentum. The current overbought condition, as indicated by the stochastic oscillator, suggests that the stock may experience a short-term pullback before continuing its upward trajectory. Traders should monitor the support and resistance levels for potential entry and exit points.

SUNPHARMA 1D Time frame📈 1-Day Price Action
current: ₹1,610.50
Open: ₹1,592.50
High: ₹1,614.00
Low: ₹1,592.50
Close: ₹1,611.10
Volume: 1.14 million shares
🔧 Technical Indicators
Relative Strength Index (14): 65.29 — indicates bullish momentum
MACD: 6.80 — suggests upward trend
Moving Averages: 5-day MA: ₹1,608.84, 50-day MA: ₹1,586.46, 200-day MA: ₹1,610.12 — all signaling a buy
Pivot Point: ₹1,610.10 — aligns with current trading level
📊 Trend & Levels
Trend: Bullish
Support: ₹1,600
Resistance: ₹1,620
🧠 Market Sentiment
Analysts maintain a positive outlook on Sun Pharma, with JM Financial retaining a "Buy" rating and a revised target price of ₹2,025, reflecting confidence in the stock's potential for appreciation over the next year.

SENSEX 1hour Time frame📍 Sensex – 1H Important Levels (Current)
🔹 Support Zones
74,200 – 74,300 → Immediate intraday support
73,800 – 73,900 → Stronger support zone
73,400 – 73,500 → Major support, breakdown may trigger further downside
🔹 Resistance Zones
74,800 – 74,900 → Immediate 1H resistance
75,200 – 75,300 → Strong resistance; breakout can fuel upside momentum
75,600 – 75,800 → Major resistance; sellers likely to appear here
⚖️ Quick Summary
Bias: Mildly bullish as long as Sensex trades above 74,200.
A breakout above 74,900 may target 75,200 – 75,800.
A breakdown below 73,800 may drag it towards 73,400.
Current range to monitor: 74,200 – 74,900.
INFY Bullish Setup** IF you like my observation, please boost and follow for more content."
Ticker: INFY
Time Frame: 1-Hour
Trade Type: Bullish
Entry Point: 1486.20
Target Price (TP): 1589.15
Stop Loss (SL): 1417.45
Risk-to-Reward Ratio (RRR): 1:1.5
Trade Setup and Rationale:
Market Context:
INFY has been showing signs of recovery, breaking out of a corrective phase. The price is currently positioned for a potential uptrend, supported by a significant bullish pattern forming on the chart.
Entry Point (1486.20):
The price has recently tested a support zone and is now showing signs of a strong reversal. The entry point is set just above this level, ensuring a confirmation of the bullish trend before committing to the trade.
Target Price (1589.15):
The target is set at a key resistance level where price is expected to face potential selling pressure. This level aligns with previous highs and is a reasonable place to lock in profits while riding the trend.
Stop Loss (1417.45):
The stop loss is placed just below the recent swing low, ensuring that the trade has a controlled risk. This placement minimizes the risk of getting stopped out in case of minor fluctuations while keeping the risk-to-reward ratio favorable.
Trade Logic:
The trade is supported by a bullish breakout pattern with increasing volume. After a period of consolidation, price action is showing signs of upward momentum, making this a high-probability trade setup.
The risk-to-reward ratio of 1:1.5 offers a balanced risk for the potential reward, providing a good trading opportunity with a well-placed stop loss.
Volume Confirmation:
Volume is showing a steady increase as the price starts moving upward, indicating that market participants are supporting the bullish move.
Trend Confirmation:
The trend is confirmed by the price breaking above previous resistance, and the bullish setup aligns with the market structure.
