Buy InfosysPlay for CUP & handle break and buy and add on dips.
Target of the pattern seen as around 1150 which is Buyback price.
INFY

INFY Expanding Wedge BreakoutINFY has been moving in an expanding wedge , currently on its edge, awaiting a reversal/breakdown.
Its finding support/resistance at every FIB level.

INFY Channel BreakoutINFY made a good leg up last week, reaching the top of the weekly channel awaiting a breakout/reversal, probably flag a bit before breaking.

INFY Dog BreakoutWoof! INFY is respecting neckline for a while. Made a big leg up after the result. Back on the back of the dog, awaiting the a breakout or reversal. Grrrrr!

INFY Upward ChannelIt was observed INFY was trading in the upward channel, so expecting to reverse from channel bottom.
Note that incase if INFY opens below Yesterday Low this setup will be invalid.
Trade details are in chart

INFY Channel BreakoutINFY is moving in a channel for a while, a nice Three drives pattern. Currently on the edge, awaiting a breakdown/reversal post results
Notice the steep fall on the last leg compared to previous ones.


Infy strategyInfy
Cmp 934
- Infosys record date for buying back shares has been set on 01 Nov 2017
- Buy back price Rs set at 1150 for each share
- Total amount set aside by Infy for buyback Rs 13000 Crore
- Amount set aside for retail category who are holding shares worth Rs 2 lakhs or less on record date - Rs 1950 Crore (15% of total amount)
- As on March 31st 2017, as per Co filings 2.87 Cr shares are with retail category
- The Co will buy back 1.69 Cr shares from retail category
- Expected acceptance ratio can be between 55-59%
Buy 200 shares at cmp
With results set to be announced tomorrow on 24 Oct 2017 one may consider
Buy Infosys 900 October Put option at cmp 3.8
This will protect any major reaction on the negative side if results are bad
-Tender shares in Buyback on 01 Nov 2017
- After confirmation of exact number of shares accepted in buyback, Sell remaining shares at Market price
- Expect profitability to be around 10-13%
Hope this helps
Take care
Happy & safe trading...!!!!


INFY - CUP N HANDLE (Bullish Breakout)It is been observed on the hourly chart that the price action is firstly forming a U shape Cup consolidation followed by a downward correction channel, Handle and now breaking above that zone which is indicating a bullish move ahead.
T1- 940
T2-960
SL- 900

INFY - Wait for it...Infy broke a strong support which was intact for a very long time and it was broken with good volumes. Don't know much about fundamentals but weakening dollar isn't helping it either. More downside is possible as long as it stays below the support line. Trend seems negative for the whole market as well. Hold your horses if you were thinking of buying INFY. I do not initiate a short here but will wait for right time to initiate long. If the market sentiment remains negative, the stock can come down to 700 - 730 range which will be a very good price to get in for long term investment.

Infy: Love affair with the stock continues....Infy CMP 899.50
In the previous post when Infy was at 878 we had mentioned that the stock is likely to bounce towards the zone of 930-960 zone.
Despite Infy offering Share buyback at 1150...
despite Infy seeing the return of respected Nandan Nilekani on the board...
we have seen price rejection in Infy stock price right in the zone (of 930-960) that charts were highlighting...!!! :-)
The stock may remain sideways for some time with down ward bias
Tc and safe trading...!!!


INFY- Right at support of up trending channel... let see gonna mINFY- Right at support of up trending channel... let see gonna make it or break it

infy - Harmonic possibilityIf Infy closes below 900 levels on monthly chart.
Then Probability of cypher pattern may unfold.

Infy: The Confluence ZonesNotes on the chart.
White pattern would fail above 993 and reddish below 969.
Its possible that the white pattern does not completes and the confirmation for that would be below 977. In that case only red pattern would be worth focusing. 970/975 would be the level to watch for buying opportunity.
If white pattern completes look for shorting opportunity near 990. If this plan works stock may test 970/975 range, here a bullish candle or pattern will trigger buy.
Feel free to comment or any query.
Trade Safe, stay healthy.
Hit Like if this information is useful.
Regards
Bravetotrade

Infy: Sell the FlagIn my previous post this downtrend was anticipated quite far back See >>
Currently price is in the middle of the range (1015-921) specified in the above post, which is also around 61.8% retracement. Expect some pullback from this zone. But this pullback should be weaker and so far it is weak. Watch for price action before shorting. Any impulse on the upside above the flag will nullify this trade.
Setup: Bear Flag
Entry: Let the flag pattern complete and break on the downside. The higher the price goes in the flag, the better.
Stop: As per risk appetite
Targets: 951 and lower..see chart.

INFOSYS Breakdown /ReversalINFY is on its centerline again. a reversal or breakdown zone.
Its been acting as a MID LINE for almost an year now, with priceaction above and below it in a sinewave.

Infosys : Right Now @ pretty Good Support !We never know whether the support is taken & infy revives to upside or not, only after it happens we will know that. But our trade plan is if at all the support breaks lets try short on Infy towards 930's

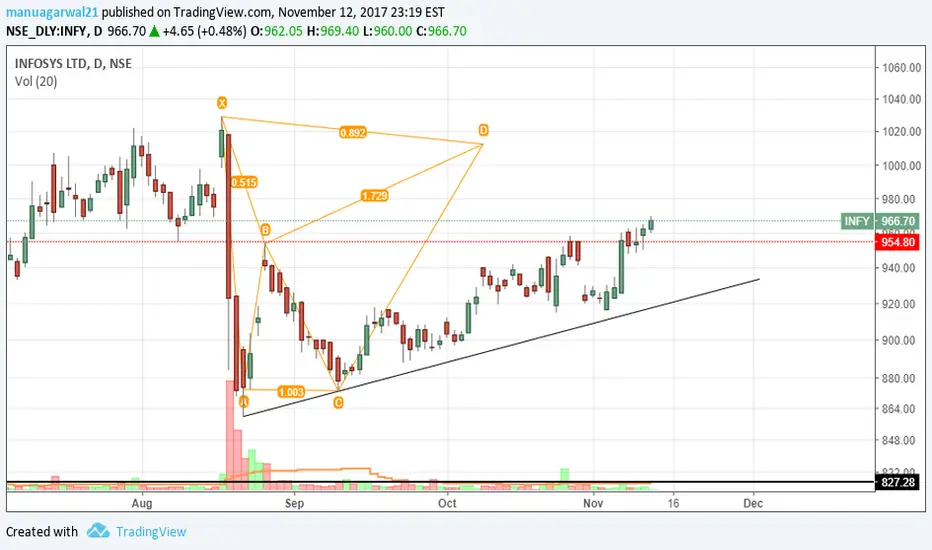
Infy: Playing the Golden RatiosHit like if you think this observation can be useful.
Trade safe, stay healthy.
Best Regards
Bravetotrade

