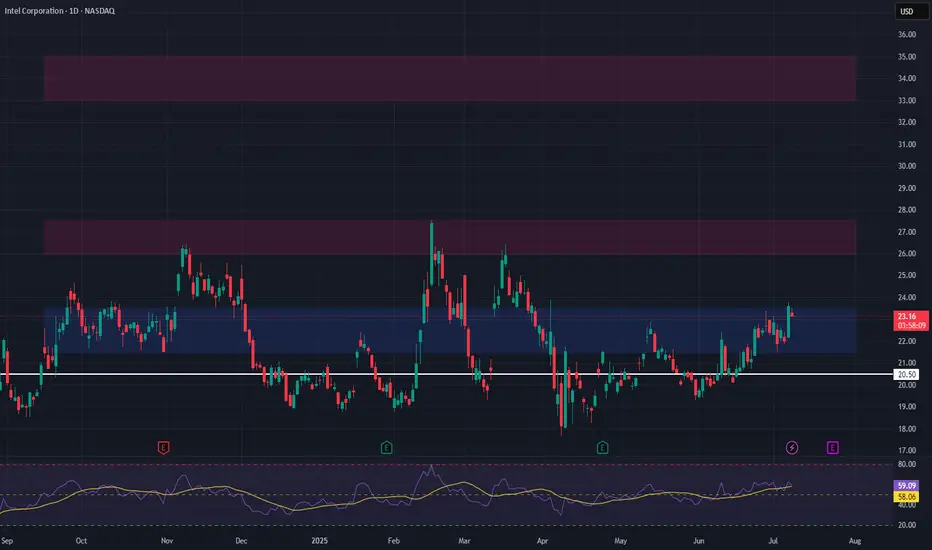
INTC Long Swing Setup – Break & Retest of Key ResistanceWe’re watching Intel NASDAQ:INTC for a clean break and retest of the $23.50 resistance level. A confirmed flip of this zone into support would signal trend strength and trigger a long spot entry.
📌 Trade Setup:
• Entry Zone: Around $23.50 (after confirmation as support)
• Take Profit Targets:
o 🥇 $26.00 – $27.50
o 🥈 $33.00 – $35.00
• Stop Loss: Daily close below $22.50
INTC
INTC #IntelIntel has been range boune between 20-70 which is very wide.
It may try to give bear a dead cat bounce only later it would be decided whether it may fall further of look for newer high. But time is bit far as 44$ is a supply area for bulls.


INTC Triple Top formation Weekly looks bearish and on lower time frames we can see a clear triple top formation
its a good opportunity for a short after resistance breakout
MACD & RSI showing a big divergence on the tops making lower highs instead

INTEL CORP buy setupINTC is a buy and we can observe multiple inverted head and shoulder patterns, though i have highlighted only the prominent one.
T1: 38
T2: 40
T3: 45
SL: 33
