BAJAJ_AUTO 1D Time frame📍 BAJAJ_AUTO – 1D Important Levels (Current)
🔹 Support Zones
9,050 – 9,100 → Immediate daily support
8,800 – 8,900 → Strong support; buyers likely to defend this zone
8,500 – 8,600 → Major support; breakdown here may shift trend bearish
🔹 Resistance Zones
9,300 – 9,400 → Immediate daily resistance
9,550 – 9,650 → Strong resistance zone; breakout may extend upside momentum
9,800 – 10,000 → Major psychological resistance; if crossed, bullish trend strengthens further
⚖️ Daily Trend Outlook
Bajaj Auto is in a bullish structure on the daily chart, forming higher lows.
As long as price stays above 9,050, the stock remains positive.
A breakout above 9,400 – 9,650 can take it towards 9,800 – 10,000.
A breakdown below 9,050 could drag it towards 8,900 – 8,600.
Intraday
TATAMOTOR 1H Tata Motors – 1 Hour Chart Analysis
🔹 Trend Overview
On the 1-hour chart, Tata Motors is currently showing bullish momentum with higher highs and higher lows.
However, price is also facing some resistance near the upper range, so intraday swings are possible.
🔹 Key Levels to Watch
Immediate Support Zone: around ₹706 – ₹709
Stronger Support: near ₹700
Immediate Resistance Zone: around ₹717 – ₹721
Major Resistance: around ₹734 – ₹735
🔹 Intraday Trading View
If price holds above ₹709, bulls may push towards ₹721 – ₹734.
If price slips below ₹706, a retest of ₹700 – ₹695 is possible.
Consolidation is likely in the ₹709 – ₹721 range before any major breakout.
🔹 Indicators (1-Hour Chart)
Moving Averages → Price trading above 20 EMA and 50 EMA, showing short-term strength.
RSI → Near the 60–65 zone, still bullish but close to overbought.
Volume → Slightly increasing on up-moves, showing buyers are active.
🔹 Summary
Bias: Bullish to range-bound
Support Levels: ₹706 / ₹700
Resistance Levels: ₹721 / ₹734
Intraday traders should watch the ₹709 – ₹721 band for breakout or breakdown trades.

XAUUSD 1H📍 XAUUSD – 1H Key Levels
🔹 Support Zones
$1925 – $1927 → Immediate intraday support
$1918 – $1920 → Stronger short-term support
$1910 – $1912 → Major support zone, breakdown could trigger deeper fall
🔹 Resistance Zones
$1935 – $1937 → First intraday resistance
$1945 – $1947 → Strong resistance area where sellers may re-enter
$1955 – $1960 → Major resistance; breakout above this can fuel a larger rally
⚖️ Quick Summary
Above $1935, bulls may push toward $1945 – $1960.
Below $1920, bears could drag price back to $1910 – $1900.
Range to monitor: $1920 – $1935 (decisive breakout will set next trend).
XAUUSD (Gold) – 1H Chart Analysis
🔹 Trend Overview
On the 1-hour chart, XAUUSD is currently showing short-term bullish bias but with nearby resistance.
Price action is making higher lows, but upside moves are facing supply zones.
🔹 Key Levels to Watch
Immediate Support Zone: $1918 – $1922
Major Support: $1910 – $1912
Immediate Resistance Zone: $1935 – $1940
Stronger Resistance: $1950
🔹 Indicators (1H Chart)
Moving Averages → Price trading above 20 EMA and near 50 EMA, showing short-term strength.
RSI (Relative Strength Index) → Around 60–65, leaning bullish but not overbought.
MACD → Positive crossover, momentum favoring buyers.
Volume → Buying volume spikes at dips, showing accumulation.
🔹 Intraday Trading Scenarios
Bullish Case
If price sustains above $1935, upside can extend to $1945 – $1950.
Breakout above $1950 opens path toward $1960+.
Bearish Case
If price drops below $1922, retracement towards $1912 – $1910 is possible.
Strong breakdown below $1910 may test $1900.
🔹 Summary
Bias: Mildly Bullish (as long as above $1920 support)
Support Levels: $1922 / $1910
Resistance Levels: $1935 / $1950
Traders should watch the $1920 – $1935 zone for the next decisive move.

NIFTY1!📍 NIFTY1! – 1H Key Levels
🔹 Support Zones
22,450 – 22,500 → Immediate intraday support
22,350 – 22,400 → Stronger support, buyers likely active here
22,200 – 22,250 → Major support zone, breakdown can invite selling pressure
🔹 Resistance Zones
22,650 – 22,700 → Immediate resistance on 1H chart
22,800 – 22,850 → Strong resistance area, breakout may fuel rally
23,000 → Psychological and major resistance zone
⚖️ Quick Summary
Above 22,700, momentum may push Nifty Futures towards 22,850 – 23,000.
Below 22,450, weakness could drag price back to 22,350 – 22,200.
Current 1H trend bias is mildly bullish, but range-bound moves are possible between 22,450 – 22,700 before a breakout.
USDJPY 1H📍 USDJPY – 1H
🔹 Support Zones
147.80 – 148.00 → Immediate intraday support
147.30 – 147.50 → Strong support; buyers likely active
146.80 – 147.00 → Major support; breakdown here may extend bearish momentum
🔹 Resistance Zones
148.50 – 148.70 → Immediate intraday resistance
149.00 – 149.20 → Strong resistance; breakout can trigger further rally
149.70 – 150.00 → Major psychological resistance
⚖️ Quick Summary
Bias: Currently range-bound with a bullish tilt as long as price stays above 147.80.
Breakout above 148.70 may open the way towards 149.20 – 150.00.
Breakdown below 147.80 may drag price back to 147.30 – 147.00.
Current watch zone: 147.80 – 148.70.

NIFTY 1H Important Levels 📍 NIFTY – 1H Important Levels
🔹 Support Zones
22,350 – 22,400 → Immediate intraday support
22,200 – 22,250 → Strong support zone
22,000 – 22,050 → Major support; breakdown here may trigger deeper selling
🔹 Resistance Zones
22,600 – 22,650 → Immediate resistance on 1H chart
22,800 – 22,850 → Strong resistance; breakout can push momentum higher
23,000 → Major psychological resistance
⚖️ Quick Summary
Bias: Mildly bullish as long as Nifty trades above 22,350.
Breakout above 22,650 may extend the rally towards 22,850 – 23,000.
Breakdown below 22,350 may drag it towards 22,200 – 22,000.
Current watch zone: 22,350 – 22,650.

D-Link India: Riding the 5G & Digital India Wave NSE:DLINKINDIA
📊 D-Link (India) Ltd – Technical & Fundamental Analysis
🔹 Technical Analysis
Trend Structure
Stock rallied from ~₹360 to ~₹590 and is currently in a corrective phase.
Presently trading around ₹476.55.
Fibonacci Retracement
Price is hovering near the 0.5 Fibonacci retracement (₹473.85).
Next key retracement support: 0.618 level (₹446.55).
Indicates the stock is at a critical support zone after a healthy pullback.
Volume Action
The correction is happening on low volumes (dry pullback).
Suggests lack of strong selling conviction.
Support & Resistance Levels
Support: ₹470 (Fib 0.5) and ₹446 (Fib 0.618).
Resistance: ₹520 (recent swing high) and ₹590 (previous top).
Technical View
Current price action reflects consolidation after a rally.
Sustainability above 470–446 zone will be important for future direction.
====================================
====================================
🔹 Fundamental Analysis
Business Overview
Subsidiary of D-Link Corporation, Taiwan.
Operates in networking solutions: routers, switches, Wi-Fi systems, surveillance equipment.
Serves consumer, SME, and enterprise markets.
Financial Position
Revenue: Stable growth supported by IT demand.
Margins: Moderate (~6–8%) but consistent.
Balance Sheet: Debt-free and cash-rich.
Returns: ROE/ROCE in the range of ~15–20%.
Industry Drivers
5G rollout in India → boosts demand for networking gear.
Digital India & Smart Cities projects → infrastructure demand.
Work-from-home & hybrid culture → sustained Wi-Fi/router demand.
Enterprise IT upgrades → strong B2B demand.
Strengths
Global brand recognition.
Expanding market presence in India.
Strong cash reserves, no debt.
Risks
Intense competition (TP-Link, Cisco, Netgear).
Import dependency → currency fluctuations affect costs.
Technology cycles → rapid product obsolescence.
🔹 Future Growth Prospects
5G & Fiberization: Rising network infrastructure requirements.
IoT & Smart Homes: Increasing adoption of connected devices and Wi-Fi mesh solutions.
Government Push: Smart City & Digital India initiatives driving demand for surveillance and enterprise networks.
Enterprise Growth: SMEs and corporates upgrading IT networks post-pandemic.
🔹 Investor-Friendly Summary
Technically: Stock is undergoing a healthy pullback at a critical Fibonacci zone (0.5–0.618). Low volume suggests limited aggressive selling.
Fundamentally: Strong brand, debt-free, positioned to benefit from digital infrastructure growth. Risks include competition and currency fluctuations.
Future Outlook: Demand from 5G, IoT, and government projects offers long-term industry tailwinds.
============================
============================
⚠️ Disclaimer:
This analysis is for educational and informational purposes only.
We are not SEBI-registered analysts or advisors.
This is our personal view based on available data and market trends.
Please consult your SEBI-registered investment advisor before making any investment or trading decisions.
You are solely responsible for any financial decisions you make based on this content.
========================
Trade Secrets By Pratik
========================

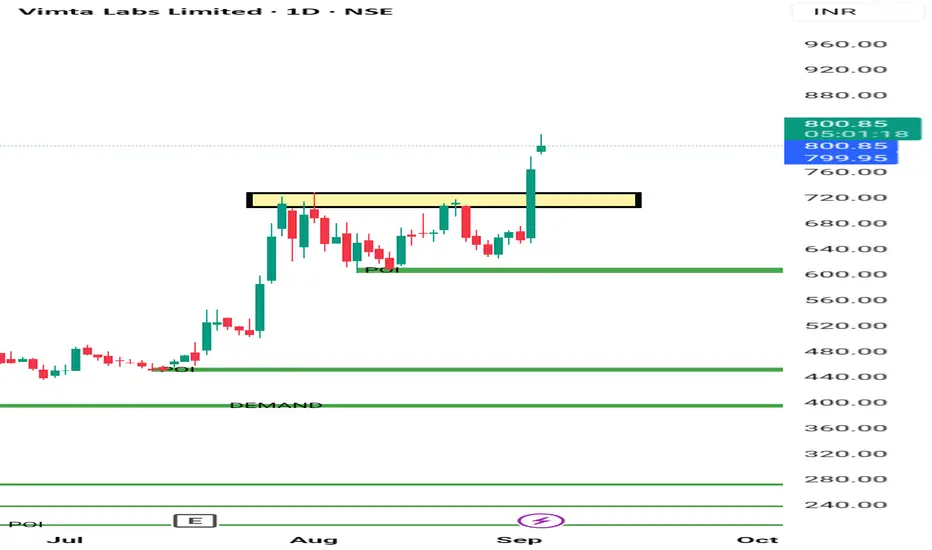
Vimta High Momentum & Breakout Stock As we can see in chart Vimta Lab is Bullish In Last some weeks . Its given clear breakout. It's moving in a parttern . It can move 5 -10% very fast In upcoming days. Keep SL near breakout levels near 710.
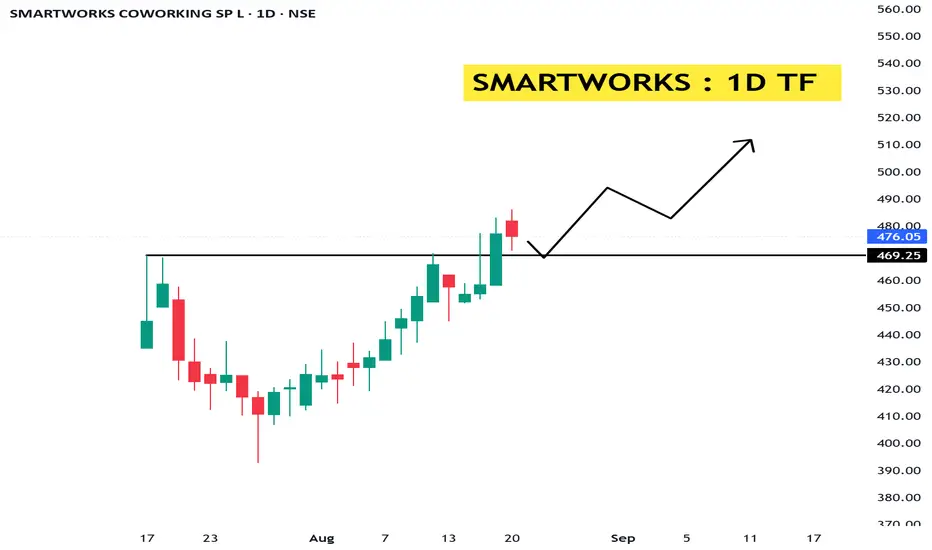
Smartworks: From IPO Buzz to Breakout ZoneNSE:SMARTWORKS
📊 Technical Analysis (Daily & Weekly Chart)
Trend: After listing in Aug 2025 around ₹407, the stock corrected to ~₹393 and then staged a strong rally towards ₹480. Currently consolidating near recent highs.
Current Price: ₹476.05
Resistance Levels:
₹480–₹490 (immediate supply zone)
₹520–₹550 (next major resistance)
Support Levels:
₹460 (short-term support)
₹420 (major support / breakout retest zone)
Chart Structure: Stock is forming a short-term bullish structure with higher highs and higher lows since early Aug. A weekly close above ₹490 may trigger continuation rally.
View: Sustaining above ₹490 can open upside towards ₹520–₹550; failure to cross may lead to pullback towards ₹460–₹420 support zone.
🏭 Fundamental Analysis
Business Model: Smartworks is India’s leading managed office space provider, offering flexible workspaces to corporates. Operates on a “space-as-a-service” model—leasing large commercial spaces, customizing, and sub-leasing to enterprises.
Growth Drivers:
Rising demand for flexible office spaces post-pandemic.
Corporate shift towards asset-light models.
Strong tailwinds from India’s IT, startup, and service sector growth.
Expansion across Tier-1 & Tier-2 cities.
Financials (FY25 & Q1 FY26): (approximate)
Revenue FY25: ~₹1,374 Cr (38.9% CAGR over 2 years).
EBITDA FY25: ~₹172 Cr (117% CAGR).
Net Loss FY25: ~₹63 Cr (loss narrowing).
Q1 FY26: Revenue ~₹379 Cr; Net Loss ~₹4 Cr (showing progress toward breakeven).
Market Cap: ~₹5,200 Cr.
Strengths:
Fastest-growing flexible office provider in India.
Strong corporate client base (enterprise-focused, not just startups).
Expanding in sync with India’s office demand cycle.
High revenue growth with improving operating margins.
Risks:
Still loss-making; breakeven depends on occupancy/utilization.
Highly competitive industry (WeWork, Awfis, IndiQube).
Lease liability-heavy model exposes risk during demand slowdowns.
Valuation expensive (P/B ~9x, negative P/E).
🎯 Conclusion
Technical View: Stock near crucial resistance ₹480–₹490. Breakout with volume can take it towards ₹520–₹550. Support at ₹460 / ₹420.
Fundamental View: Strong revenue growth and improving margins; leadership in flexible workspace model. IPO proceeds support expansion & debt reduction. Profitability is the key monitorable.
👉 Investor Stance:
Investors: Can accumulate gradually for long-term play on India’s office demand & corporate workspace outsourcing trend. Needs patience till profitability.
⚠️ Disclaimer:
This analysis is for educational and informational purposes only.
We are not SEBI-registered analysts or advisors.
This is our personal view based on available data and market trends.
Please consult your SEBI-registered investment advisor before making any investment or trading decisions.
You are solely responsible for any financial decisions you make based on this content.
========================
Trade Secrets By Pratik
========================
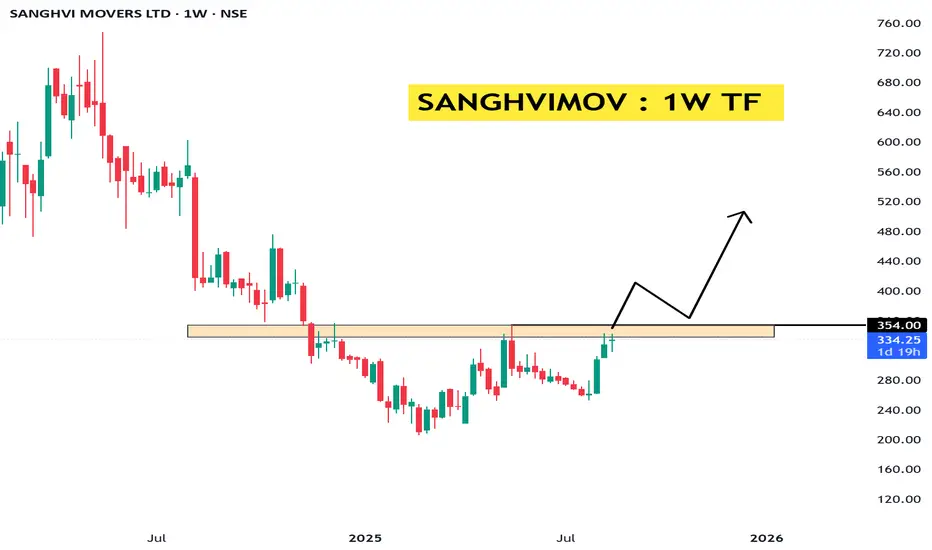
SHANGVIMOV : Heavy Lifter of India’s Infra GrowthNSE:SANGHVIMOV
📊 Technical Analysis (Weekly Chart)
Trend: After a steep fall from ~₹800 (2024 highs) to ~₹200 (2025 lows), the stock has been consolidating and is now attempting to break out of resistance near ₹350–₹360.
Current Price: ₹334.25
Resistance Levels:
₹350–₹360 (immediate supply zone, highlighted in your chart)
₹420–₹450 (next major resistance)
Support Levels:
₹300 (short-term support)
₹250 (major support, bottom zone)
Chart Structure: Formation of a rounding base; breakout above ₹360 on weekly closing can trigger momentum rally.
View: If price sustains above ₹360, potential upside towards ₹420–₹450; failure to break may lead to retest of ₹300.
🏭 Fundamental Analysis
Business Model: Sanghvi Movers Ltd is India’s largest crane rental company and among the top 10 globally. Provides heavy-lift, engineered transport & installation services, especially to wind energy, power, steel, cement, refinery, and infrastructure projects.
Growth Drivers:
Renewable energy push (especially wind and solar projects requiring heavy cranes).
Infrastructure growth under government’s capex focus.
Demand from steel, cement, oil & gas projects.
Financials (Latest FY24/25) (approximate):
Revenue: ~₹650–700 Cr.
Net Profit: ~₹120–130 Cr (steady growth).
Debt levels moderate; improved operating margins due to higher utilization of crane fleet.
Strengths:
Market leader with strong fleet of high-capacity cranes.
Asset-heavy model creates strong entry barriers.
Benefits from India’s renewable & infra capex cycle.
Risks:
Cyclical industry – earnings depend on capex cycles.
High capital expenditure (maintenance, fleet expansion).
Order inflow variability.
🎯 Conclusion
Technical View: Stock is at a crucial resistance zone (₹350–₹360). A breakout with volume could take it to ₹420–₹450. Support at ₹300.
Fundamental View: Strong long-term player in crane rental, directly benefiting from infra & renewable boom. Earnings visibility is improving with higher crane utilization.
👉 Investor Stance:
Investors: Long-term accumulation is possible; positioned well in the infra/renewable growth cycle, though cyclicality risk exists.
⚠️ Disclaimer:
This analysis is for educational and informational purposes only.
We are not SEBI-registered analysts or advisors.
This is our personal view based on available data and market trends.
Please consult your SEBI-registered investment advisor before making any investment or trading decisions.
You are solely responsible for any financial decisions you make based on this content.
========================
Trade Secrets By Pratik
========================
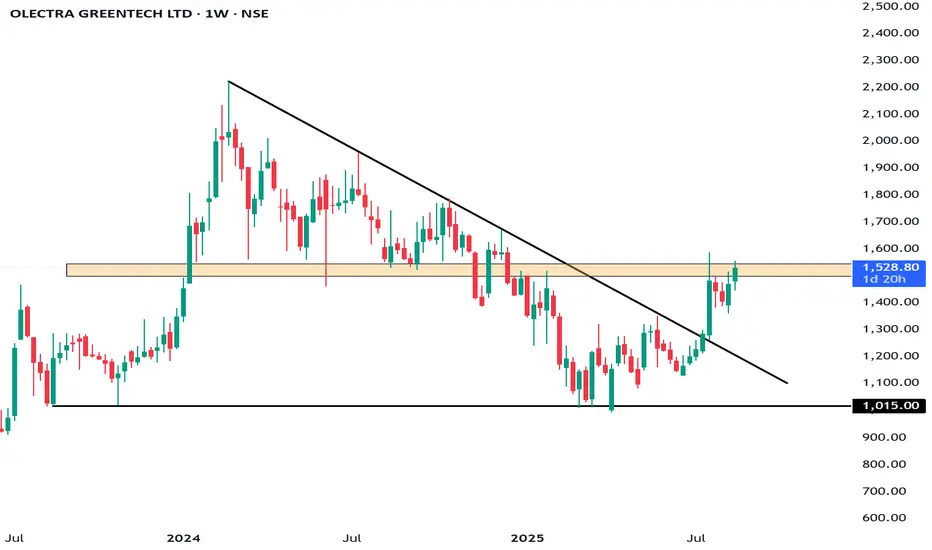
Olectra Greentech – The Silent EV Multibagger in MakingNSE:OLECTRA
📊 Technical Analysis (Weekly Chart)
Trend: The stock had a steep fall from ~₹1,800 (2024 highs) to ~₹1,000 (2025 lows). It has since formed a rounded bottom and is showing signs of reversal.
Current Price: ₹1,528.80
Resistance Levels:
₹1,600 (immediate resistance)
₹1,800 (major breakout level)
Support Levels:
₹1,400 (nearby support)
₹1,200 (major support, recent bottom area)
Indicators:
Momentum improving with strong green candles and higher lows.
Weekly structure suggests accumulation and potential trend reversal.
View: If stock sustains above ₹1,600, it can retest ₹1,800–₹2,000 in medium term.
🏭 Fundamental Analysis
Business Model: Olectra Greentech is India’s largest electric bus manufacturer, part of MEIL (Megha Engineering). It also works on tippers, EV trucks, and composite insulators.
Growth Drivers:
Government’s push for EV adoption in public transport (FAME-II scheme).
High demand for electric buses from state transport corporations.
Strong backing from parent MEIL ensures execution capacity.
Financials (Latest FY24/25) (approximate):
Revenue: ~₹1,300–1,400 Cr (growing rapidly with order wins).
Profit: Still moderate due to high R&D and capex.
Order Book: Over ₹12,000+ Cr, ensuring visibility for next 3–4 years.
Strengths:
Market leader in EV bus space.
Rising government contracts.
First-mover advantage.
Risks:
Execution delays (delivery timelines).
Intense competition from Tata Motors, Ashok Leyland.
Margin pressure due to high input and battery costs.
🎯 Conclusion
Technical View: Bullish reversal forming. Sustaining above ₹1,600 can lead to ₹1,800–₹2,000. Strong support at ₹1,200.
Fundamental View: Strong long-term growth story in India’s EV transition, backed by large order book and government support. Near-term volatility possible, but structurally a good EV play.
👉 Investor Stance:
Investors: Accumulate gradually for 3–5 years; could be a multibagger if execution sustains.
⚠️ Disclaimer:
This analysis is for educational and informational purposes only.
We are not SEBI-registered analysts or advisors.
This is our personal view based on available data and market trends.
Please consult your SEBI-registered investment advisor before making any investment or trading decisions.
You are solely responsible for any financial decisions you make based on this content.
========================
Trade Secrets By Pratik
========================
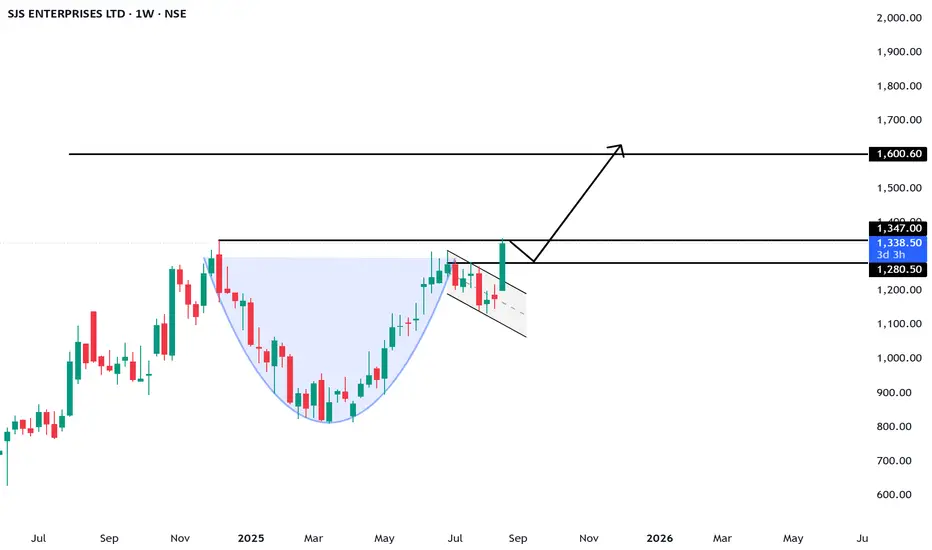
SJS Enterprises: The Silent Multi-bagger in the Making ??NSE:SJS
📌 SJS Enterprises Ltd. – Detailed Analysis Report
1. Company Overview
Leading decorative aesthetics solutions provider (decals, overlays, 3D appliqués, badges, domes).
Serves automotive, consumer appliances, and healthcare sectors.
Manufacturing in Bengaluru & Pune with exports to Europe, North America, Latin America, and ASEAN.
Strong OEM relationships and quality certifications.
2. Financial Performance
Revenue Growth: ₹370 Cr (FY22) → ₹760 Cr (FY25), CAGR ~26%.
Net Profit: ₹55 Cr (FY22) → ₹119 Cr (FY25), CAGR ~29%.
Margins: Stable ~15–16%.
Return Ratios: ROE ~18%, ROCE ~17%.
Debt Levels: Virtually debt-free.
3. Valuation Snapshot
Current Price: ~₹1,330.
P/E ~30x, P/B 5.5x → slightly expensive vs. fair value (₹950–1,000).
Analysts remain bullish with targets between ₹1,400–1,700.
4. Technical View
The stock recently broke out near ₹1,350 with strong momentum (+43% in last 6 months).
Support zone: ₹1,150–1,200.
Resistance: ₹1,350–1,400; breakout above could lead to ₹1,500+.
5. SWOT & Growth Prospects
Strengths: Diversified portfolio, strong financials, global reach, debt-free balance sheet.
Weakness: Expensive valuation, low dividend yield.
Opportunities: EV adoption, growth in appliances & healthcare aesthetics, acquisitions boosting scale.
Threats: Auto sector cyclicality, raw material cost pressures.
6. 3-Year Price Projection
Bull Case: ₹2,500–2,800 (23–27% CAGR) – if high growth and premium valuation sustain.
Base Case: ₹1,950–2,100 (13–16% CAGR) – steady growth with fair valuation.
Bear Case: ₹1,400–1,500 (1–4% CAGR) – slower growth and valuation compression.
7. Conclusion
SJS Enterprises is a high-quality, growth-oriented company with strong fundamentals, global presence, and minimal debt. Valuations are stretched, but long-term demand from EVs, appliances, and healthcare supports growth.
Long-term investors: Can hold for potential multibagger returns.
New investors: Best to enter on dips near ₹1,200–1,250.
Traders: Momentum above ₹1,400 can drive near-term rally toward ₹1,500+.
⚠️ Disclaimer:
This analysis is for educational and informational purposes only.
We are not SEBI-registered analysts or advisors.
This is our personal view based on available data and market trends.
Please consult your SEBI-registered investment advisor before making any investment or trading decisions.
You are solely responsible for any financial decisions you make based on this content.
========================
Trade Secrets By Pratik
========================
Stock Showdown Saturday: Can You Spot the Trade?Disclaimer:
The chart used in this video is from May 2023 (over 3 months old). It is shown only for educational purposes, to demonstrate strategy-building ideas and share trading experience. This is not financial advice and should not be considered as a recommendation to buy, sell, or skip any stock. Always do your own research before making trading decisions.

Buy, Sell, Retest or Sit Out? | Ep. 1 – Trade Decision SeriesCharts in this video are over 3 months old. This is for educational purposes only, using TradingView’s replay feature to demonstrate strategy thinking and decision-making. Not financial advice.

Nifty May Slide to 22000 — Here’s the Technical BreakdownNSE:NIFTY
Why Nifty May Slide to 22000 – A Comprehensive Technical and Macro-Economic Analysis
---
🔹Summary:
The Indian stock market, led by the Nifty 50, appears to be entering a corrective phase. Based on a comprehensive multi-timeframe technical analysis, combined with deteriorating global cues and domestic economic pressure points, there is a high probability that the Nifty index could fall to the 22000 zone in the coming weeks or months.
---
📊 1. Multi-Timeframe Technical Analysis
🔴 Daily Chart Insights:
Nifty has broken below the 20-day and 50-day EMAs.
MACD has shown a fresh bearish crossover, and the histogram is increasing in negative territory.
Lower highs and breakdown candles indicate short-term weakness.
Immediate support zones: 22800 and 22100.
🔵 Weekly Chart Insights:
After forming a lower high, Nifty has started forming red candles.
MACD on the weekly chart has recently given a bearish crossover.
Price is nearing the 50-week EMA; a breakdown may accelerate the fall to 21084.
200 EMA stands near 20618 – strong medium-term support.
🔶 Monthly Chart Insights:
Long-term uptrend is weakening.
MACD histogram is red, with the MACD line diverging downward.
Historical resistance around 25,000 held strong.
Monthly supports at 23401, 22805, and major zone at 21084.
Extreme correction support zone: 18250.
---
🌎 2. Global Macroeconomic Factors
✉️ Hawkish US Federal Reserve:
Fed remains reluctant to cut rates due to sticky core inflation.
High US yields attract capital back to the US, triggering FII outflows.
⛽ Rising Crude Oil Prices:
Brent crude consistently around \$70+/barrel.
India, a net importer, faces rising import bills, widening the current account deficit.
Higher oil = pressure on inflation + input cost rise for manufacturing and transport sectors.
🇨🇳 China’s Slowdown:
Real estate crisis, deflation risk, and declining exports in China.
Global growth slowdown impacting Indian export-heavy sectors (IT, Pharma).
📈 FII Data:
* FIIs have turned net sellers in recent weeks in both equities and index futures.
* Weak INR (trading near 84) adds pressure to FII outflows.
---
📊 3. Domestic Economic Concerns
📉 Valuation Concerns:
Nifty PE > 22x, above historical mean of 18x.
Many large caps are seeing **EPS downgrades** or flat YoY growth.
Risk of further de-rating if earnings disappoint.
👐 Weakening Sectors:
IT: Margin pressures and delayed tech spending.
Banking: Credit growth tapering, NIM compression.
Auto & FMCG: Rising input cost and subdued rural demand.
🪖 INR Weakness:
A weak rupee leads to expensive imports and inflation.
RBI may have limited ability to control INR due to global currency war.
✈️ Pre-Election Volatility:
Upcoming general elections (2026) cause policy overhang.
Historically, markets correct 6-9 months prior to national elections.
---
🔹 4. Conclusion: Levels to Watch
| 22805 | First technical support / swing low zone
| 22105 | Confluence of horizontal support and Fibs
| 21085 | Weekly structure support
| 20618 | 200 EMA on weekly chart
| 18277 | Worst-case scenario support (panic zone)
---
🔎 Final View:
While the long-term bullish structure of Nifty is not completely broken, signs of a **multi-month correction are strong and building**. The alignment of technical breakdowns with global and economic headwinds suggests a high-probability move toward 22000 or lower. Caution is advised for investors and traders holding long positions.
Actionable Advice: Wait for confirmation reversal signals before entering fresh longs. Maintain strict risk management and monitor key levels closely.
---
⚠️ Disclaimer:
This analysis is for educational and informational purposes only.
We are not SEBI-registered analysts or advisors.
This is our personal view based on available data and market trends.
Please consult your SEBI-registered investment advisor before making any investment or trading decisions.
You are solely responsible for any financial decisions you make based on this content.
========================
Trade Secrets By Pratik
========================

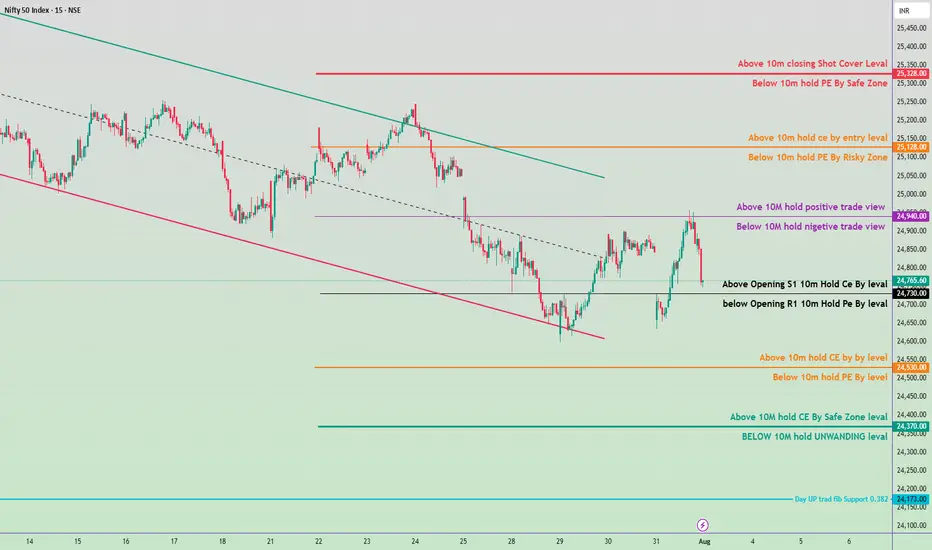
Trade Plan Description for Tomorrow August 1, 2025Bullish Zones & Strategy (Call / CE Levels)
Above 24,765 (Opening S1):
If price sustains above this, bias may shift positive.
🔹 Buy CE (Call) above this level with stop below S1.
Key Upside Resistance Levels:
24,940 – Above this, positive trade view builds (Strong CE Hold).
25,100 - 25,150 – CE entry & momentum zone.
25,350 - 25,382 – Shot Cover Zone (Strong resistance, book profit or expect reversal).
🔻 Bearish Zones & Strategy (Put / PE Levels)
Below 24,765:
Stay cautious – move toward bearish bias if price sustains below.
🔸 Buy PE (Put) below this level with stop above.
Key Downside Support Levels:
24,708 – R1 level; below this, PE strength increases.
24,550 - 24,500 – PE by-level zone.
24,370 – Safe Zone for PE traders.
24,173 - 24,130 – Unwinding + Fib Support.
JSW-INFRA : Powering India’s Port Revolution – A Deep Dive into NSE:JSWINFRA
JSW Infrastructure Ltd.
🧾 Company Overview
Role: JSW Infrastructure is India's second-largest commercial port operator (after Adani Ports), and forms a core part of the JSW Group.
Operations: The company manages and operates major ports across both the east and west coastlines of India.
Revenue Streams: Primarily driven by port operations (handling bulk, breakbulk, containerized cargo), as well as integrated logistics services.
📊 FY24 Financial Snapshot
Revenue ₹3,200+Cr
EBITDA Margin 55–60%
Net Profit ₹750+Cr
Debt to Equity ~0.6x
ROCE ~15%
ROE ~13%
Positive aspects:
Asset Turnover Strong
Double-digit revenue CAGR (>20%) over the past three years.
High EBITDA margins consistent with best-in-class infra businesses.
Well-diversified cargo and customer profile, with increasing non-JSW business.
Stable long-term contracts & beneficiary of India’s logistics and trade reforms.
Risks / Weaknesses:
~70% revenue is from group companies, though diversification is underway.
Aggressive capex plans elevate financial risk.
Susceptible to regulatory, tariff, and environmental compliance changes.
📈 Technical Analysis (July 2025)
• Share Price: Trading in the ₹260–₹280 range. IPO was at ₹119 (Sep 2023); strong price appreciation since listing.
• Trend: Intact uptrend; recently consolidated between ₹240–₹260.
• Support/Resistance: Key support at ₹230–₹235; resistance at ₹285–₹300.
• Moving Averages: Stock remains above both its 50-EMA and 200-EMA — a structurally bullish indicator.
• Momentum:
o RSI: 60–65 (bullish, but approaching overbought)
o MACD: Fresh bullish crossover; volume shows accumulation near breakout.
• Outlook: Breakout above ₹285 could trigger medium-term upside toward ₹320–₹340. Buy-on-dips is favored, with strong accumulation likely in the ₹230–₹240 zone.
🚀 Growth Prospects & Strategic Moves
• Capacity Expansion: Plans to nearly double port capacity by FY30 (from ~160 MTPA to ~300 MTPA).
• Cargo Diversification: Targeting major reduction of group dependency (from ~70% to ~50%) by growing third-party cargo traffic.
• New Projects: Investment pipeline includes both greenfield and brownfield projects in Odisha, Maharashtra, and other states.
• Integrated Logistics: Deeper backward integration into rail connectivity and warehousing to capture higher value from logistics value chain.
• Macro Tailwinds
o Major government initiatives (e.g., Sagarmala) catalyzing sector growth.
o India’s trade/exports rising; strong outlook for cargo and container volumes.
o Shifts in supply chains to coastal shipping and blended logistics.
o Demand uptrend in containerization and warehousing services.
⚠️ Key Risks & Limitations
• High Capex Cycle: Expansion could elevate debt and financial leverage.
• Macro Sensitivity: Lower industrial/output growth would hit cargo volumes.
• Regulatory Overhang: Tariff and ESG regulations present chronic uncertainty.
• Group Concentration: Third-party cargo growth remains an execution challenge.
• Rivalry: Competitive intensity from Adani, DP World, and others is ramping up.
📌 Conclusion & Investment Verdict
Parameter Verdict
Fundamentals Strong, superior margins, efficient operations
Valuation Fair to premium (due to uptrend and growth)
Technical Trend Bullish, ready for potential breakout
Growth Outlook High (supported by sector tailwinds)
Risk Profile Moderate (driven by capex & regulatory factors)
For long-term investors:
JSW Infra presents a compelling case for portfolio inclusion, offering robust growth visibility, sectoral leadership, and operating excellence. Accumulation is best near ₹230–₹240 on dips.
Short-term view:
Stocks in strong uptrends may see minor corrections but are well-placed for fresh breakouts above ₹285, targeting ₹320–₹340.
The stock is ideal for investors seeking infrastructure-sector exposure with high growth potential, but one must remain mindful of execution and regulatory risks.
==============================
==============================
⚠️ Disclaimer:
This analysis is for educational and informational purposes only.
We are not SEBI-registered analysts or advisors.
This is our personal view based on available data and market trends.
Please consult your SEBI-registered investment advisor before making any investment or trading decisions.
You are solely responsible for any financial decisions you make based on this content.
========================
Trade Secrets By Pratik
========================
Update idea
Add note
Trade_Secrets_By_Pratik
Also on:
Disclaimer
The information and publications are not meant to be, and do not constitute, financial, investment, trading, or other types of advice or recommendations supplied or endorsed by TradingView. Read more in the Terms of Use.
English (India)
Select market data provided by ICE Data services.
Select reference data provided by FactSet. Copyright © 2025 FactSet Research Systems Inc.
© 2025 TradingView, Inc.
More than a product
Supercharts
Screeners
Stocks
ETFs
Bonds
Crypto coins
CEX pairs
DEX pairs
Pine
Heatmaps
Stocks
ETFs
Crypto
Calendars
Economic
Earnings
Dividends
More products
Yield Curves
Options
News Flow
Pine Script®
Apps
Mobile
Desktop
Tools & subscriptions
Features
Pricing
Market data
Trading
Overview
Brokers
Special offers
CME Group futures
Eurex futures
US stocks bundle
About company
Who we are
Athletes
Blog
Careers
Media kit
Merch
TradingView store
Tarot cards for traders
The C63 TradeTime
Policies & security
Terms of Use
Disclaimer
Privacy Policy
Cookies Policy
Accessibility Statement
Security tips
Bug Bounty program
Status page
Community
Social network
Wall of Love
Refer a friend
House Rules
Moderators
Ideas
Trading
Education
Editors' picks
Pine Script
Indicators & strategies
Wizards
Freelancers
Business solutions
Widgets
Charting libraries
Lightweight Charts™
Advanced Charts
Trading Platform
Growth opportunities
Advertising
Brokerage integration
Partner program
Education program
Look First
HDFC BANK LTD
NSE•Real-time•Market closed
Edit Idea
Minimize
Close
JSW INFRA : Powering India’s Port Revolution – A Deep Dive into
NSE:JSWINFRA
JSW Infrastructure Ltd.
🧾 Company Overview
Role: JSW Infrastructure is India's second-largest commercial port operator (after Adani Ports), and forms a core part of the JSW Group.
Operations: The company manages and operates major ports across both the east and west coastlines of India.
Revenue Streams: Primarily driven by port operations (handling bulk, breakbulk, containerized cargo), as well as integrated logistics services.
📊 FY24 Financial Snapshot
Revenue ₹3,200+Cr
EBITDA Margin 55–60%
Net Profit ₹750+Cr
Debt to Equity ~0.6x
ROCE ~15%
ROE ~13%
Positive aspects:
Asset Turnover Strong
Double-digit revenue CAGR (>20%) over the past three years.
High EBITDA margins consistent with best-in-class infra businesses.
Well-diversified cargo and customer profile, with increasing non-JSW business.
Stable long-term contracts & beneficiary of India’s logistics and trade reforms.
Risks / Weaknesses:
~70% revenue is from group companies, though diversification is underway.
Aggressive capex plans elevate financial risk.
Susceptible to regulatory, tariff, and environmental compliance changes.
📈 Technical Analysis (July 2025)
• Share Price: Trading in the ₹260–₹280 range. IPO was at ₹119 (Sep 2023); strong price appreciation since listing.
• Trend: Intact uptrend; recently consolidated between ₹240–₹260.
• Support/Resistance: Key support at ₹230–₹235; resistance at ₹285–₹300.
• Moving Averages: Stock remains above both its 50-EMA and 200-EMA — a structurally bullish indicator.
• Momentum:
o RSI: 60–65 (bullish, but approaching overbought)
o MACD: Fresh bullish crossover; volume shows accumulation near breakout.
• Outlook: Breakout above ₹285 could trigger medium-term upside toward ₹320–₹340. Buy-on-dips is favored, with strong accumulation likely in the ₹230–₹240 zone.
🚀 Growth Prospects & Strategic Moves
• Capacity Expansion: Plans to nearly double port capacity by FY30 (from ~160 MTPA to ~300 MTPA).
• Cargo Diversification: Targeting major reduction of group dependency (from ~70% to ~50%) by growing third-party cargo traffic.
• New Projects: Investment pipeline includes both greenfield and brownfield projects in Odisha, Maharashtra, and other states.
• Integrated Logistics: Deeper backward integration into rail connectivity and warehousing to capture higher value from logistics value chain.
• Macro Tailwinds
o Major government initiatives (e.g., Sagarmala) catalyzing sector growth.
o India’s trade/exports rising; strong outlook for cargo and container volumes.
o Shifts in supply chains to coastal shipping and blended logistics.
o Demand uptrend in containerization and warehousing services.
⚠️ Key Risks & Limitations
• High Capex Cycle: Expansion could elevate debt and financial leverage.
• Macro Sensitivity: Lower industrial/output growth would hit cargo volumes.
• Regulatory Overhang: Tariff and ESG regulations present chronic uncertainty.
• Group Concentration: Third-party cargo growth remains an execution challenge.
• Rivalry: Competitive intensity from Adani, DP World, and others is ramping up.
📌 Conclusion & Investment Verdict
Parameter Verdict
Fundamentals Strong, superior margins, efficient operations
Valuation Fair to premium (due to uptrend and growth)
Technical Trend Bullish, ready for potential breakout
Growth Outlook High (supported by sector tailwinds)
Risk Profile Moderate (driven by capex & regulatory factors)
For long-term investors:
JSW Infra presents a compelling case for portfolio inclusion, offering robust growth visibility, sectoral leadership, and operating excellence. Accumulation is best near ₹230–₹240 on dips.
Short-term view:
Stocks in strong uptrends may see minor corrections but are well-placed for fresh breakouts above ₹285, targeting ₹320–₹340.
The stock is ideal for investors seeking infrastructure-sector exposure with high growth potential, but one must remain mindful of execution and regulatory risks.
==============================
==============================
⚠️ Disclaimer:
This analysis is for educational and informational purposes only.
We are not SEBI-registered analysts or advisors.
This is our personal view based on available data and market trends.
Please consult your SEBI-registered investment advisor before making any investment or trading decisions.
You are solely responsible for any financial decisions you make based on this content.
========================
Trade Secrets By Pratik
========================
Institutional Option Trading🏛️ Institutional Option Trading
Institutional Option Trading refers to how large financial institutions like hedge funds 📊, investment banks 🏦, insurance firms 🧾, and asset managers 💼 use options contracts strategically to hedge risks, generate income, or make large, leveraged bets with controlled risk.
These institutions trade options using:
🧠 Advanced analytics & algorithms
📉 Volatility-based strategies (like straddles, condors, and spreads)
📊 Risk-neutral positioning using Greeks (Delta, Vega, Theta, etc.)
🛡️ Portfolio hedging & macroeconomic plays
💼 Multi-million dollar contracts with custom structures
Their trading is not based on emotions, but on probabilities, risk-reward analysis, and long-term objectives.
📌 In simple words:
Institutional Option Trading is how big players use options smartly to manage risk and extract value — with precision, scale, and professional tools. 💼⚙️📈

Macro-Driven Risk Planning🔍 What is Macro-Driven Risk Planning?
At its core:
Macro-driven risk planning means managing your investment or trading risks by keeping the larger economic environment in mind.
You don’t just look at a stock or a chart — you ask:
What's happening with interest rates?
Is inflation rising or falling?
What’s the government doing with taxes or spending?
Is the US dollar strong or weak?
What are central banks like the RBI or the Federal Reserve up to?
These macroeconomic factors can make or break entire trades, portfolios, and even industries. So macro-driven risk planning is about aligning your strategies with the economic environment.
🧠 Why Is This Important?
Let’s say you’re trading in India.
If the US increases its interest rates sharply:
Foreign investors might pull money out of Indian markets.
INR might weaken.
Stock market might fall due to FII outflows.
If you're not paying attention to this macro signal, you might be trading blindly — even if your technicals are perfect.
🏦 Key Macro Factors That Drive Risk
Here’s a list of major macroeconomic indicators that smart investors and institutions track:
1. Interest Rates
Central banks (like the RBI or US Fed) control this.
📈 Rising Rates: Borrowing becomes expensive → Business slows → Markets may fall.
📉 Falling Rates: Loans become cheaper → Business expands → Markets may rise.
How to plan risk:
If rates are going up, shift from high-growth, high-debt companies to safer sectors like FMCG, pharma, utilities.
2. Inflation
This measures how fast prices are rising.
Moderate inflation = Normal
High inflation = Dangerous for consumers
Deflation = Danger of recession
Indicators: CPI (Consumer Price Index), WPI (Wholesale Price Index)
Risk Planning Tip:
In high inflation, avoid sectors that depend on raw material prices (like auto, FMCG) and look at commodities or inflation-protected assets (like gold, real estate).
3. GDP Growth (Economic Output)
Gross Domestic Product shows if the economy is expanding or shrinking.
📈 Strong GDP = Business confidence = Higher earnings
📉 Weak GDP = Caution = Lower valuations
Risk Strategy:
During GDP growth, take on slightly higher risk with cyclical stocks (like infra, banks). During slowdown, shift to defensive sectors (like pharma, IT).
4. Currency Movements (INR/USD, etc.)
Currency strength/weakness affects:
Imports/Exports
FII flows
Commodity prices (like oil)
Example: If INR weakens, oil imports become costly → Impacts inflation → May lead to rate hikes.
Plan risk: Export-based sectors (IT, pharma) benefit from weak rupee. Importers (oil, aviation) suffer.
5. Fiscal and Monetary Policies
This includes:
Government budgets (fiscal policy) – Taxes, subsidies, spending
Central bank actions (monetary policy) – Rate changes, money supply
Risk View:
A budget with heavy borrowing = inflation pressure
A tight monetary policy = reduced liquidity in markets
Keep eyes on RBI speeches, Fed meetings, union budgets.
6. Global Events
Even if you only trade in India, global news affects you:
US elections
Crude oil prices
Geopolitical tensions (e.g. China-Taiwan, Russia-Ukraine)
Supply chain issues
US Non-Farm Payroll (NFP) data
Macro-risk planning = Staying alert to these changes.
7. Bond Yields
Especially US 10-year bond yield.
Rising yield = Risk-off = Equities may fall
Falling yield = Risk-on = Equities may rise
Foreign investors use this as a guide. It directly affects FII flows.
📘 Real-Life Example: Macro Risk in Action
Case: COVID-19 Pandemic (2020)
Global economy shut down
Interest rates slashed to zero
Stimulus packages announced
Investors moved money into gold, tech stocks, pharma
Smart traders did this:
Moved into digital, pharma, and FMCG stocks
Stayed away from travel, aviation, real estate
Watched central bank actions daily
Used hedges (like buying puts or moving to cash)
This is macro-driven risk planning in real-time.
⚖️ How to Build a Macro Risk Management Plan
Here’s a step-by-step structure anyone can follow:
Step 1: Define Your Risk Tolerance
Are you a short-term trader or long-term investor?
Can you handle volatility?
Do you rely on leverage or trade with cash?
This tells you how much room you have to play with.
Step 2: Track Macro Indicators Weekly
Use sites like:
RBI website for policy updates
Trading Economics for inflation, GDP, interest rates
Bloomberg, CNBC, or Twitter for global headlines
Set alerts for:
Fed meeting dates
India CPI, GDP, IIP
Crude oil updates
Step 3: Use Hedging Tools
Advanced traders use:
Options (buying protective Puts)
Inverse ETFs (for global markets)
Gold or commodities
Diversification (across sectors, geographies)
Step 4: Stay Flexible
Macro conditions change fast. Stay open to:
Rotating your portfolio
Sitting on cash during uncertain times
Changing strategies with data, not emotions
🧭 Conclusion: Think Bigger, Trade Smarter
Macro-Driven Risk Planning is about being proactive, not reactive.
Markets aren’t moved by charts alone. They’re driven by:
Central banks
Government decisions
Global events
Economic data
So when you plan your next trade or invest in a stock, ask yourself:
“Am I moving with the economic current — or fighting against it?”
The more you understand macro trends, the better you’ll manage your risks and grow consistently.

Divergence Secrets📌 What is Divergence?
Divergence occurs when the price action of a security moves in the opposite direction of a technical indicator or momentum oscillator.
There are two main types:
Regular Divergence – Signals potential reversal
Hidden Divergence – Signals trend continuation
🔍 1. Regular Divergence (Reversal Signal)
Occurs when:
Price makes a higher high, but the indicator makes a lower high (bearish divergence)
Price makes a lower low, but the indicator makes a higher low (bullish divergence)
✳️ Example:
Bearish divergence: Price is rising, but RSI is falling → Possible upcoming downtrend.
Bullish divergence: Price is falling, but MACD is rising → Possible upcoming uptrend.
This tells you the momentum is weakening, even though price appears strong.
🔍 2. Hidden Divergence (Trend Continuation)
Occurs when:
Price makes a higher low, but the indicator makes a lower low → Bullish hidden divergence
Price makes a lower high, but the indicator makes a higher high → Bearish hidden divergence
Hidden divergence shows that momentum is aligning with trend direction and suggests continuation.
📈 Indicators to Spot Divergence
RSI (Relative Strength Index)
Best for spotting overbought/oversold and divergences.
MACD (Moving Average Convergence Divergence)
Great for visualizing momentum divergence.
Stochastic Oscillator
Good for short-term divergence.
On-Balance Volume (OBV)
Helps spot divergence using volume behavior.
CCI (Commodity Channel Index)
🔐 Institutional Secret: Volume Divergence
Institutions look for divergence between price and volume:
Price making higher highs but volume falling? Institutions might be distributing (smart money exiting).
Price making lower lows but volume rising? Could be accumulation.
This is often missed by retail traders!
✅ How to Trade Divergence (Checklist)
🔸 Entry Strategy:
Wait for divergence confirmation on a strong indicator (RSI/MACD)
Use candlestick reversal patterns near divergence zones
Align with support/resistance or trendlines
🔸 Stop-Loss:
Always place below/above recent swing low/high (depending on long or short)
🔸 Take-Profit:
Use Fibonacci levels, previous structure, or trend-based targets
⚠️ Common Mistakes
Trading divergence without price confirmation
Forcing divergence on weak or flat trends
Ignoring higher timeframe context
Using only one indicator
Always confirm with price structure, volume, and multi-timeframe analysis.
🎯 Pro Tip: Combine with Institutional Tools
Use Order Blocks + Divergence = Strong reversal signal
Combine Liquidity Zones + Divergence = Catch smart money traps
Divergence + Imbalance zones = Laser-precise entries.

Trading Master Class With Experts.
🔶 Who Are These "Experts"?
The “experts” in a trading master class are usually:
✅ Professional traders working with institutions, hedge funds, or prop firms
✅ Full-time independent traders with consistent profit history
✅ Option Greeks and derivatives specialists
✅ Technical and price action experts
✅ Economists and market analysts
They are people who have traded for years, been through different market cycles, and know what works and what fails in the real market.
🔷 What You Will Learn in a Trading Master Class With Experts?
Here is a detailed breakdown of what such a master class includes:
🧠 1. Trading Mindset & Psychology Mastery
“90% of trading is mindset, not charts.”
Experts teach you:
How to control emotions like fear, greed, FOMO
How to build discipline, patience, and consistency
How to handle losses without revenge trading
How to develop a winning mindset like a hedge fund trader
📊 2. Advanced Technical Analysis (Beyond Indicators)
Forget about just MACD, RSI, Bollinger Bands.
Experts teach:
Price Action Secrets
Multi-timeframe analysis
Structure-based trading (HH, HL, LL, LH)
Breakout vs Fakeout patterns
Volume analysis and hidden traps
🎯 You’ll learn to predict moves with logic, not luck.
📈 3. Institutional Concepts (Smart Money Approach)
This is a core part of the class. You will learn how institutions trade, including:
Liquidity Zones & Order Blocks
Stop Loss Hunting Techniques
Fair Value Gaps (FVG)
Break of Structure (BOS)
Mitigation Blocks
Imbalance trading
You’ll finally understand:
"Why price reverses after breakout?”
"Why your stop loss gets hit and then the market moves in your direction?”
Experts teach you how to track institutional footprints and follow their logic.
📉 4. Derivatives & Options Trading Mastery
For advanced traders, especially in India (Nifty/Bank Nifty), the class covers:
✅ Options Chain Interpretation
✅ Open Interest (OI) Strategy
✅ Option Greeks (Delta, Gamma, Theta, Vega)
✅ Directional & Non-Directional Trading
✅ Intraday Option Scalping Techniques
✅ Straddles, Strangles, Spreads, Iron Condors
✅ Event-based strategies (Budget day, RBI day, earnings)
Live examples are shown using tools like Sensibull, QuantsApp, TradingView.
🔐 5. Risk Management Like Professionals
Trading without risk control is gambling.
In the master class, you’ll learn:
Position Sizing Models
Risk-to-Reward (RRR) Strategies
How to protect capital in volatile markets
Importance of trade journaling
When not to trade (which is as important as trading)
🎯 You’ll be taught how to think like a fund manager, not a gambler.
🧾 6. Trading Plan and Strategy Building
By the end of the class, you will have your own trading system, built with guidance from the experts.
Includes:
Entry and exit rules
Setup confirmation techniques
Trade management
Backtesting
Live trading practice
🎯 You’ll no longer depend on Telegram groups or paid signals. You will have your own tested edge.
💡 7. Live Market Sessions and Analysis
One of the most powerful parts of a master class is live sessions with experts, where you:
✅ Watch experts analyze the market in real-time
✅ Learn how they decide trades
✅ Ask questions on-the-spot
✅ See how they manage losses and winners
✅ Get live updates on index, stocks, options strategies
This removes confusion like:
“Should I buy or sell now?”
“Is this a trap or breakout?”
🔧 8. Tools, Platforms & Market Scanners Training
Learn to use:
TradingView Pro with institutional indicators
Option Analytics Tools (Sensibull, Opstra, Quantsapp)
Volume & Order Flow Tools
How to read market depth (Level 2 data)
How to use backtesting software for strategy building
🎯 The goal is to make you fully independent and tool-savvy.
📁 What’s Included in a Master Class Package?
A typical premium expert trading master class includes:
📌 20-30 hours of recorded sessions
📌 Weekly live sessions (Q&A, market review)
📌 Real trade examples (screenshots or live trades)
📌 Market homework and trade journaling
📌 Access to private trading communities
📌 Lifetime access + updates
📌 Strategy PDFs, cheat sheets
📌 Certificate of Completion (optional)
🔑 Benefits of Taking This Master Class
✅ Get direct mentorship from people who actually trade
✅ Save years of trial & error
✅ Learn real strategies, not just theory
✅ Increase accuracy and reduce losses
✅ Learn why you lose money and how to fix it
✅ Build discipline, process, and patience
✅ Join a community of focused traders
👨🏫 Who Should Join?
This class is perfect for:
Traders who lose consistently and don’t know why
Those who want to learn institutional-style trading
Option traders who want to become premium sellers / scalpers
People ready to invest time and discipline—not chasing “quick money”
Anyone who wants to turn part-time trading into serious skill
🔁 Real Case Example:
Imagine a Bank Nifty trader who always loses during breakouts. He joins the master class.
He learns:
How institutions create false breakouts
How to identify order blocks & liquidity grabs
How to position sell options around key zones
How to protect his capital with hedging and RRR control
Now, instead of gambling, he trades with confidence and understands what’s happening behind the candles.
🎓 Final Words
A Trading Master Class With Experts is like getting a direct map to reach consistent profitability in the market.
It is not a magic formula, but it trains your brain to think like a professional, trade like an institution, and manage risk like a fund.
It teaches you to focus not on tips, indicators, or chasing, but on:
Process
Discipline
Data
Edge
Execution.

Option Chain Analysis + Open Interest (OI)🧠 Let’s First Understand: What is Option Chain?
An Option Chain is a table that shows available strike prices for a particular stock/index along with their Call and Put option data—like premium, volume, open interest, change in OI, etc.
✅ Where can you find it?
NSE Website (most reliable)
Trading Platforms like Zerodha, AngelOne, etc.
Apps like Sensibull, Opstra, etc.
The option chain is divided into two parts:
Left side – Call Options (CE)
Right side – Put Options (PE)
Each row shows the strike price and various data like:
LTP (Last Traded Price) – the premium.
Open Interest (OI) – total contracts outstanding.
Change in OI – new positions added or removed.
Volume – how many contracts traded today.
🔍 What is Open Interest (OI)?
OI = Open Interest = Open positions in the market.
It shows how many contracts are live at a particular strike. It’s like a pulse of the market—it tells us where the action is happening.
If OI is going up → Traders are adding positions
If OI is going down → Traders are closing positions
🔑 Why Is OI Important?
Because institutions and smart money create large positions—and OI helps us identify where they’re betting.
OI gives an idea of:
Support and Resistance zones
Strength of a trend
Where market might reverse
Where volatility might increase
📘 Understanding Support & Resistance Using Option Chain
Support and resistance levels can be seen through the OI data in the option chain.
✅ How to Identify Support?
Look at Put OI:
The strike price with highest Put OI is considered strong support.
Why? Because put writers (who are mostly smart money) don’t expect the price to fall below this level.
Example:
If 22,500 PE has the highest OI, it acts as a support level.
✅ How to Identify Resistance?
Look at Call OI:
The strike price with highest Call OI is considered strong resistance.
Why? Because call writers are betting price won’t go above this level.
Example:
If 23,200 CE has the highest OI, it acts as a resistance level.
🔁 Change in OI – Fresh Positions vs Exits
Don't just look at total OI—look at the change in OI today.
Increase in OI = Fresh positions are being added
Decrease in OI = Traders are squaring off positions
It helps confirm if the current market move is genuine or fake.
Example:
If Nifty is going up and Call OI at 23,000 is increasing, it means fresh selling → possible resistance.
But if Call OI is decreasing, it means sellers are exiting → breakout possible.
🧩 How Option Chain + OI Help in Intraday Trading
Find Support & Resistance Zones
Use highest OI levels to set your boundaries.
Avoid buying near strong resistance; avoid selling near strong support.
Use OI to Validate Breakouts
Watch how OI changes near key strike prices.
If resistance strike sees short covering (OI falling), breakout is real.
Trend Confirmation
Long buildup (Price ↑, OI ↑) = Uptrend
Short buildup (Price ↓, OI ↑) = Downtrend
Expiry Day Strategy
Focus on where OI is building rapidly.
Use max pain and max OI to sell straddles/strangles safely.
🧠 Advanced Concepts
🔸 Max Pain Theory
Max Pain is the strike price where the most option buyers lose money on expiry. It is the level where option sellers are most profitable. It usually acts like a magnet near expiry.
Example:
If Max Pain for Nifty is 23,000, market may stay near this level on expiry day.
🔸 PCR (Put Call Ratio)
PCR = Total Put OI / Total Call OI
PCR > 1: More Puts than Calls → Bullish sentiment
PCR < 1: More Calls than Puts → Bearish sentiment
PCR near 1 = Neutral/Rangebound market
Use it with caution—extremely high or low PCR may signal reversal zones.
🛠️ Tools to Use (Free)
NSE India Website – Best for raw data
Sensibull, Opstra, Quantsapp – Visual OI charts
TradingView – Combine charts + option levels
Telegram OI Bots – For quick OI updates
📌 Do's & Don'ts in Option Chain + OI Analysis
✅ Do:
Use OI + Price + Volume together
Watch OI shifts during the day (especially 9:30–10:30 AM and 2–3 PM)
Combine with support/resistance zones from charts
❌ Don’t:
Trade blindly based only on highest OI
Ignore rapid changes in OI—it could signal smart money exit
Confuse high OI with direction—it just means “interest,” not bias
🎯 Final Words
Option Chain + OI analysis isn’t just a tool—it’s your insight into the mind of the market. It tells you what others are doing, especially the big players who move the markets.
To master it, keep practicing:
Observe how OI builds around events (like RBI policy, earnings)
Watch price + OI behavior on breakout and breakdown days
Pair OI with basic technical analysis for solid confidence
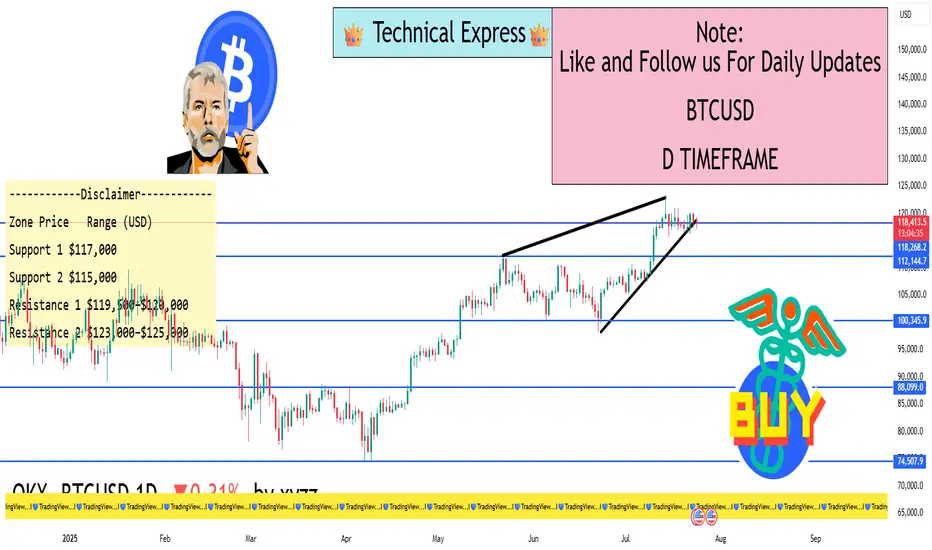
BTCUSD 1D Timeframe✅ Current Market Data
Current Price: ~$118,420 USD
Day’s High: ~$119,210
Day’s Low: ~$117,428
Previous Close: ~$118,004
Change Today: +$416 (around +0.35%)
📈 Price Behavior Today
Bitcoin is showing range-bound movement between $117K and $119K after a strong rally in the past few days.
The current price action suggests market indecision, with neither bulls nor bears taking clear control.
Momentum indicators are neutral, with RSI hovering around 52–55, indicating sideways consolidation.
🧠 Key Drivers Behind Price Action
Profit Booking: After recent rallies above $120K, traders are taking profits, keeping the price in check.
Strong Institutional Demand: ETFs and institutional buying continue to offer long-term support to Bitcoin.
Favorable Crypto Regulations: Recent developments in U.S. crypto policies are boosting confidence in Bitcoin as a store of value.
On-Chain Strength: Network health (hash rate, wallet activity, HODL behavior) remains strong, signaling long-term bullishness.
🔍 Technical Levels to Watch
Zone Price Range (USD)
Support 1 $117,000
Support 2 $115,000
Resistance 1 $119,500–$120,000
Resistance 2 $123,000–$125,000
A close above $120K could initiate a bullish breakout targeting $125K–$130K.
A fall below $117K may invite a deeper pullback toward $115K or even $111K in the short term.
🔄 Market Sentiment
Neutral-to-Bullish in the short term.
Strong Bullish in the long-term due to adoption, policy support, and demand.
Investors are cautiously optimistic, awaiting stronger volume and breakout confirmation.
🎯 Outlook Ahead
Short-Term View: Consolidation between $117K–$120K likely to continue unless a strong volume breakout occurs.
Medium-Term View: A confirmed move above $120K may push BTC toward new highs of $130K–$138K.
Risk Zone: If Bitcoin fails to hold $115K, it could enter a corrective phase down to $111K.
✅ Summary
Bitcoin is currently in a sideways consolidation phase, with strong support around $117K and resistance just below $120K. The broader outlook remains positive, but the market is waiting for a fresh trigger—either a breakout above $120K or a breakdown below $115K—for the next decisive move.