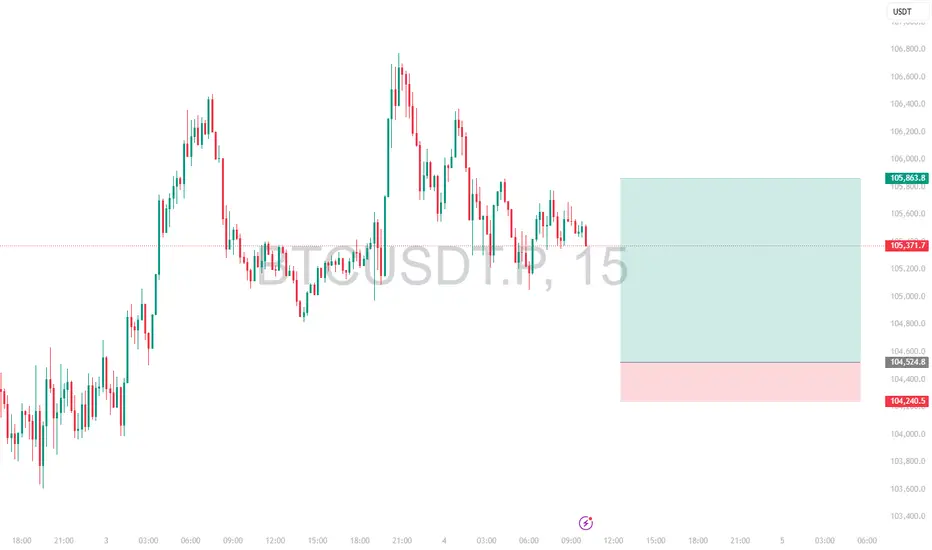
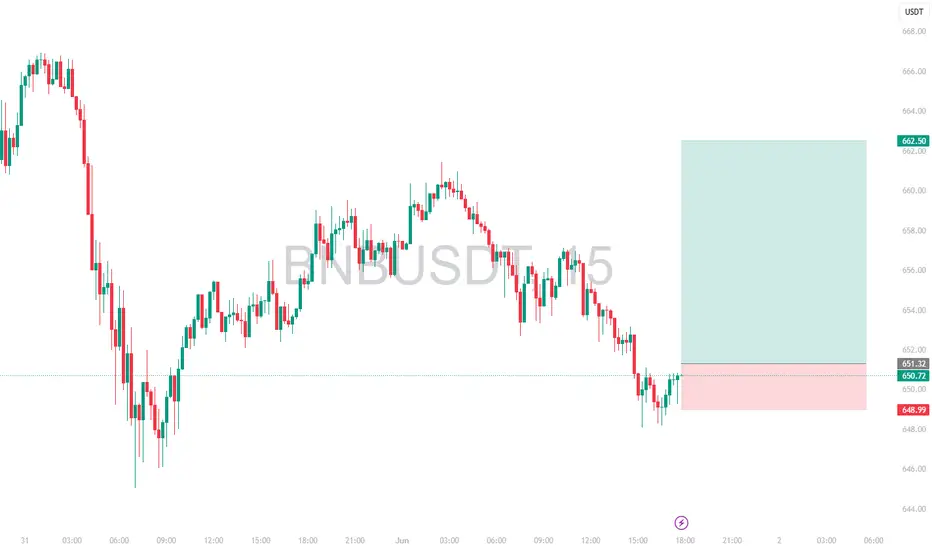
Intraday Long Setup | June 4th 2025 | Valid Until Daily ClosePrice is retracing to a strong pivot zone (marked by the red box).
Structure remains bullish with potential for continuation after pullback.
The green box represents a high-probability long opportunity with tight risk control.
Watch for price reaction within the red zone. Entry only if confirmation (e.g., bullish engulfing, strong wick rejections) appears.
The setup expires at end of the daily candle close.
Intraday
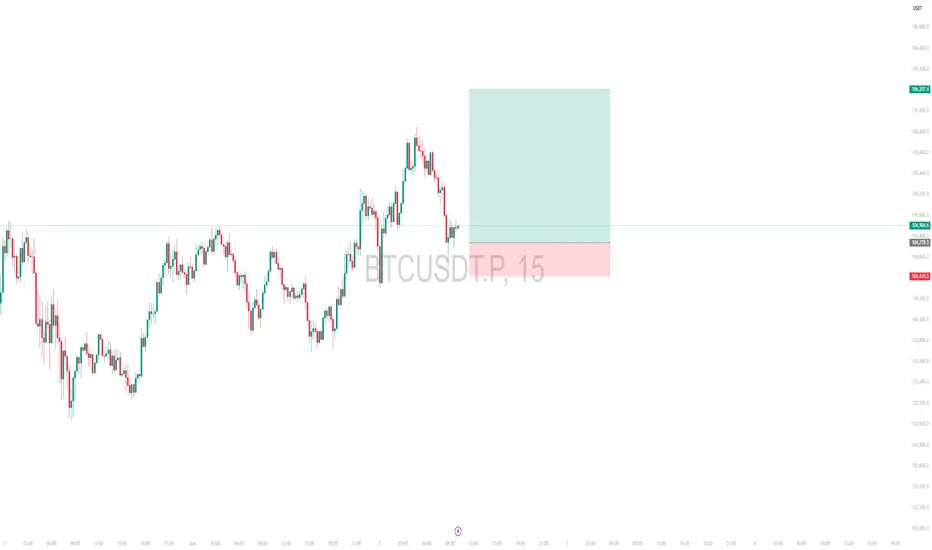
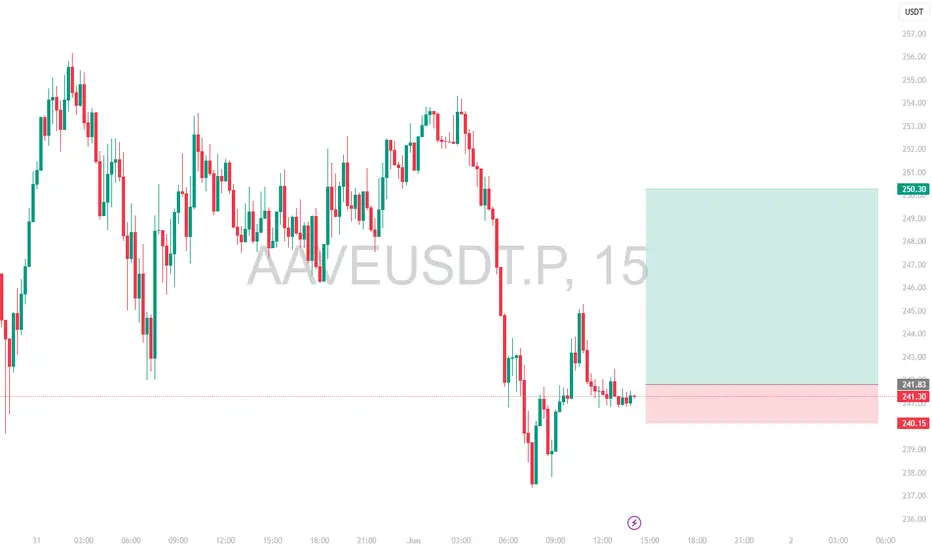
Intraday Long Setup | June 2nd 2025 | Valid Until Daily ClosePrice is retracing to a strong pivot zone (marked by the red box).
Structure remains bullish with potential for continuation after pullback.
The green box represents a high-probability long opportunity with tight risk control.
Watch for price reaction within the red zone. Entry only if confirmation (e.g., bullish engulfing, strong wick rejections) appears.
The setup expires at end of the daily candle close.
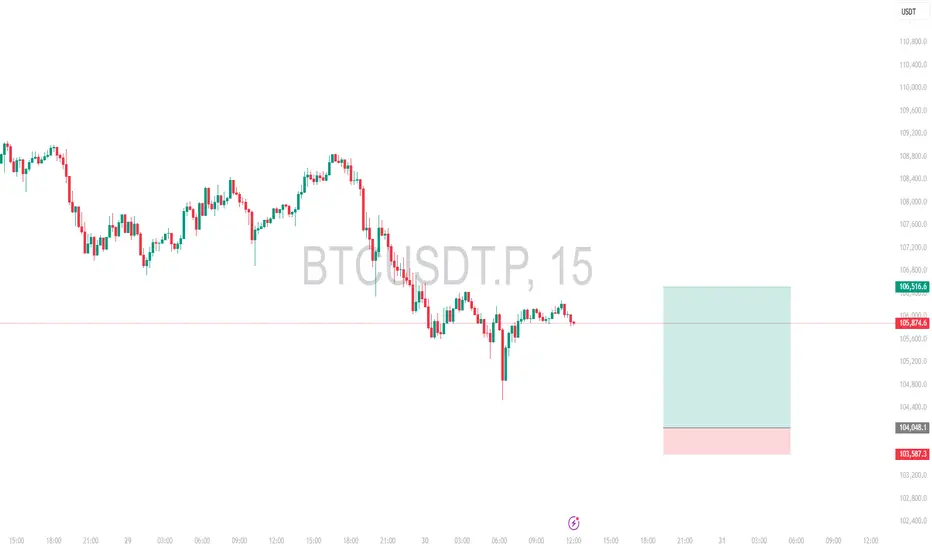
Intraday Long Setup | June 1st 2025 | Valid Until Daily ClosePrice is retracing to a strong pivot zone (marked by the red box).
Structure remains bullish with potential for continuation after pullback.
The green box represents a high-probability long opportunity with tight risk control.
Watch for price reaction within the red zone. Entry only if confirmation (e.g., bullish engulfing, strong wick rejections) appears.
The setup expires at end of the daily candle close.

Intraday Long Setup | June 1st 2025 | Valid Until Daily ClosePrice has retraced to a strong pivot zone (marked by the red box).
Structure remains bullish with potential for continuation after pullback.
The green box represents a high-probability long opportunity with tight risk control.
Watch for price reaction within the red zone. Entry only if confirmation (e.g., bullish engulfing, strong wick rejections) appears.
The setup expires at end of the daily candle close.
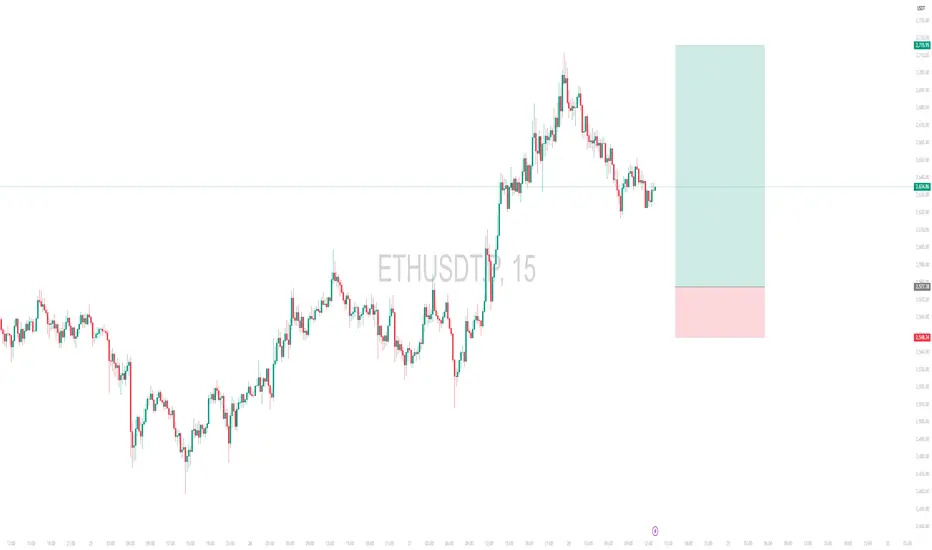
Intraday Long Setup | May 30th 2025 | Valid Until Daily ClosePrice is retracing to a strong pivot zone (marked by the red box).
Structure remains bullish with potential for continuation after pullback.
The green box represents a high-probability long opportunity with tight risk control.
Watch for price reaction within the red zone. Entry only if confirmation (e.g., bullish engulfing, strong wick rejections) appears.
The setup expires at end of the daily candle close.
Nifty trading idea for short term💡 📊
Nifty 50
Resistance: 25080
Support: 24700 at 20 DMA
Bank Nifty resistance: 55900
#Nifty #BankNifty #Intraday #trading #breakoutstocks

Intraday Long Setup | May 28th 2025 | Valid Until Daily ClosePrice is retracing to a strong pivot zone (marked by the red box).
Structure remains bullish with potential for continuation after pullback.
The green box represents a high-probability long opportunity with tight risk control.
Watch for price reaction within the red zone. Entry only if confirmation (e.g., bullish engulfing, strong wick rejections) appears.
The setup expires at end of the daily candle close.
XAUUSD Technical View 29 May 2025Hi,
I am sharing my view on gold for intraday.
Disclaimer: This is only for educational purpose.
Thanks

BTCUSDT.P | Intraday Short Setup | 26th May 2025Price is pushing into a key pivot based resistance area (highlighted in red).
Looking for a clean rejection with a 1R move to secure partials, then possible continuation toward lower levels.
Managing risk tightly as structure unfolds.

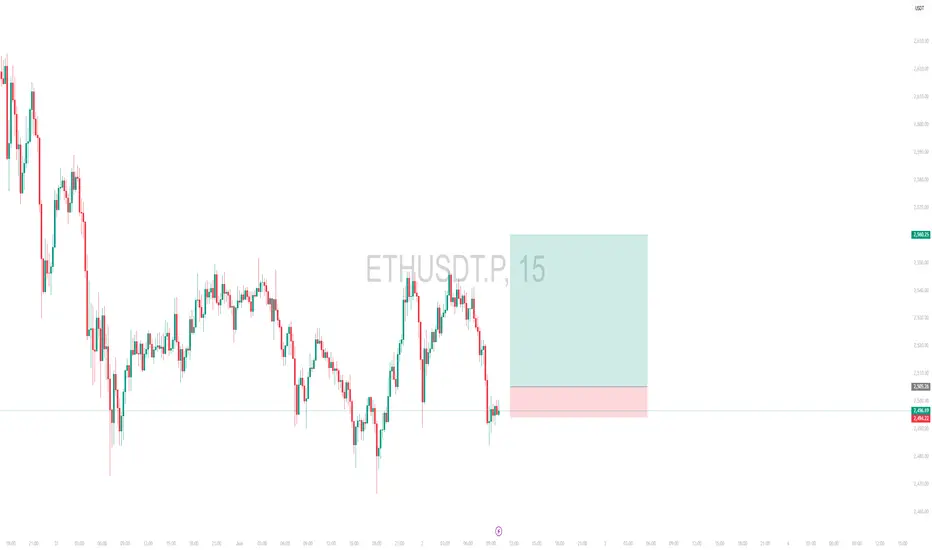
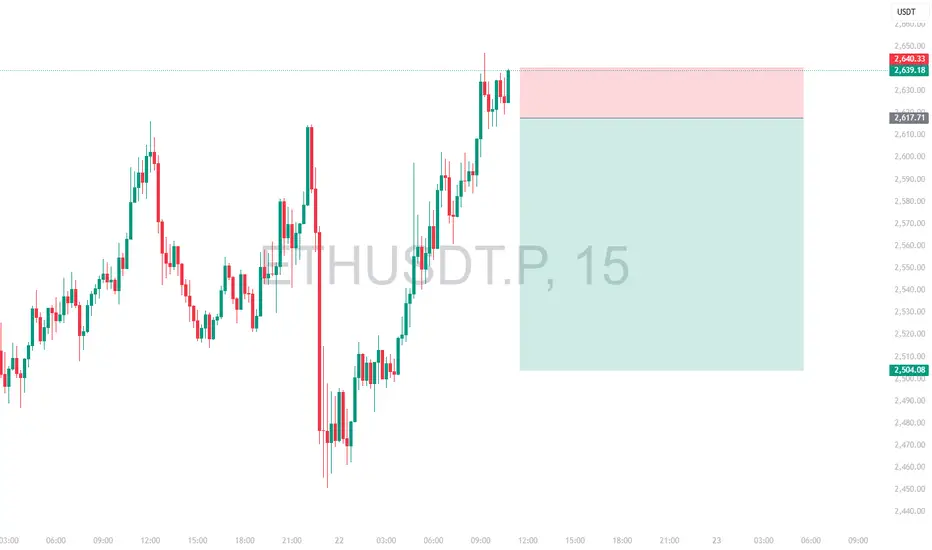
Intraday Short Setup | May 26th 2025 | Valid Until Daily ClosePrice has pushed into a potential intraday Pivot supply zone (red box) where sellers may step in. This trade is based on the expectation of a rejection from this area.
Entry: Red box — a short entry zone aligned with overhead supply
Stop Loss: Above the red zone (invalidates the setup)
Target: Green box — area to consider partial/full exit based on momentum
ETHUSDT has shown a strong bounce but is now approaching a key pivotal resistance zone
Risk-reward is favorable with a tight invalidation and clean downside target
Price may stall or reverse near the red box, creating short opportunity
Note:
This is an intraday trade idea that expires at 00:00 UTC (Daily Candle Close). Re-evaluate the setup if price remains indecisive near the entry zone close to that time.
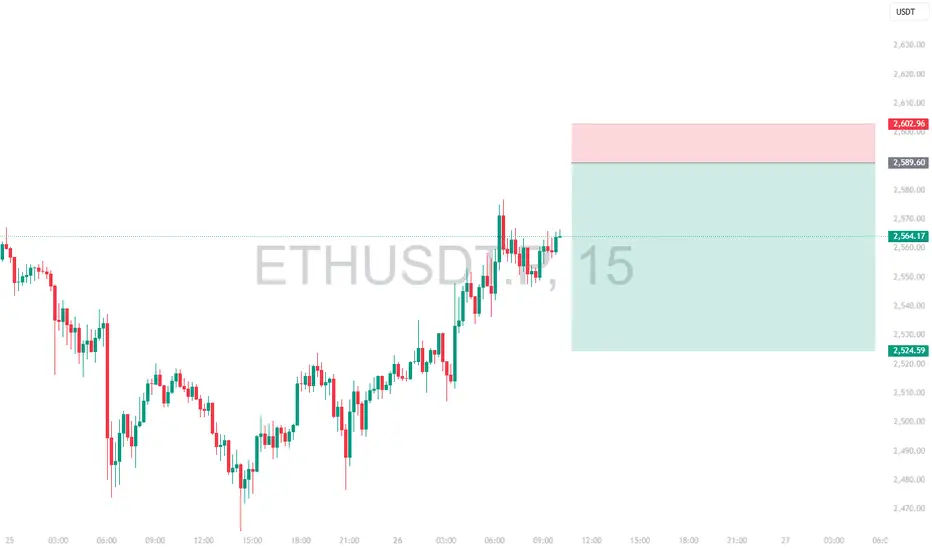
Intraday Short Setup | May 22nd 25 | Valid Until Daily ClosePrice has pushed into a potential intraday Pivot supply zone (red box) where sellers may step in. This trade is based on the expectation of a rejection from this area.
Entry: Red box — a short entry zone aligned with overhead supply
Stop Loss: Above the red zone (invalidates the setup)
Target: Green box — area to consider partial/full exit based on momentum
ETHUSDT has shown a strong bounce but is now approaching a key pivotal resistance zone
Risk-reward is favorable with a tight invalidation and clean downside target
Price may stall or reverse near the red box, creating short opportunity
Note:
This is an intraday trade idea that expires at 00:00 UTC (Daily Candle Close). Re-evaluate the setup if price remains indecisive near the entry zone close to that time.
KRBL GOOD TO STUDYNSE:KRBL
Good to keep on the radar
Always respect SL & position sizing
========================
Trade Secrets By Pratik
========================
Disclaimer
NOT SEBI REGISTERED
This is our personal view and this analysis
is only for educational purposes
Please consult your advisor before
investing or trading
You are solely responsible for any decisions you take on the basis of our research.

Max Financial - Positional Short SetupCMP 1305 on 02.05.25
In the last 2 months, the stock price has increased by around 30%. This time forming a double top-like pattern. If the price is rejected from these levels, a bearish move may come ahead.
If the price remains below the 1300 levels, targets of 1245/1210 and 1165 may be seen.
One should wait for the confirmation for a short setup, while considering risk management.
The setup fails if the price sustains above 1330.
All these illustrations are only for learning and sharing purposes, not a trading recommendation. It is only for paper trading.
All the best.

AUDNZD 2H Chart Analysis – Trendline Break + Supply Zone Rejecti🧾 Market Context:
Pair: AUDNZD
Timeframe: 2H (2-Hour)
Overall Bias: Bearish
Setup Type: Trendline Break → Lower High Formation → Supply Zone Retest → Bearish Continuation
📊 Technical Breakdown:
🔸 1. Trendline Break:
A steep ascending trendline has been broken decisively, marking a clear end of bullish structure.
This shift indicates that buyers have lost control and bears are stepping in.
🔸 2. Retest of Supply Zone (Breaker Block):
After breaking the trendline, price retraced into a supply zone (highlighted in grey).
This zone also acts as a breaker block – price broke support, and now it’s acting as resistance.
Rejection from this area confirms institutional selling pressure.
🔸 3. Lower High Formation:
The price failed to break back above the supply zone, forming a lower high, which is a classic bearish market structure signal.
Trendline retest + supply zone rejection together give confluence.
🔸 4. Bearish Projection Path:
Your chart outlines a clear path of expected price movement:
Minor bounce from intermediate demand (1.0780–1.0790)
Continuation downward toward final target zone at 1.0650–1.0660
🔽 Entry & Trade Plan:
Parameter Details
Entry Area 1.0820 – 1.0840 (confirmed rejection)
Stop Loss Above 1.0855 (above the supply zone high)
Target 1 1.0770 – 1.0780 (intermediate demand zone)
Target 2 1.0650 – 1.0660 (major demand zone)
RR Ratio Around 1:3 to 1:4 depending on entry
✅ Bearish Confluences:
✅ Trendline break + retest
✅ Supply zone rejection
✅ Lower high formation
✅ Bearish engulfing candle post-retest
✅ Clear break of structure (BOS)
✅ Liquidity sweep above previous high before dumping
⚠️ Invalidation Criteria:
If price closes above 1.0855 on a 2H/4H candle, it invalidates the bearish setup.
In that case, reanalyze for potential continuation or false breakout.
📈 Visualization Path:
🔹 Current price is consolidating slightly below the retest zone.
🔹 You anticipate a drop to intermediate support, possible small bounce, then continuation to major target.
🧠 Professional Summary:
This is a textbook bearish trend reversal setup:
Break of bullish trendline
Supply zone retest and rejection
Structure shift to lower lows/lower highs
Bearish order flow developing
If momentum follows through, your TP at 1.0650 is very realistic.

25 April Nifty Trade zone#Nifty50 #option trading
99% working trading plan
👉Gap up open 24282 above & 15m hold after positive trade target 24362, 24520
👉Gap up open 24282 below 15 m not break upside after nigetive trade target 24188 , 24070
👉Gap down open 24188 above 15m hold after positive trade target 24282 , 24362
👉Gap down open 24188 below 15 m not break upside after nigetive trade target 24072, 24948
💫big gapdown open 24072 above hold 1st positive trade view
💫big Gapup opening 24362 below nigetive trade view
Trade plan for education purpose I'm not responsible your trade
More education follow & support me
📌 koi bhi trade leval se 20 point ke sl ke bhina karan nahi hi
📌 koi trade app activate tabhi karana hota hi level pe 2 candle uper ya niche closing aati hai to
📌 leval par Ane pe turant trade plan na kare ...
📌 Full risk apaki hi hi meri nah

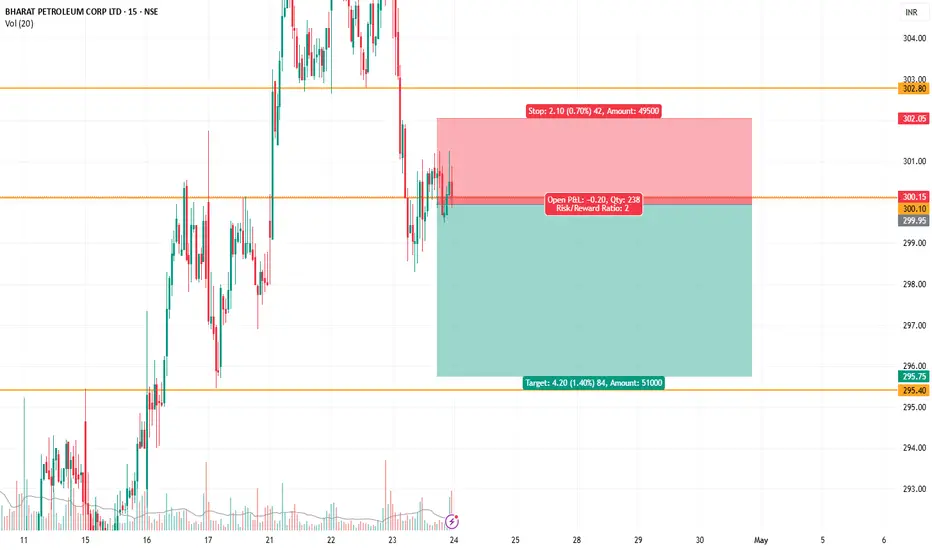
BPCL shorting oppurtunity - Intraday/SwingBPCL has fomed an HNS pattern on 15 mins time frame and is now forming a bearish flag patten. The entry tgt and SL are mentioned in the chart.
HCLTECH-INTRADAY-LONGStock is forming Ascending tringle in 1hr chart. Good opportunity to go long if it opens flat.
Ignore if it opens below 1405, if gap up wait for retest at 1426.
Please don't forget click on follow button so you won't miss any upcoming ideas.
Any confusion, feel free to drop msg. Happy to help :)
This is only for educational purpose, please manage your risk accordingly.

GMBREW Sell Trade with 1:8 RRGMBREW Sell Trade with 1:8 Risk to Reward.
Simple buyer - seller psychology based trade.
Retail buyers got trapped, in a down-trending stock which can fuel next downwards move.
Follow for more such setups.

ULTRACEMCO-4hr/1day Long tradeThe stock has corrected within the recent fall and fully recovered. Almost trading near ATH.
Current high has tested multiple times.
On next trading session it has to open above 11400 good opportunity for long, if gap down avoid.
Any confusion, feel free to drop msg. Happy to help :)
This is only for educational purpose, please manage your risk accordingly.

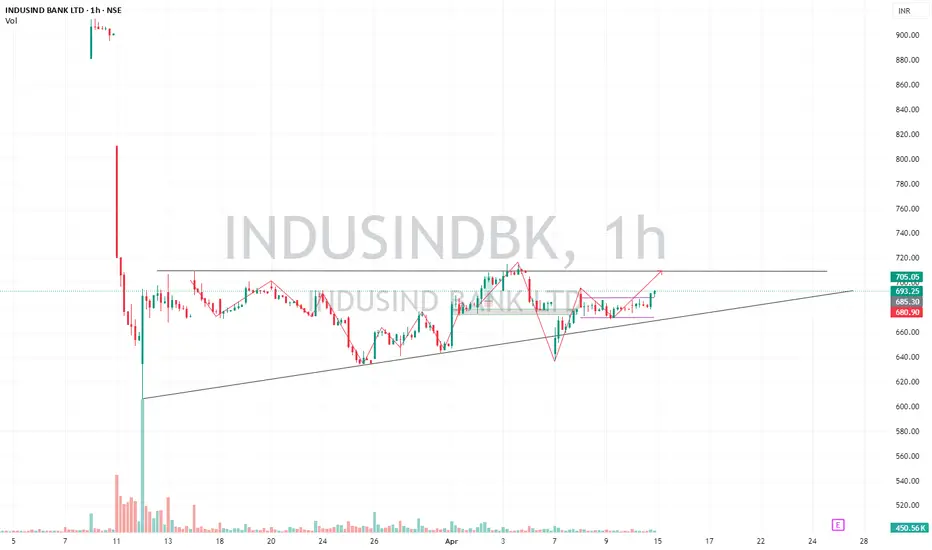
INDUSINDBK-Intraday/short term positional After the big fall, stock is consolidating from last month.
It has formed Ascending tringle pattern. From past 2 days i.e. 8th and 9th April 2025. It is trading in range. which states that buyers are accumulating.
It has potential to move if it opens between 692-700. It may go sideways for one more day it is a good opportunity for Long Intraday/short term positional trade.
If it opens 666, avoid.
Any confusion, feel free to drop msg. Happy to help :)
This is only for educational purpose, please manage your risk accordingly.
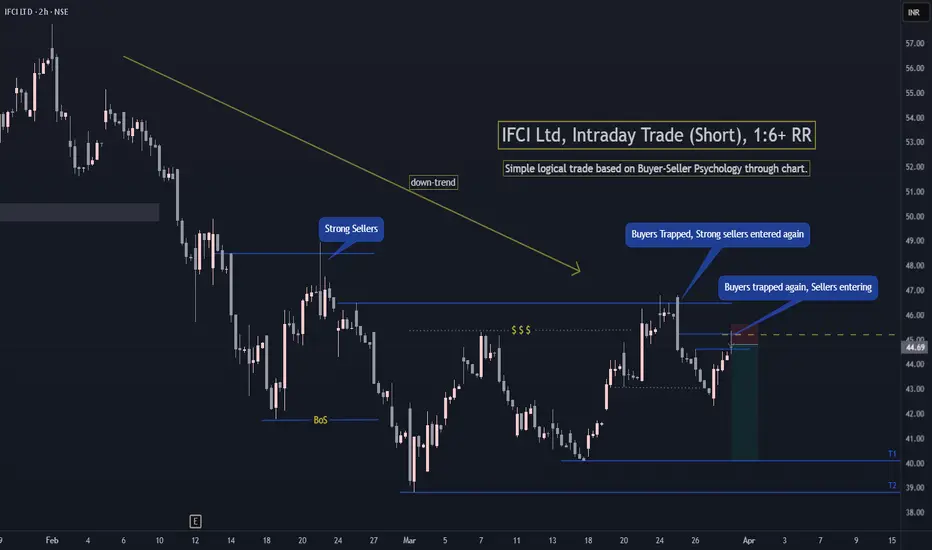
IFCI Intraday Trade (Short)IFCI is in down-trend and sellers have again trapped the buyers in discount zone. So there are high chances of price moving to Target 1 if Nifty is not very much bullish in coming sessions.
Simple trade based on buyer-seller psychology understanding. 1:6+ RR Trade.
If you have any questions. Do ask in comments.
Follow for more such simple and awesome setups. Thanks. Happy trading!