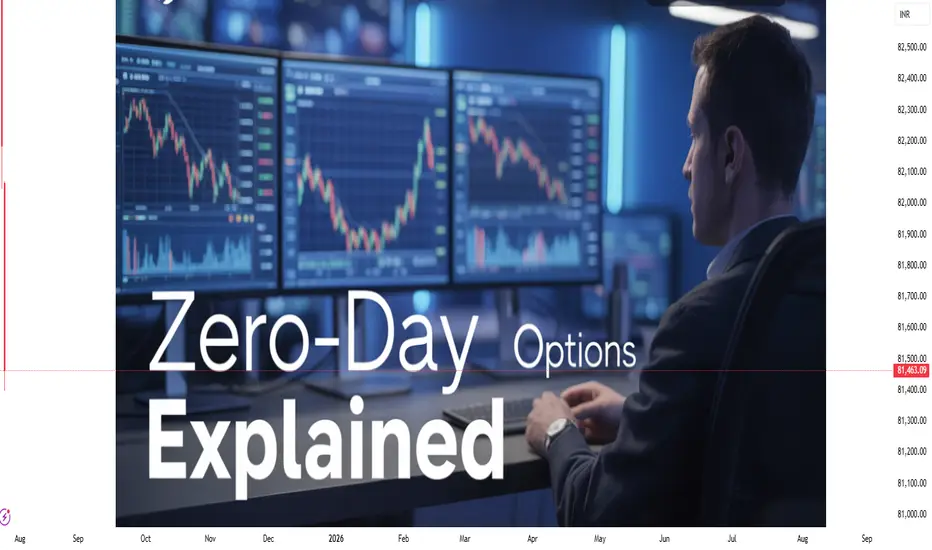
Zero-Day Options (0DTE)🔍 What Are Zero-Day Options (0DTE)?
The term “0DTE” stands for Zero Days to Expiration. These are options contracts that expire on the same day you buy or sell them.
In simple words, if today is Thursday and you’re trading a weekly Nifty or BankNifty option that expires today — you're trading a 0DTE option.
This type of option:
Has no time left beyond today.
Is highly sensitive to price movement.
Is extremely risky and extremely rewarding.
Earlier, we only had Thursday expiry for weekly options. But now, due to growing popularity, exchanges have introduced:
Nifty 50 expiry: Monday to Friday (Daily)
Bank Nifty expiry: Tuesdays and Thursdays
Fin Nifty expiry: Tuesdays
Sensex expiry: Fridays
This means 0DTE trading can now happen almost every day!
📈 Why 0DTE Trading Has Become So Popular
Zero-Day Options are now one of the most actively traded instruments — both by retail and institutional traders. Here’s why:
1. Small Premiums, Big Potential
Since the option expires today, its price (premium) is very low — sometimes just ₹5 or ₹10. If the market moves in your favor, that ₹10 option can quickly become ₹50 or ₹100.
That’s a 5x to 10x return, sometimes in just 15-30 minutes.
2. No Overnight Risk
You’re in and out the same day. No gap-ups, no global tension ruining your position overnight.
3. Scalping Friendly
Perfect for intraday traders who don’t want to hold positions for long.
4. Lots of Movement Near Expiry
Prices jump fast because time is running out. This gives more opportunities — but also more chances to get trapped.
5. Better Tools & Platforms
With modern brokers offering real-time data, scalping tools, and fast execution — more traders are trying 0DTE.
💼 How Do 0DTE Options Work?
Let’s take a simple example:
Today is Thursday, and Nifty is trading around 22,000.
You think it will rise, so you buy a 22,100 Call Option (CE) at 11 AM for ₹15.
If Nifty rises 50 points in the next 30 minutes, your option may become ₹45.
That’s 200% return.
But… if Nifty remains flat or falls, your option may go to ₹0 by the end of the day.
What Makes Them Move So Fast?
There are 3 reasons:
Time Decay (Theta): Since it's the last day, every minute that passes reduces the option's value if there's no movement.
Volatility: Even small market moves can cause big percentage changes in premium.
Greeks Sensitivity: Delta, Gamma, and Vega — all move faster near expiry.
🔁 Most Common 0DTE Strategies
1. Directional Option Buying
Buy a Call or Put based on price action.
Works best when there's momentum or breakout.
Example: Buy 22,100 CE at ₹10 → Nifty moves up → Exit at ₹50.
👍 High reward
👎 High risk (can go to zero)
2. Straddle/Strangle Selling (Non-Directional)
Sell both Call and Put at the same or nearby strikes.
You win if the market stays in range.
Example: Sell 22,000 CE and 22,000 PE → Market closes at 22,000 → Both go to zero.
👍 Profit from time decay
👎 If market breaks out in any direction, huge loss
3. Iron Condor
Sell OTM Call and Put spreads to capture decay in a defined range.
Lower risk, but also lower return.
👍 Safer than naked straddle
👎 Limited reward
4. Scalping with 1-2 Candle Momentum
Monitor breakouts on 1-min or 3-min chart.
Take quick entries and exits with small quantities.
👍 Quick gains
👎 Requires sharp execution and discipline
🏦 Who Uses 0DTE — Institutions or Retail?
🔹 Institutions:
Use algos to sell options in range.
Make profit from premium decay.
Use 0DTE to hedge portfolios or capture intraday IV changes.
🔹 Retail Traders:
Use for quick profits or gambling.
Often go for cheap out-of-the-money options.
Tend to overtrade without understanding risk.
⚠️ Risks Involved in 0DTE Trading
Let’s be honest — 0DTE options are not safe for everyone.
Here are the major dangers:
1. Time Decay (Theta Burn)
Every minute, the option loses value unless the market moves.
2. Fast Premium Erosion
Flat markets = quick loss. A ₹10 option can go to ₹0 in 15 minutes.
3. No Margin for Error
You need to be right on direction, timing, AND speed. All three.
4. Emotional Stress
Prices jump fast. Without discipline, you’ll end up revenge trading.
5. Overtrading
Traders often re-enter after loss without a plan — increasing risk.
🎯 Real-World Example of a 0DTE Trade
Let’s say it's Tuesday, and you’re trading BankNifty (expires today).
10:00 AM: BankNifty at 47,200
You buy 47,300 CE at ₹12
10:30 AM: BankNifty jumps 80 points
Your CE becomes ₹42
You exit — 250% return
But…
If BankNifty remained flat or dropped, that ₹12 option may go to ₹3 or even ₹0.
Same day. Same strike. Two opposite outcomes.
💡 Tips for Beginners to Trade 0DTE Safely
Start with Small Capital
Never risk your full capital on one trade.
Set Hard Stop-Loss
Exit if your option loses 40-50%. No second thoughts.
Trade in Breakout Zones
Avoid choppy ranges — they kill premiums.
Watch Open Interest + Price Action
See where the buyers/sellers are active.
Trade First Hour or Last Hour
That’s when you get big movements and clear setups.
Avoid Trading Just for Fun
0DTE is not for boredom. It’s for precision and skill.
Do Not Hold Till 3:30 PM
If you’re an option buyer, premiums usually die in the last 15 minutes.
🧠 Should You Trade 0DTE Options?
✅ YES — if:
You have solid technical analysis
You understand risk management
You can stick to a strict plan
You are okay with losing 100% on a bad trade
❌ NO — if:
You are emotionally reactive
You don’t track charts closely
You trade with borrowed or large capital
You don’t know how option Greeks work
🏁 Final Words
Zero-Day Options are not just another strategy. They are a whole new mindset of trading.
If used with the right knowledge, strict rules, and patience, they can become a powerful weapon in your trading toolbox. But if misused, they are the fastest way to drain your account.
Respect the instrument. Learn the rules. Start small. Scale with confidence.
Intradaytrading
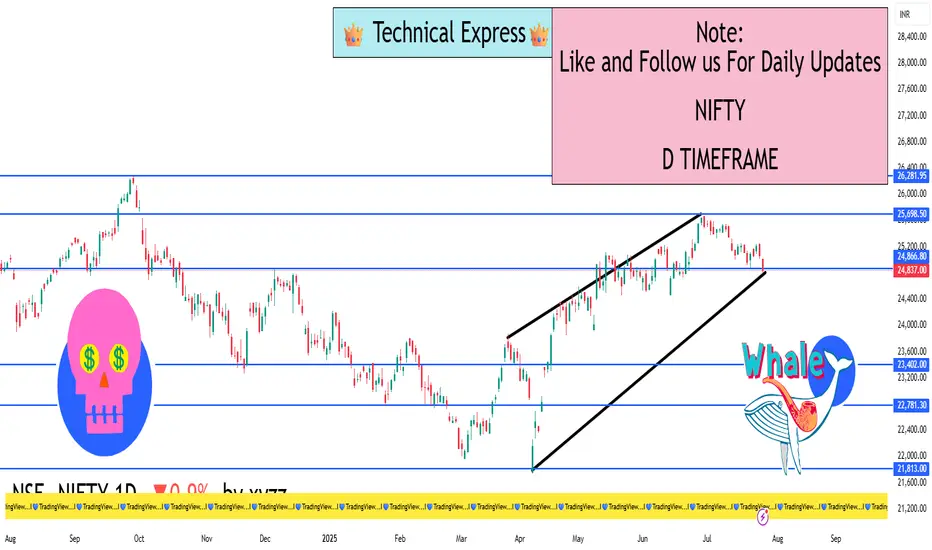
NIFTY 1D Timeframe📉 Nifty 1D Snapshot (as of July 25, 2025)
Previous Close: 25,062
Opening Price: 25,010
Intraday High: 25,010
Intraday Low: 24,806
Closing Price: 24,833
Change: Down by approximately 230 points (–0.9%)
🕯️ Candlestick Pattern (Daily Chart)
A clear bearish candle was formed today.
The index opened flat, tested the previous day’s low, and faced selling pressure all day.
Closing is near the day’s low, which shows weakness and no buying support at lower levels.
🔍 Support & Resistance Levels
Level Type Price Range
Immediate Resistance 25,000 – 25,050
Immediate Support 24,800 – 24,750
Next Support Zone 24,650 – 24,600
If Nifty breaks below 24,800, expect a move toward 24,650.
If it reclaims 25,000, a minor pullback or bounce could occur.
📊 Technical Overview
Short-Term Trend: Bearish
Medium-Term Trend: Neutral
Structure: Lower highs forming; prices struggling to hold key supports
Indicators (Typical Behavior):
RSI likely near 50 – neutral but leaning bearish
MACD may have crossed downward
Moving averages (like 5 & 20-day) likely showing bearish crossover
🧠 Market Sentiment Factors
Broad-based sectoral weakness led the fall – especially financials, IT, auto, and energy.
Major stocks like Reliance, HDFC Bank, Infosys, and Bajaj twins contributed heavily to the decline.
Investor mood remains cautious due to:
Weak earnings from select companies
Foreign investor outflows
Global uncertainty (interest rates, trade deals, etc.)
✅ Trading Strategy Insights
For Swing Traders:
Avoid long trades unless there’s a strong reversal candle from 24,750–24,800 zone.
Shorting near 25,000 resistance could offer low-risk entries.
For Intraday Traders:
Watch for consolidation between 24,800–25,000.
Play range until a breakout or breakdown occurs.
For Breakdown Traders:
A confirmed break below 24,750 can lead to quick dips toward 24,600 or lower.
📌 Summary
Nifty dropped 230 points, forming a strong bearish candle.
Bears are in control unless bulls reclaim 25,000+.
Support sits at 24,800, with downside potential toward 24,650–24,600 if broken.
Sentiment remains cautious; short-term trend is bearish.
Trading Master Class With Experts.
🔶 Who Are These "Experts"?
The “experts” in a trading master class are usually:
✅ Professional traders working with institutions, hedge funds, or prop firms
✅ Full-time independent traders with consistent profit history
✅ Option Greeks and derivatives specialists
✅ Technical and price action experts
✅ Economists and market analysts
They are people who have traded for years, been through different market cycles, and know what works and what fails in the real market.
🔷 What You Will Learn in a Trading Master Class With Experts?
Here is a detailed breakdown of what such a master class includes:
🧠 1. Trading Mindset & Psychology Mastery
“90% of trading is mindset, not charts.”
Experts teach you:
How to control emotions like fear, greed, FOMO
How to build discipline, patience, and consistency
How to handle losses without revenge trading
How to develop a winning mindset like a hedge fund trader
📊 2. Advanced Technical Analysis (Beyond Indicators)
Forget about just MACD, RSI, Bollinger Bands.
Experts teach:
Price Action Secrets
Multi-timeframe analysis
Structure-based trading (HH, HL, LL, LH)
Breakout vs Fakeout patterns
Volume analysis and hidden traps
🎯 You’ll learn to predict moves with logic, not luck.
📈 3. Institutional Concepts (Smart Money Approach)
This is a core part of the class. You will learn how institutions trade, including:
Liquidity Zones & Order Blocks
Stop Loss Hunting Techniques
Fair Value Gaps (FVG)
Break of Structure (BOS)
Mitigation Blocks
Imbalance trading
You’ll finally understand:
"Why price reverses after breakout?”
"Why your stop loss gets hit and then the market moves in your direction?”
Experts teach you how to track institutional footprints and follow their logic.
📉 4. Derivatives & Options Trading Mastery
For advanced traders, especially in India (Nifty/Bank Nifty), the class covers:
✅ Options Chain Interpretation
✅ Open Interest (OI) Strategy
✅ Option Greeks (Delta, Gamma, Theta, Vega)
✅ Directional & Non-Directional Trading
✅ Intraday Option Scalping Techniques
✅ Straddles, Strangles, Spreads, Iron Condors
✅ Event-based strategies (Budget day, RBI day, earnings)
Live examples are shown using tools like Sensibull, QuantsApp, TradingView.
🔐 5. Risk Management Like Professionals
Trading without risk control is gambling.
In the master class, you’ll learn:
Position Sizing Models
Risk-to-Reward (RRR) Strategies
How to protect capital in volatile markets
Importance of trade journaling
When not to trade (which is as important as trading)
🎯 You’ll be taught how to think like a fund manager, not a gambler.
🧾 6. Trading Plan and Strategy Building
By the end of the class, you will have your own trading system, built with guidance from the experts.
Includes:
Entry and exit rules
Setup confirmation techniques
Trade management
Backtesting
Live trading practice
🎯 You’ll no longer depend on Telegram groups or paid signals. You will have your own tested edge.
💡 7. Live Market Sessions and Analysis
One of the most powerful parts of a master class is live sessions with experts, where you:
✅ Watch experts analyze the market in real-time
✅ Learn how they decide trades
✅ Ask questions on-the-spot
✅ See how they manage losses and winners
✅ Get live updates on index, stocks, options strategies
This removes confusion like:
“Should I buy or sell now?”
“Is this a trap or breakout?”
🔧 8. Tools, Platforms & Market Scanners Training
Learn to use:
TradingView Pro with institutional indicators
Option Analytics Tools (Sensibull, Opstra, Quantsapp)
Volume & Order Flow Tools
How to read market depth (Level 2 data)
How to use backtesting software for strategy building
🎯 The goal is to make you fully independent and tool-savvy.
📁 What’s Included in a Master Class Package?
A typical premium expert trading master class includes:
📌 20-30 hours of recorded sessions
📌 Weekly live sessions (Q&A, market review)
📌 Real trade examples (screenshots or live trades)
📌 Market homework and trade journaling
📌 Access to private trading communities
📌 Lifetime access + updates
📌 Strategy PDFs, cheat sheets
📌 Certificate of Completion (optional)
🔑 Benefits of Taking This Master Class
✅ Get direct mentorship from people who actually trade
✅ Save years of trial & error
✅ Learn real strategies, not just theory
✅ Increase accuracy and reduce losses
✅ Learn why you lose money and how to fix it
✅ Build discipline, process, and patience
✅ Join a community of focused traders
👨🏫 Who Should Join?
This class is perfect for:
Traders who lose consistently and don’t know why
Those who want to learn institutional-style trading
Option traders who want to become premium sellers / scalpers
People ready to invest time and discipline—not chasing “quick money”
Anyone who wants to turn part-time trading into serious skill
🔁 Real Case Example:
Imagine a Bank Nifty trader who always loses during breakouts. He joins the master class.
He learns:
How institutions create false breakouts
How to identify order blocks & liquidity grabs
How to position sell options around key zones
How to protect his capital with hedging and RRR control
Now, instead of gambling, he trades with confidence and understands what’s happening behind the candles.
🎓 Final Words
A Trading Master Class With Experts is like getting a direct map to reach consistent profitability in the market.
It is not a magic formula, but it trains your brain to think like a professional, trade like an institution, and manage risk like a fund.
It teaches you to focus not on tips, indicators, or chasing, but on:
Process
Discipline
Data
Edge
Execution.

Institutional Objectives in Options Trading🔷 What Are Institutions in the Market?
Before diving into their objectives, let’s first understand who institutions are:
Institutions are large, professional organizations that trade in the financial markets using massive amounts of capital. These include:
Mutual Funds
Hedge Funds
Pension Funds
Insurance Companies
Investment Banks
FIIs (Foreign Institutional Investors)
Proprietary Trading Firms
These players account for over 80-90% of daily turnover in options markets like NSE’s Bank Nifty and Nifty. Unlike retail traders, they don’t trade emotionally or randomly. Every move they make has a calculated reason behind it.
🎯 Why Do Institutions Use Options?
Options are powerful tools. Institutions don’t just trade them for direction; they use options to achieve multiple objectives:
✅ 1. Hedging Portfolios
🔍 Objective:
To protect their large equity/futures holdings from adverse market movements.
Institutions have huge long-term positions in stocks or indices. If the market falls sharply, these positions can suffer big losses. So, they use PUT options to hedge.
📈 Example:
A pension fund holds ₹500 crore worth of Nifty 50 stocks.
It buys Nifty 50 PUT Options at 22,000 strike.
If market crashes, the loss in stocks is offset by profit in PUTs.
📌 Result: Limited downside, peace of mind, capital protection.
✅ 2. Generating Additional Income (Option Writing)
🔍 Objective:
To generate consistent income from existing holdings through Covered Calls, Cash-secured Puts, or Iron Condors.
Institutions write options (sell) to earn premium—especially in sideways markets.
💡 Examples:
Covered Call: Own Reliance shares + Sell OTM Call option to earn income.
Short Strangles: Sell far OTM Put and Call if volatility is high.
Iron Condor: Sell call/put spreads to profit from time decay.
📌 Result: Generates passive income with controlled risk.
✅ 3. Arbitrage and Spread Trading
🔍 Objective:
To lock in risk-free or low-risk profits through price inefficiencies.
Institutions use Calendar Spreads, Box Spreads, or Volatility Arbitrage to exploit inefficiencies in option pricing.
🔧 Example:
Calendar Spread: Buy Nifty 22500 CE in August, sell Nifty 22500 CE in July.
Profit from IV differences or time decay.
📌 Result: Non-directional trading, but consistent profits with high capital.
✅ 4. Taking Directional Bets With Defined Risk
🔍 Objective:
To take high-conviction trades without exposing entire capital like futures.
Institutions use Debit Spreads, Straddles, or Long Options for directional views with limited risk.
💡 Example:
If expecting a bullish breakout, they might:
Buy 22000 CE
Sell 22200 CE
It caps both risk and profit. Perfect for risk-managed directional exposure.
📌 Result: Risk-defined entry into market trends without using futures.
✅ 5. Volatility Trading (Not Price Trading)
Institutions often trade volatility, not just price direction. They use Straddles, Strangles, Calendar Spreads to play IV.
💡 Example:
If implied volatility is low and an event is coming (like RBI policy):
Buy Straddle (ATM Call + Put)
Expect IV spike or a big move
📌 Result: Profit from volatility expansion or collapse, even if price stays in a range.
✅ 6. Managing Fund Exposure / Risk Neutralizing
Large funds have multiple exposures—options help them balance and adjust their overall risk (Delta-neutral, Vega-neutral, etc.).
They regularly:
Adjust positions using Gamma scalping
Balance portfolio Delta using options
Reduce Vega risk in high IV periods
📌 Result: A smooth, hedged, and controlled portfolio with minimal exposure to wild market moves.
✅ 7. Creating Synthetic Positions
Sometimes, instead of using equity or futures, institutions use options to replicate or create synthetic trades.
💡 Example:
Buy Call + Sell Put = Synthetic Long Future
Sell Call + Buy Put = Synthetic Short
This helps institutions:
Avoid STT, slippage
Better margin use
Higher flexibility with position sizing
📌 Result: Capital efficiency and strategic execution
📈 How to Spot Institutional Activity in Options?
You can decode institutional movement using these tools:
🔸 1. Open Interest (OI) Analysis
Spike in OI with price action = smart money at work
Build-up of OI near a strike = possible resistance/support zone
Use tools like Sensibull, Opstra
🔸 2. Volume + Price Movement
Sudden spike in volume in far OTM options = Institutional hedging or setup
Buy-Sell flow data shows positioning
🔸 3. Put-Call Ratio (PCR)
Used to detect market sentiment and institutional net positioning
🔸 4. IV Charts / Skew
Institutional volatility strategies are visible through steep IV skew or unusual IV changes
🔐 Final Thoughts
Institutional trading in options is not speculation. It is a scientific approach to manage:
Capital exposure
Risk control
Income generation
Volatility protection
Their objectives are not just to win trades, but to:
Protect capital
Optimize returns
Stay profitable in all market conditions

Technical Class🧠 Why Learn Technical Analysis?
Because price is king.
All news, fundamentals, and economic data are already reflected in price. Technical analysis teaches you how to read price charts and anticipate movements—giving you the timing advantage.
Institutions, traders, and even algorithms rely heavily on technical levels. So if you want to:
Know when to enter/exit
Understand where big money is active
Manage risk smartly
Improve accuracy
…you need strong technical skills.
🔍 What Will a Good Technical Class Cover?
Let’s break this into 10 structured modules, explained in human-friendly language.
📘 1. Basics of Price Action
What is a chart? (Line, Bar, Candlestick)
Understanding OHLC (Open, High, Low, Close)
Why price is the most important factor
How price creates support, resistance, and trends
👉 Outcome: You’ll read any chart confidently.
📘 2. Candlestick Patterns
Single candlesticks: Doji, Hammer, Engulfing, Marubozu
Dual & triple candle patterns: Morning Star, Evening Star, Three Soldiers
Reversal vs Continuation patterns
👉 Outcome: You’ll know how to identify potential trend reversals or strength.
📘 3. Chart Patterns (Price Structures)
Reversal Patterns: Double Top/Bottom, Head and Shoulders
Continuation Patterns: Triangles, Flags, Pennants, Rectangles
Understanding Breakouts vs Fakeouts
👉 Outcome: You’ll recognize market structures and act before the move begins.
📘 4. Support and Resistance Mastery
How to identify major support/resistance levels
Role of historical price zones
Dynamic support/resistance using moving averages
Price reaction techniques
👉 Outcome: You’ll place entries and exits at the most strategic levels.
📘 5. Trend Analysis
What is a trend? (Uptrend, Downtrend, Sideways)
How to draw trendlines correctly
Role of higher highs & lower lows
Using Multiple Timeframe Analysis
👉 Outcome: You'll align trades with major trends like professionals do.
📘 6. Indicators & Oscillators
Moving Averages (SMA, EMA): Trend confirmation
RSI: Overbought/Oversold signals
MACD: Momentum and divergence detection
Bollinger Bands: Volatility breakout
Volume Profile / VWAP
👉 Outcome: You’ll combine indicators for confluence and higher accuracy.
📘 7. Intraday Technicals
Best indicators for intraday (VWAP, Supertrend)
Time-based chart usage (5m, 15m, 1hr)
Institutional trap zones (fakeouts, liquidity sweeps)
Scalping vs momentum setups
👉 Outcome: You’ll confidently take trades within the day using fast setups.
📘 8. Risk Management and Trade Psychology
Position sizing
Risk-Reward ratio planning
Importance of Stop Loss
Emotional control: Fear, Greed, Impatience
Creating a rule-based system
👉 Outcome: You’ll trade stress-free, without blowing up your capital.
📘 9. Advanced Institutional Concepts
Smart Money Concepts (SMC): Liquidity, Order Blocks, BOS/CHOCH
Institutional Order Flow: Where big money trades
Volume Spread Analysis
Wyckoff Theory (Accumulation/Distribution phases)
👉 Outcome: You’ll learn how institutions move the markets and how to follow them.
📘 10. Strategy Building and Backtesting
Creating rule-based strategies
Journaling trades and analyzing results
Backtesting on historical data
Live market application with confidence
👉 Outcome: You’ll develop your own strategy and remove guesswork.

Institutional Order Flow / Smart Money Concepts🚀 What is Institutional Order Flow?
Institutional Order Flow simply means tracking how big players are placing their buy and sell orders, and using that data to trade alongside them — not against them.
Big players can’t enter or exit in one go. If they do, they’ll move the market too much. So they:
Split their orders
Use liquidity zones
Create traps and fakeouts to fill their orders
Your job as a retail trader is to spot these footprints.
💡 Why is it Important?
Most retail traders:
Follow indicators
Chase breakouts
React late
Institutions:
Create liquidity traps
Use retail mistakes to enter their positions
Push price into zones that force emotional trading
By understanding Institutional Order Flow or Smart Money Concepts, you’ll stop being the one getting trapped—and start trading with the whales.
🔍 Key Concepts of Smart Money / Institutional Order Flow
Let’s now break down the core principles and tools.
1. Liquidity Zones
Institutions need liquidity — meaning many buyers or sellers to fill their orders.
They create fake breakouts, stop hunts, or news spikes to force retail traders to enter or exit — and then they do the opposite.
Example:
Price breaks above resistance — retail buys breakout
Institutions sell into that liquidity
Price reverses sharply = retail gets trapped
Your job: Identify where liquidity is sitting (above highs, below lows).
2. Breaker Blocks
A breaker block is an OB that failed, but now acts as the opposite side’s zone.
Example:
Price breaks bullish OB and comes back → now it acts as support.
Same with bearish OB → becomes resistance.
These show who is now in control — buyers or sellers.
3. Market Structure Shifts (MSS)
Smart money tracks structure, not indicators.
A Market Structure Shift happens when:
The trend breaks (HH → LL or LL → HH)
A new direction is confirmed
Institutions often wait for MSS before executing large orders.
Your job: Don’t jump in early. Wait for structure change to confirm smart money is switching sides.
4. Fair Value Gap (FVG)
An FVG is a price imbalance between candles — where price moved too fast, leaving a “gap” in liquidity.
FVG means:
A zone where institutions might revisit
Often gets “filled” later
Use for entries, targets, or rejections
How to spot: In a strong move, look between the first candle’s high and the third candle’s low (or vice versa) – this is your FVG.
5. Internal vs External Liquidity
Institutions use both:
External Liquidity = above highs / below lows (stop-loss areas of retail traders)
Internal Liquidity = inside the range (consolidation, breaker retests)
They:
Grab external liquidity
Fill internal orders
Then move price in their actual direction
This explains why breakouts fail — they were designed to!
🔁 Typical Smart Money Price Flow (Simple)
Accumulate (Sideways range)
Manipulate (Fake breakout or stop hunt)
Distribute (Strong move in real direction)
If you know this sequence, you can start trading the traps, not falling for them.
🛠 How to Trade Smart Money Concepts – Step by Step
Let’s bring it all together in a logical workflow:
✅ Step 1: Analyze Market Structure
On higher timeframes (1H, 4H, Daily), check:
Trend (bullish/bearish)
Breaks in structure (HH/LL change)
Are we in consolidation?
✅ Step 2: Identify Key Zones
Mark:
Order blocks (the last opposite candle before big move)
FVGs (imbalances)
Equal highs/lows (liquidity)
Swing points (for stop hunts)
✅ Step 3: Wait for Liquidity Grab
Watch for:
Wicks above highs or below lows
Aggressive moves into zones
Quick rejections
These are signs smart money is active.
✅ Step 4: Confirmation
MSS: Wait for structure to shift
Candle Confirmation: Engulfing, Break of structure candle
FVG Fill or OB tap
Only enter when confluence builds — not just one clue.
✅ Step 5: Risk-Managed Entry
Entry: After confirmation near OB or FVG
SL: Just outside OB/FVG
TP: Next liquidity zone or opposite OB
Always maintain minimum 1:2 RR.
😱 Common Mistakes Retail Traders Make
Trading breakouts blindly
Entering before confirmation (no MSS or candle clue)
Ignoring structure for indicators
Thinking OB is one candle – it's a zone
No patience – chasing price instead of letting price come to you
🎯 Why Institutions Need You to Lose
Yes — if you lose, they win.
Your stop-loss is their entry liquidity
Your breakout buy is their exit plan
Your emotional trading funds their smart entries
That's why they manipulate, trap, and fake moves to create liquidity.
But with knowledge of Institutional Order Flow — you flip the script.
💬 Final Thoughts
Institutional Order Flow / Smart Money Concepts aren’t a secret strategy — they’re simply a deeper understanding of how the market actually works.
Instead of being manipulated, you become the one who reads the manipulation.
It’s not about predicting the market — it’s about reacting to what smart money is doing, with patience, precision, and process.
SENSEX 1D Timeframe✅ Key Index Data:
Current Level: ~82,200 (as of early afternoon)
Opening: Around 82,780
Day’s High: 82,784
Day’s Low: 82,047
Previous Close: 82,726
Intraday Change: Down ~520 points (–0.63%)
🔍 Market Behavior (1-Day Time Frame)
Opening Session: The Sensex opened flat but slightly negative, quickly slipping below 82,600 as traders booked profits from recent highs.
Mid-Morning Session: The index continued to slide, breaching key support levels near 82,200–82,100.
Support Zone Tested: Sensex touched a low of around 82,047 before bouncing slightly.
Volatility: The index remained volatile due to global weakness and profit-booking in large-cap stocks.
🧠 Technical Insight (1-Day Chart Perspective)
Level Type Range (approx.)
Resistance 82,700 – 82,800
Support 82,000 – 82,050
Trend Bias Weak / Bearish
RSI (1D est.) Around 45–50 (neutral-to-weak zone)
Market Mood Cautious to bearish
📉 What’s Causing the Decline Today?
Weak IT and Banking Stocks: Both sectors are under pressure due to poor Q1 guidance and weak global cues.
Profit Booking: Investors are trimming positions after recent highs, leading to broad-based selling.
Global Uncertainty: Mixed international signals and concerns over trade policies are affecting sentiment.
Lack of Strong Domestic Triggers: No major positive domestic news to support buying.
🎯 What to Watch Next
Short-Term Trend: Watch if Sensex can hold above 82,000. If broken, more downside toward 81,800–81,500 is possible.
Upside Resistance: If recovery comes, resistance will be strong near 82,700–82,800.
Sector Focus: Banks, IT, and auto are likely to drive further movement.

Technical Class🎯 What is a “Technical Class”?
A Technical Class is a structured learning session or course designed to teach technical analysis – the skill of forecasting price movement in financial markets based on charts, price patterns, indicators, volume, and historical data.
It’s one of the most essential skillsets for traders and investors, especially those involved in stock trading, intraday trading, swing trading, options, forex, or crypto.
📘 Purpose of a Technical Class
The main goal of a technical class is to train participants to:
Read and analyze price charts confidently
Use indicators and tools to generate buy/sell signals
Recognize institutional footprints and volume patterns
Make independent, logic-based trading decisions
Avoid emotional or speculative trades
🧱 What Topics Are Covered in a Technical Class?
✅ 1. Chart Reading Basics
Candlestick types (Doji, Hammer, Engulfing, Marubozu)
Price vs. Volume relationship
Support & Resistance levels
Timeframes: Intraday (5m/15m), Positional (1D/1W)
✅ 2. Price Action Trading
Trend structure: HH-HL / LH-LL sequences
Breakouts & Fakeouts
Supply-Demand zones
Liquidity traps
✅ 3. Technical Indicators
Trend Indicators: Moving Averages (SMA/EMA), MACD
Momentum Indicators: RSI, Stochastic, CCI
Volume Indicators: VWAP, OBV, Volume Profile
Volatility Indicators: Bollinger Bands, ATR
✅ 4. Chart Patterns
Continuation Patterns: Flags, Pennants, Triangles
Reversal Patterns: Head & Shoulders, Double Top/Bottom, Wedges
Range Patterns: Rectangles, Channels
✅ 5. Support & Resistance Mastery
Dynamic (Moving averages, trendlines)
Static (Horizontal S/R, Round numbers)
Institutional S/R zones with Volume & OI
✅ 6. Trend Analysis
Identifying Bullish, Bearish, and Sideways markets
Role of Volume in confirming trends
Using Dow Theory and Market Structure
✅ 7. Advanced Concepts
Divergence (Price vs. RSI/MACD)
Multi-Timeframe Analysis (MTA)
Fibonacci Retracement & Extensions
Chart psychology (why price behaves irrationally)
🧠 Skills You Gain from a Technical Class
How to time entries and exits based on confirmation
How to avoid false breakouts
When to use indicators and when to trust price action
How to combine volume + price for high-probability setups
How to align with smart money and institutional footprints
🎓 Who Should Attend a Technical Class?
✅ New traders wanting a strong foundation
✅ Intraday and swing traders aiming for consistency
✅ Investors looking to time entry/exit better
✅ Option traders who want to read chart behavior
✅ Crypto/forex traders who rely on pure price movement
📈 Real-World Applications
Identify trend reversals before they happen
Spot breakouts with volume confirmation
Align trades with institutional positioning
Reduce overtrading and increase accuracy
Make data-backed decisions, not emotional guesses
⚠️ Common Mistakes Covered in a Technical Class
❌ Overuse of indicators (indicator overload)
❌ Trading without stop-loss
❌ Misreading breakouts and breakdowns
❌ Ignoring volume and confirmation
❌ Lack of patience or plan in trade execution
🔚 Final Thoughts
A Technical Class is more than just learning chart patterns — it’s about understanding how the market thinks, how price reacts, and how you can trade in sync with logic, not emotion.
Whether you're into stocks, futures, options, or crypto — a strong technical foundation increases your edge, reduces losses, and boosts confidence.

Nifty 50 Intraday Plan for July 23, 2025📌 For more insights & live explanations,
👉 Visit my YouTube channel – Click the icon above ☝️
🔺 Bullish Zones (Call Side - CE):
25,138 – Positive Trade View Start
If the market sustains above this level for 10 minutes, the sentiment turns positive.
Possible intraday up-move.
Look for CE entries.
25,260 – CE Entry Level
Strong confirmation of bullish breakout.
Entry point for aggressive CE buyers.
25,380 – Short Covering Zone
If price closes above this, short-sellers may exit in panic.
Expect a sharp up-move / breakout.
24,960 & 25,040 – CE Hold Zones
If holding CE positions, monitor these levels.
Supportive price areas where bulls may defend.
24,760 – Safe CE Zone
A very strong support zone.
If price bounces from here, good for fresh CE trades.
🔻 Bearish Zones (Put Side - PE):
25,120 – Negative Trade View
If price breaks this level and stays below 10 mins, bias turns bearish.
25,018 – Opening R1 PE Hold
Below this, market may gain bearish strength.
Short trades may get active.
24,938 – PE Hold Level
Important support zone.
Break here can give aggressive PE momentum.
24,700 – Unwinding Level
If price sustains below this, it can trigger long unwinding.
Strong bearish continuation expected.

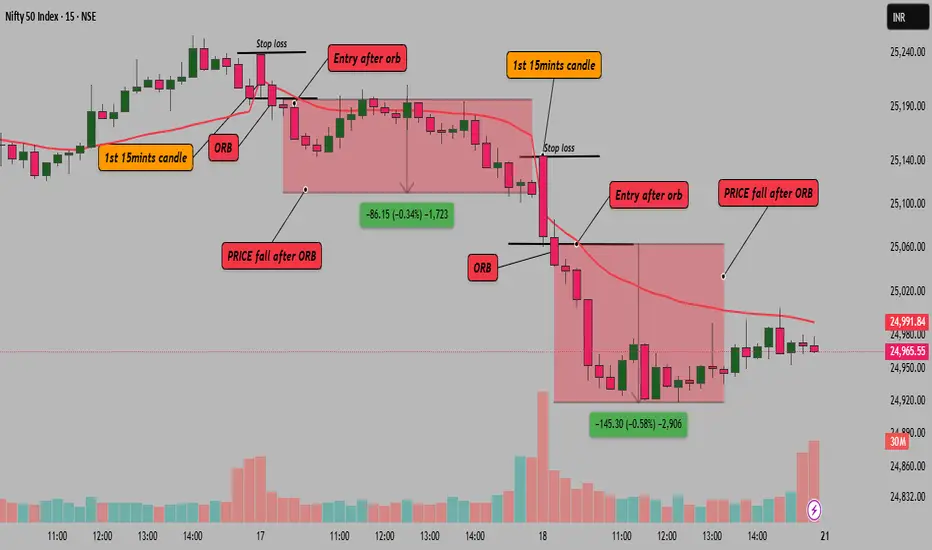
Opening Range Breakdown – Intraday Bears’ Favorite Setup!Hello Traders!
Today, let’s explore one of the most reliable setups for intraday traders – the Opening Range Breakdown (ORB) . This strategy is widely used by professional traders to catch early downside momentum when the market shows weakness right after opening. If executed correctly, it offers quick profits and tight risk management. Let’s break down how it works and how to trade it with confidence.
What is Opening Range Breakdown (ORB)?
The ORB strategy focuses on the first 15 to 30 minutes of market open . The idea is to mark the high and low of this initial range and look for a breakdown below the low – which signals bearish pressure. This setup works best on volatile days or when there’s negative sentiment in global cues.
Mark the Opening Range:
Track the high and low of the first 15 or 30 minutes of the market open.
Wait for a Breakdown Candle:
Look for a strong bearish candle closing below the opening range low with rising volume.
Enter on Confirmation:
Take a short entry just below the breakdown candle with stop-loss above the opening range high.
Target Previous Day’s Support or VWAP:
Your exit target could be based on previous day’s support, VWAP, or risk-reward ratio like 1:2.
Volume Confirmation is Key:
Avoid low volume breakdowns. Strong volume is what separates real breakdowns from fake-outs.
Ideal Conditions for ORB
Gap Down Open or Weak Global Cues – ORB works well when sentiment is already negative.
High Beta Stocks or Indices like BankNifty – These respond sharply to breakdowns.
No Major Support Below the Breakdown Level – Clean charts increase trade reliability.
Risk Management Tip
Keep your position size small and risk predefined. Don’t chase entries. Let the candle confirm the breakdown and only then execute.
Conclusion:
ORB is a favourite among experienced traders due to its simplicity and effectiveness. If you’re an intraday bear looking for high-probability setups, Opening Range Breakdown is something you must master.
Have you used ORB before? Let me know your experience or results in the comments!
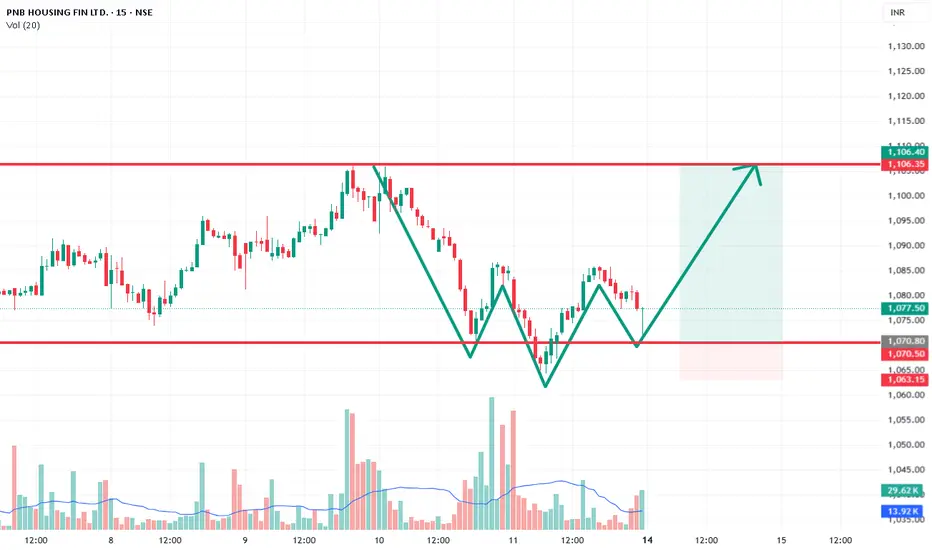
Intraday : PNBHOUSING for 3.3% UpsidePNBHOUSING
Inverse head & shoulder pattern should be perform in this counter with 15 min time frame.
Take entry near 1070
Target 1106
Strong SL : 1063
Target will be 3.3% and SL will be only 0.7% so it will be best deal.
dont forget to watch on Monday morning.
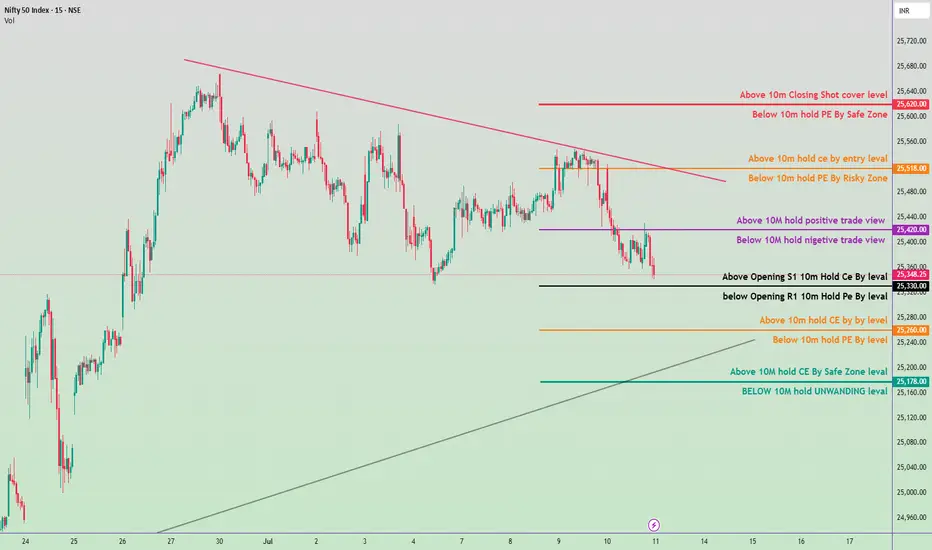
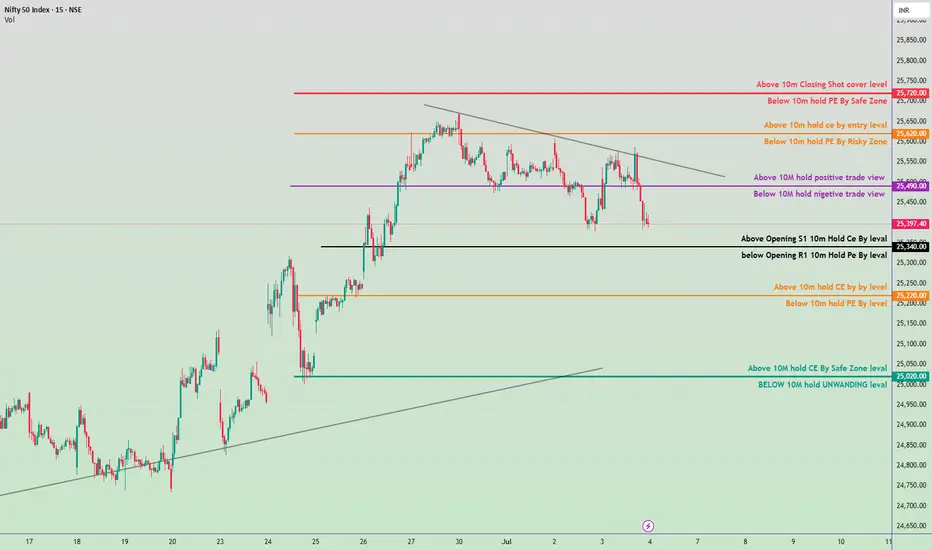
Nifty 50 Intraday Trade Plan 11 july 2025🔴 Resistance & Shorting Zones:
25,620.00
🔹 Above 10m Closing = Short Cover level
🔹 Below 10m = PE by Safe Zone
25,518.00
🔹 Above 10m = Hold CE by Entry level
🔹 Below 10m = PE by Risky Zone
25,420.00
🔹 Above 10m = Hold Positive Trade View
🔹 Below 10m = Negative Trade View
⚖️ Neutral / Opening Zone:
25,348.25 (CMP)
🔸 Above Opening S1 = Hold CE by Level
🔸 Below Opening R1 = Hold PE by Level
🟠 Intermediate Support/Resistance:
25,260.00
🔸 Above 10m = Hold CE by Level
🔸 Below 10m = Hold PE by Level
🟢 Support & Unwinding Zones:
25,178.00
🔹 Above 10m = CE by Safe Zone
🔹 Below 10m = Unwinding Level
📌 Summary:
A move above 25,420 may shift view to bullish/intraday CE hold.
Below 25,260 suggests weakness, possible PE play.
Major support at 25,178, breakdown below this might trigger heavy unwinding.
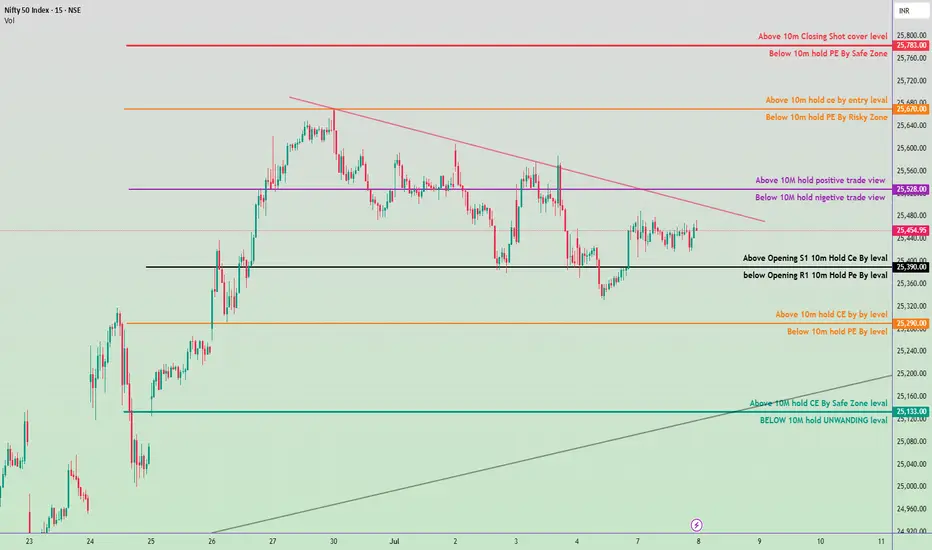
NIFTY 50 INTRADAY PLAN – 08 July 2025✅ Bullish Scenario (Call Option / CE Buy Plan):
Above 25,390:
Above Opening S1 – 10m Hold CE By Level
Initiate CE buy with caution.
Above 25,528:
Above 10M Hold – Positive Trade View
Strong bullish sentiment, hold CE confidently.
Above 25,670:
Above 10m Hold CE – Entry Level
CE enters Safe Zone, trend continuation expected.
Above 25,783:
Above 10m Closing – Short Cover Level
Big breakout possible, short covering rally.
🔻 Bearish Scenario (Put Option / PE Buy Plan):
Below 25,390:
Below Opening R1 – 10m Hold PE By Level
Start looking for PE (Put) trades.
Below 25,290:
Below 10m Hold PE By Level
Further downside expected, weakness builds.
Below 25,133:
Below 10M Hold – Unwinding Level
Strong selling / unwinding zone, big downside move likely.
🧠 Important Levels to Watch:
Trend Resistance Zone: 25,528 – 25,670
Support Zone: 25,290 – 25,133
Breakout Zone: Above 25,783
Breakdown Zone: Below 25,133
⚠️ Quick Notes for Traders:
📈 Above 25,528 = Positive view, hold CE
📉 Below 25,390 = Negative view, hold PE
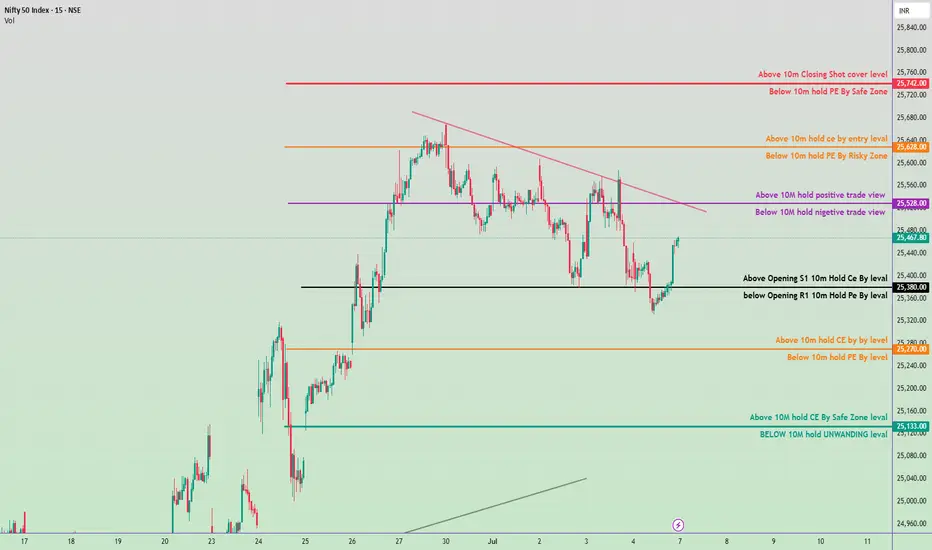
Nifty 50 Intraday Trade Plan - 7 July 2025✅ Bullish Zones (Call Option - CE Buy Levels):
Above 25,133 ➤ Hold CE by Safe Zone level
Above 25,270 ➤ Hold CE by key level
Above 25,380 ➤ Opening S1 Breakout – Hold CE
Above 25,528 ➤ Positive Trade View (10M volume base)
Above 25,628 ➤ Entry level for CE holding
Above 25,742 ➤ Closing Shot – Cover Short Positions
🔻 Bearish Zones (Put Option - PE Buy Levels):
Below 25,133 ➤ Unwinding Level – Hold PE
Below 25,270 ➤ Key level – Hold PE
Below 25,380 ➤ Opening R1 Breakdown – Hold PE
Below 25,528 ➤ Negative Trade View
Below 25,628 ➤ Risky Zone for holding PE
Below 25,742 ➤ Safe Zone for holding PE
🔁 Trendline & Structure Notes:
Downtrend resistance visible around 25,528–25,628 zone.
If price breaks above trendline and sustains, expect bullish momentum.
Support near 25,133 and strong base seen around 25,000 zone.
Nifty 50 Intraday Trade Plan for July 4, 2025🔼 Bullish (Call Option / CE Buy Strategy)
✅ Zone 1: Above 25,490
If Nifty holds above 25,490 for 10 minutes, sentiment turns positive.
This is the first sign of bullishness. You can initiate CE positions with caution.
✅ Zone 2: Above 25,620
Holding above 25,620 for 10 minutes = entry confirmation for CE buy.
This is a riskier zone but indicates bullish breakout strength.
✅ Zone 3: Above 25,700
If Nifty sustains or closes above 25,700, short covering may start.
This is a safe zone for CE buyers with strong momentum.
🔽 Bearish (Put Option / PE Buy Strategy)
🚫 Zone 1: Below 25,490
Holding below 25,490 for 10 minutes turns view negative.
Suitable to initiate PE trades cautiously.
🚫 Zone 2: Below 25,340
This is the Opening R1 level. Holding below it confirms bearishness.
Good level to enter PE with confirmation.
🚫 Zone 3: Below 25,220
Holding below this level confirms continuation of bearish move.
Another chance to buy PE if missed above.
🚫 Zone 4: Below 25,000
If Nifty breaks 25,000 and sustains below for 10 minutes:
It enters a strong unwinding zone.
Strong selling may follow.
🔁 Neutral / Flip Zones (Critical for Trend Decision)
➖ 25,340 Zone:
If Nifty stays above 25,340 for 10m, you can try CE.
If it breaks down, look for PE below 25,340.
How to Develop the ‘Next Trade is New Trade’ Mindset?Hello Traders!
One of the most powerful shifts in trading psychology is learning to treat each trade as a completely independent event . Past losses or wins shouldn’t influence your next decision. But for most traders, emotions from the last trade cloud judgment. That’s why today, we’ll dive deep into the “Next Trade is New Trade” mindset — and how to build it into your trading system.
Why This Mindset Matters
Break Free from Emotional Baggage: A bad trade can lead to revenge trading, while a good trade may bring overconfidence. This mindset helps you start fresh.
Consistency Over Drama: Great traders don’t ride emotional highs and lows. They focus on the next high-probability setup — nothing more, nothing less.
Reset Your Psychology: Like an athlete resetting between plays, traders must reset mentally between trades to stay sharp.
How to Practice the “New Trade” Approach
Use a Checklist Before Every Entry: Let your setup criteria speak — not your emotions. If your edge is present, take the trade. If not, skip it.
Don’t Chase Losses or Celebrate Wins Too Long: Journal your trade, learn from it, and move on. Don’t carry emotional residue forward.
Keep Trade Sizes Consistent: Avoid increasing risk to “make back” losses or doubling down on confidence.
Close the Tab, Clear the Mind: After closing a trade, take a 2-5 minute break. It’s a mental reset button before the next opportunity.
Rahul’s Tip
Your last trade is history. Whether it was a loss or win, it doesn’t define your next one. Focus on the process — not the outcome.
Conclusion
Developing the “Next Trade is a New Trade” mindset isn’t just a concept — it’s a skill that separates emotional traders from consistently profitable ones. Practice detachment, follow your system, and let each trade be judged only on its own merit.
Do you let your last trade influence your next? Be honest — and drop your thoughts in the comments! Let’s grow together.
Intraday Short Setup | June 27th 2025 | Valid Until Daily ClosePrice has pushed into a potential intraday Pivot supply zone (red box) where sellers may step in. This trade is based on the expectation of a rejection from this area.
Entry: Red box — a short entry zone aligned with overhead supply
Stop Loss: Above the red zone (invalidates the setup)
Target: Green box — area to consider partial/full exit based on momentum
Risk-reward is favorable with a tight invalidation and clean downside target
Price may stall or reverse near the red box, creating short opportunity
Note:
This is an intraday trade idea that expires at 00:00 UTC (Daily Candle Close). Re-evaluate the setup if price remains indecisive near the entry zone close to that time.
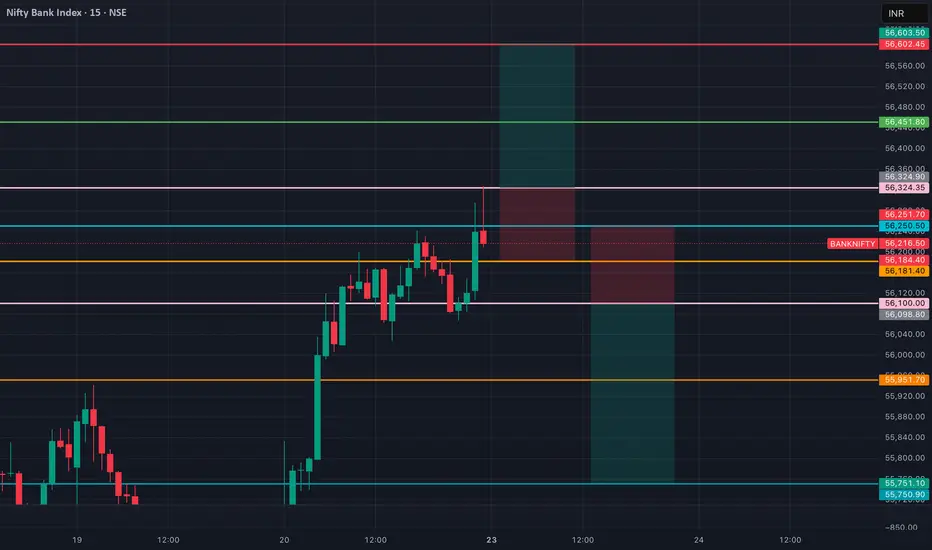
BANK NIFTY Levels for Intraday (Educational Purpose) 23/05/2025 📈 BankNifty Intraday Trade Setup – 23/06/2025 (Monday)
🕒 Timeframe: 1-Min Chart
📊 Market Sentiment: Cautiously Bullish | High Volatility Expected
🔼 Buy Above: 56,320 (sustained breakout)
🎯 Target 1: 56,420
🎯 Target 2: 56,550
🛑 Stop Loss: 56,180
⚠️ Confirm with strong volume and EMA crossover
🔽 Sell Below: 56,050 (breakdown below demand zone)
🎯 Target 1: 55,920
🎯 Target 2: 55,780
🛑 Stop Loss: 56,200
⚠️ Entry valid only after 5-min candle closes below 56,050
📍 Key Levels to Watch:
🔹 Resistance: 56,300 – 56,400
🔹 Support: 56,050 – 55,900
🔹 Demand Zone: 55,700 – 55,600
🔹 Supply Zone: 56,400 – 56,550
📌 Pro Tips for Monday:
✅ Track global cues (esp. geopolitical tensions)
✅ Use VWAP and RSI for extra confirmation
✅ No overtrading on breakout traps
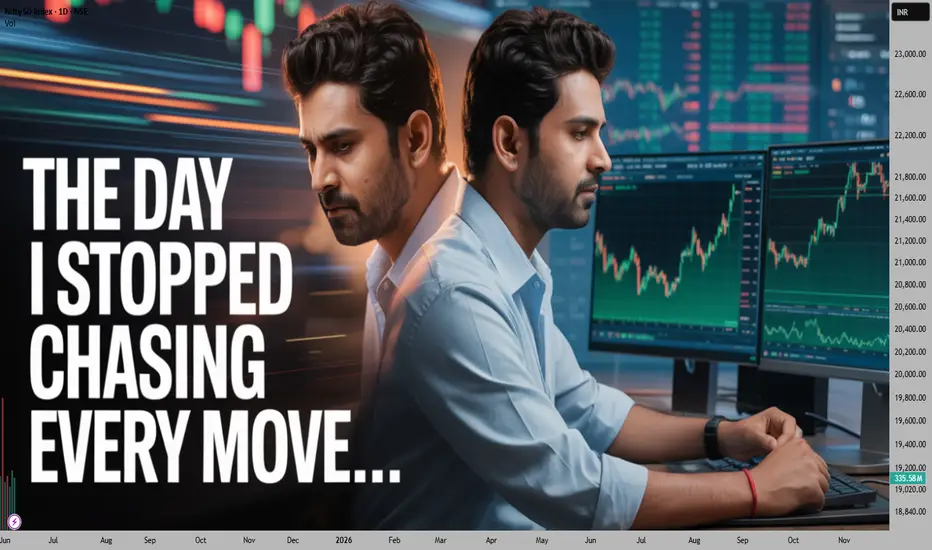
The Day I Stopped Chasing Every Move, My Trading Changed!Hello Traders!
Today I want to share something personal — a moment that quietly transformed my trading journey. I used to run after every candle, every small breakout, thinking I would miss the move if I didn’t jump in. But all it gave me was stress, overtrading, and random results.
The day I stopped chasing every move, my trades became calmer and more profitable.
Why We Chase Every Move
FOMO (Fear of Missing Out): We feel the market will move big without us.
Doubt in Own Strategy: We don’t trust our setup, so we jump into everything.
Restlessness: Sitting idle feels like wasting time.
Emotional Urge: We want quick action instead of waiting for perfect trades.
How Chasing Hurts Our Trading
Missed Good Setups: We get stuck in average trades and ignore high-quality ones.
Inconsistent Results: Wins and losses feel random.
Mental Fatigue: Watching every tick tires the mind.
No Learning Time: Back-to-back trades leave no time for review or learning.
What Changed When I Stopped Chasing
I Waited More: Took fewer but better trades.
I Became Selective: Only entered when setup matched my plan.
I Felt Peaceful: Trading didn’t feel like a race anymore.
I Gained Confidence: Fewer mistakes built stronger belief in my system.
Rahul’s Tip
If you find yourself getting tempted by every candle movement — pause.
Ask yourself, “Am I trading my setup or just chasing action?”
Wait for your edge. The calmest trader often wins the longest game.
Conclusion
Chasing every move looks exciting, but it silently kills your progress.
Once you stop doing that, trading becomes simple, focused, and powerful.
Thanks for reading!
If you found this post helpful, don’t forget to like and share it with fellow traders.
Follow for more such real-talk trading psychology and strategy content.
Intraday Long Setup | June 2nd 2025 | Valid Until Daily ClosePrice is retracing to a strong pivot zone (marked by the red box).
Structure remains bullish with potential for continuation after pullback.
The green box represents a high-probability long opportunity with tight risk control.
Watch for price reaction within the red zone. Entry only if confirmation (e.g., bullish engulfing, strong wick rejections) appears.
The setup expires at end of the daily candle close.
Intraday Long Setup | May 30th 2025 | Valid Until Daily ClosePrice is retracing to a strong pivot zone (marked by the red box).
Structure remains bullish with potential for continuation after pullback.
The green box represents a high-probability long opportunity with tight risk control.
Watch for price reaction within the red zone. Entry only if confirmation (e.g., bullish engulfing, strong wick rejections) appears.
The setup expires at end of the daily candle close.
Nifty range for make or break for momentum trade. Nifty 50 index shows a moderately bullish structure, trading near the 24800 level after breaking out from consolidation earlier this week. Momentum remains strong, supported by gains in banking, IT, and FMCG sectors. Immediate support is seen Nifty 50 is trading near the 24700 mark 📈, reflecting bullish sentiment after breaking out from a consolidation phase. The index has been supported by strong performance in Banking 🏦, IT 💻, and FMCG 🍫 sectors.
The index has immediate support at 24700, while resistance is seen near 24900 and 25080
The broader trend remains positive, but some profit-booking is possible at higher levels.
🔵 Strategy (Bullish):
If Nifty trade and sustain above 24900, buy CE (Call Option) with limited quantity 🟢 and full quantity above 25080.
🔴 Strategy (Bearish):
If Nifty breaks below 24700, buy PE (Put Option) 🔻
💡 Tip: Trade with levels, maintain discipline, and manage risk smartly — the market rewards patience and planning.
Fear of Missing Out vs Fear of Being Wrong–Which Is Destroying UHello Traders!
Today, let’s talk about something that silently eats into our trading performance — the battle between FOMO (Fear of Missing Out) and FOBR (Fear of Being Wrong) . These emotions don’t just affect your entries and exits — they define your success or failure over the long run. Let’s break it down and help you gain control.
FOMO: The Urge to Chase
Jumping in Late: You see a breakout and rush in without a plan, just because everyone else is in.
Overtrading: You take trades without confirmations, afraid of “missing the move.”
Emotional Entries: No logic, no strategy — just fear of being left behind.
FOBR: The Paralysis of Perfectionism
Can’t Pull the Trigger: You wait for 100% confirmation and miss high-quality trades.
Doubt After Entry: You second-guess your setup, cut winners too early, or shift your stop-loss too tight.
Fear of Losing Face: You’re more focused on being “right” than being profitable.
Rahul’s Tip
Both fears are destructive in their own ways. One makes you reckless, the other makes you inactive. Focus on process over perfection. Let your strategy handle decisions — not your emotions.
Conclusion
Whether you’re haunted by FOMO or FOBR , the cure lies in trusting your system, accepting losses as part of the game, and sticking to your edge. Discipline > Emotion — every single time.
Which one do you struggle with more — FOMO or the fear of being wrong? Let’s talk in the comments!
