Mahindra & Mahindra update 500 pointsmahindra and mahindra reached 500+ points from given level
📌 Please support me with your likes 🤞🏻 and comments 💬 to motivate me to share more analysis with you and share your any opinion about the possible trend of this chart with me !
Best Regards , Davis 🥰
Hit the like 🤞🏻 button to !! Motive some energy !!🥇
📌 Note :
⨻ Check the live market updates and analysis yourself before buy 📈🔺 or sell 📉🔻
⨺ Am not giving any advisory or signals its just my idea for upgrade my knowledge 📚 in trading
⨹ This is my pre and post market analysis to improve my trading journey 🚀
⨂ Am Not suggesting anyone to buy or sell ❌ am just giving my views 👀
⫸ You are responsible for your trading ✅ not me ❌ ⫷
HAPPY TRADING 🥰
Investor

Mahindra and Mahindra updatecurrently market is on extreme supply
if market breaks above 3000 we can expect level up to 3200
if else market can take a retracement for strong demand near 2800 or sell will be continued
Hit the like button to Rock !! Show some energy !!
Note :
⨻ Check the live market updates and analysis yourself before buy or sell.
⨺ Am not giving any advisory or signals its just my idea for upgrade my knowledge in trading for myself
⨹ This is my pre and post market analysis and my trading journey. Not a suggestion to buy or sell.
⫸ You are responsible for your trading not me ⫷
happy trading 🥰

OL pumped +10.59%, hitting all time high of $80.97 at 17:16UTCSOL/USDT (Solana to Tether) trading pair. Please note that I am not a financial advisor, and trading always involves risks. It's important to do your own research and make decisions based on your own analysis and risk tolerance.
Your provided information suggests a bullish outlook for SOL/USDT with a buy long recommendation. Here's a summary of your information:
Asset: SOL/USDT (Solana to Tether)
Trade Type: Buy Long (Future/Spot)
Entry Level: $86.35
Target 1: $88.00
Target 2: $90.00
Stop Loss: $82.80
It's essential to stay informed about market conditions, news, and any developments that might impact Solana's price. Also, be cautious about the volatility in the cryptocurrency market.

Gold Outlook 2024:Analyzing Bullish Trends, Key Resistance LevelBullish Bias:
Weekly chart indicates a bullish bias for Gold.
Relative Strength Index (RSI) comfortably above 50.
RSI-based 20-period Moving Average provides additional support.
XAU/USD remains within the upper half of a long-term ascending regression channel.
Key Levels:
Interim resistance at $2,060 with 61.8% Fibonacci trend-based extension.
Confirmation of support at this level could lead to a test of $2,125-$2,150.
Potential profit-taking in this range may temporarily impede the uptrend.
Further bullish targets at $2,200 and $2,440 based on Fibonacci extensions.
Sustaining above $2,200 is crucial for continued buyer interest.
Downside Support:
Strong support at $1,960-$1,950, including the 20-week SMA, 50-week SMA, and mid-point of the ascending regression channel.
Failure at this support could lead to a decline to $1,880 (100-week SMA) and $1,850 (200-week SMA).
Weekly close below $1,850 may attract additional sellers, opening the door for a move toward $1,800 (lower limit of the ascending regression channel).
Summary:
Gold is bullish with potential resistance at $2,060 and further targets at $2,125-$2,150, $2,200, and $2,440. Strong support is seen at $1,960-$1,950, and a failure could trigger a decline towards $1,880 and $1,850, with $1,800 as a lower limit.
Investors should monitor key levels for potential trend continuation or reversal, and the sustainability of support and resistance levels is crucial for determining the next directional move in the Gold market.

Ethereum (#Ethereum) tests its long-term trendline support When Ethereum (#Ethereum) tests its long-term trendline support, it often sparks a significant upward market movement, known as a bull rally.
#Pattern_Recognition: Ethereum (#Ethereum) has shown a recurring pattern where testing its long-term trendline support has resulted in substantial bull rallies.
#Historical_Timing: Notably, each of these support tests has historically occurred in the month of January.
#Projection_for_2024: If the historical trend continues, there's a possibility of witnessing a similar upward market movement or bull rally in January 2024, following the long-term trendline support test.

GOLD PRICE TECHNICAL ANALYSIS ( DAILY CHART )Fiday’s pullback in Gold price from near 8-day highs of $2,048, the path of least resistance still remains to the upside.
The daily technical setup for Gold price will continue to favor bullish traders so long as the 14-day Relative Strength Index (RSI) indicator holds above the midline and the price manages to defend the 21-day Simple Moving Average (SMA) at $2,016.
A daily closing below the latter could fuel a fresh decline toward the 50-day SMA at $1,982. However, the $2,000 threshold could be a tough nut to crack for Gold sellers.
On the flip side, acceptance above the $2,040-$2,050 region is critical to resuming the Gold price recovery toward the $2,100 psychological level. The next bullish target is envisioned at the all-time highs of $2,144.
REGARDS
TRADE WITH RITIK

Gold price hangs near two-week low ahead of US CPIThe gold price has recently dropped below the psychological $2,000 mark, indicating a bearish trend after breaking the 61.8% Fibonacci retracement level of the November-December rally at $2,012-2,010. Daily chart oscillators are losing positive momentum, supporting the possibility of further declines. The next potential support level is the 50-day Simple Moving Average (SMA) around $1,965-1,963, followed by the crucial 200-day SMA near $1,951-1,950. A decisive break below the 200-day SMA could extend the recent pullback from the all-time high.
On the positive side, the $2,010-2,012 support now acts as an immediate hurdle, with resistance at $2,030 and the $2,040 supply zone. If a golden cross occurs, with the 50-day SMA rising above the 200-day SMA, it could favor bullish traders. In this scenario, a climb to the $2,071-2,072 region and a potential reclaim of the $2,100 level may follow.

Technical Outlook of Crude oil ( WTI )Crude oil prices experienced a decline, reaching the lowest point since November, attributed to a growing surplus in supply. Despite the OPEC+ official announcement, oil prices have maintained relative stability in the aftermath. Participants within OPEC+ are recognizing the missed opportunity and attempting to mitigate the situation through additional comments, such as those made by the Saudi Energy Minister.
In terms of technical analysis, the $80.00 mark serves as a crucial resistance level. If crude oil manages to surpass this threshold, the next resistance is anticipated at $84.00 (represented by the purple line), where selling pressure or profit-taking may occur. Conversely, the soft support near $74.00 is currently under pressure, acting as the final defense before potentially entering a range of $70.00 and below. Traders should monitor the $67.00 level, marked by a triple bottom from June, as the next significant support level.
Revised Support Levels:
$71.50 to $70.80
Revised Resistance Levels:
$73.50 to $74.80

Bitcoin price could scrap $40,000 before a bigger dipBTC Target: Bitcoin (BTC) aims for $40,000, driven by a rising RSI at 68, signaling further upward potential.
Bullish Indicators: The Awesome Oscillator (AO) supports bulls, displaying green bars amid positive momentum.
Current Price: BTC stands at $39,462, with the potential to surpass $39,778 before hitting the $40,000 mark.
Mid-September Surge: BTC has surged by 60% since mid-September, in line with the bullish trend often observed in Q4.
Buying Opportunity: A potential dip to $37,500 could provide a buying opportunity for late investors.
Support Levels: Strong support is identified between $42,556 to $67,413, emphasizing potential upward movements.
Warning Signal: The bullish thesis would be invalidated if BTC breaks and closes below the $37,500 resistance level.

BTC/USDT ( Technical View )The current price of Bitcoin is $37,801.73 USD, with a 24-hour trading volume of $20.58 billion USD. Bitcoin has experienced a 0.84% decrease in the last 24 hours, and its market cap is $739.28 billion USD. The circulating supply is 19.56 million BTC, out of a maximum supply of 21 million BTC.
In the weekly analysis of BTCUSDT, all technical indicators and moving averages signal a strong buy. The RSI is at 74.00, indicating overbought conditions in Bitcoin. While the EMAs suggest a temporary bullish trend, caution is advised due to the overbought stance indicated by the RSI, with the potential for an upward swing. Key resistance levels are at $38,907, $40,032, and $41,654, while support levels are at $33,413, $34,538, and $36,160. Bitcoin exhibits high volatility, as evidenced by the ATR (14) value of 2358.

RECOVERY OF USD/ CHF : 13 WEEK LOW AT 0.08757USDCHF touched a 13 week low at 0.8757 during the Asian session on wednesday and recovered some of its intraday losses, trading near 0.8770. The mixed US data could have contributed to the weakening of USD. The current support level of usd/chf is 0.8757, if it is break 0.8757 then it will touch 0.8744 & 0.8730 in intraday with the stop loss of 26 pips.

ANALYSIS VIEW ON SEI / USDT PAIR Pair: SEI/USDT
Exchange: Binance
Trade Type: Buy Long (FUTURE)
Trade Parameters:
Entry Level: 0.2095
Target 1: 0.2160
Target 2: 0.2222
Stop Loss: 0.1970
Analysis:
The SEI/USDT pair, listed on the Binance exchange, presents a promising trading opportunity. The Relative Strength Index (RSI) indicates a bullish movement in the market, suggesting potential upward price momentum. Additionally, a bullish sentiment is observed in the short-term moving average, reinforcing the positive outlook.
Trade Rationale:
The decision to enter a long (future) position at the specified entry level of 0.2095 is supported by the bullish signals from both RSI and the short-term moving average. Target levels at 0.2160 and 0.2222. To manage potential risks, a stop-loss order is set at 0.1970.
DISCLAIMER : EDUCATIONAL PURPOSE ONLY

USD / CAD TECHNICAL OUTLOOK1) USD /CAD moves downside to 1.3700 on weaken US Dollar.
2) The bearish outlook for USD / CAD remain below the 50, 100 AND 200 moving average ( 1 hour TF ).
3) Major support level seen at 1.3655.
Technically, the bearish outlook for USD/CAD remains intact as the pair holds below the 50- and 100-day Exponential Moving Averages (EMAs) on the four-hour chart. Additionally, the Relative Strength Index (RSI) is located in the bearish territory below 50, which means the path of the least resistance of USD/CAD is to the downside.

TRENT-FUTURETRENT FUT broke above 7-8 trading sessions range as well as multiple resistance zone of 2100 with good OI on an hourly charts.
Could be bought with mentioned stoploss & target.

XAGUSD (Silver/US Dollar)XAGUSD Technical Analysis : As of 17th October 2023, silver (XAG) against the US Dollar (USD) is showing signs of a bullish trend. The Relative Strength Index (RSI) is 53.57, indicating neutral conditions, while the Moving Average Convergence Divergence (MACD) is showing a Selling crossover. The silver price has also formed an ascending triangle pattern, suggesting potential upward momentum.
Key Resistance: 22.74
Key Support: 22.46
Traders should closely monitor price movements around these levels. A break above the resistance could signal further gains, while a drop below support may indicate a reversal. Consider your risk management strategy before entering any trade.
On the Basis of TF are :
Minute TF : "Moving Average" & Technical Indicator" are showing bullish movementum
Hourly TF : "Moving Average" & Technical Indicator" are showing bullish movementum
Daily TF : "Moving Average" is neutral but the "Technical Indicator" is showing bullish movementum
Weekly TF : "Moving Average" & Technical Indicator" are showing bearish movementum

G N F C GNFC FUT broke above 15 trading sessions comsolidation range breakout on an hourly charts with good OI build up.
Could be bought with mentioned stoploss & target.

Auto stock Auto Components Ltd
ABOUT
NDR Auto Component operates in the auto components industry and manufactures seat frames and trims for four-wheelers and two-wheeler vehicles and other accessories relating to car seats
It was incorporated and listed in 2019 as a part of Rohit Relan Group. It was listed post demerger of the automobile seating business from Sharda Motor Industries


BTC’s price hit $38624.14The price of BTC/USDT has been dumped by -1.05% in the last 24 hours. Bitcoin is shown in the bearish mode & it will touch $24000 in 2023 and in bullish mode it will touch the $38600 in 2023. The previous All Time High was on 10th November 2021 where BTC was priced at $69,045.
It has moved by 17.54% in the past week and it currently at $30000 approximately. There is slight bearish sentiment shown in the crypto market But in the long term it will hit the $34900 approximately in 2024. The current market cap of Bitcoin is $582,490,336,788.

CHAMBAL FERTILISER (BULLISH)CHAMBAL FERTILISER is a chemical stock
from a long time stoack was in consolidation
Between the level of 370 -260 from from jun 2022
Now stock was trying to make a inverse HEAD AND SHOULDER PATTERN
From the feb-14-2023 first it makes a SHOULDER at level of 270 -275 on feb -24-2023
After that make a HEAD at level of 250-248 on mar-29=2023 the retrech at the same level of
Shoulder resistence. Then it make a next shoulder at the same level of 270-275 on apr -25-2023
Then they try to retrech on the same level of heads and shoulder neckline i.e 290
above 295 or neckline (day closing is very imp )stock is bullish
just a view / consult your financial advisor befor investing and trading

TRENT Look bearish Trent looks bearish below 1350
CHASRT makes a pattern or fallin wedge
below 1350 it look bearish
trent was trying to make this pattern
from 23/Dec/2022
successfully make this wedge
stock was trying to break at upper level on
03/Apr/2023 but it was a fake breakout
Or we can say bear get active
Below 1350 level new seller try shot
just view
consult your advisor before any action

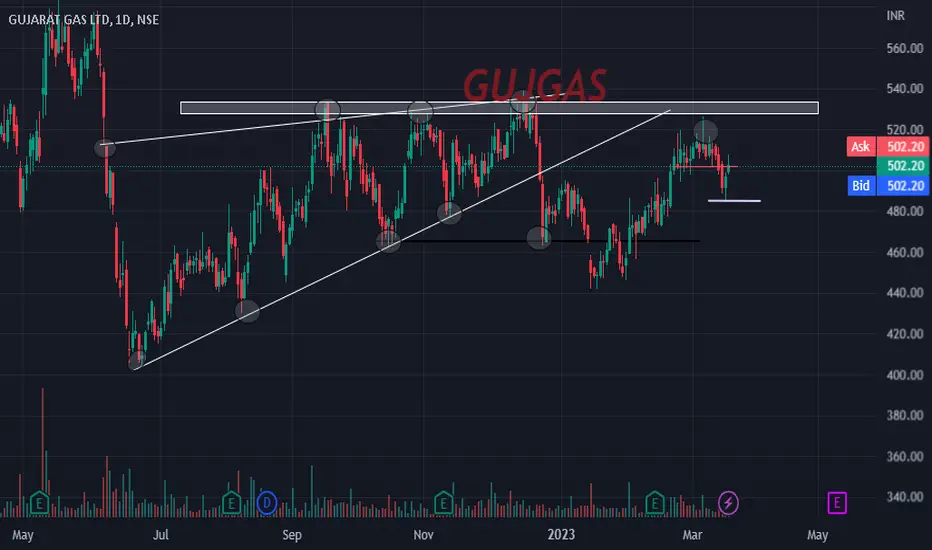
GUJGAS RISING WEDGE AFTER MAKING RISING WEDGE IN GUJGAS
A stock is in consolidation
a movement come in a stock in downword But
Again from the lower level there is buying in stock
stock still not complete the target of rising wedge
keep an eye on that
just a view
consult your advisor before any action
OBEROIRLTY BEARISH OBEROIRLTY is in bearish trend now
its a make a pattern
And try twice to braout this trend but it failed twice
now it is in bearish trend after a fake breakout
keep an eye on this after a strong consolidation and with a fake breakout
THEY are trying to active a more seller
keep an eye
just a view
we are not responsible for any p/l
consult your advisor first before any trade
