IOC | price is not moving but RSI is making HHStock is at strong support level , price is now at range and accumulation of share is must happening as volatility deceased
RSI is continuously making Higher High
Possible upside breakout will happen
targets are mentioned i.e 83
lot size = 5700
check out the other ideas as well
FOLLOW & LIKE & COMMENT
IOC

I am enjoying it by buying at 74.00.Are you enjoying too?hello guys!
I had bought this at 74.00 accordingly to my analysis.
just sharing my analysis for your help :)
fundamental results are good for this stock.
In shorter timeframe,the stock has formed a descending triangle and had breakout after it.
For confirm uptrend,you can buy at 77.40.
----------------------all the other details are given in the chart---------------------------------------
please like and comment.let me know your agreements.

IOC LongI hope you can now see how IOC represents an excellent low risk profit entry setup allowing you to trade in the market.Take positions so that the risk/reward is in your favor.
Knowing why, where & when a strong reversal signal is being generated will be the only way to capitalize on your technical analysis .
Thank You
Disclaimer: It should not be assumed that the methods, techniques, or indicators presented in these chart will be profitable or that they will not result in losses. There is no assurance that the strategies and methods presented will be successful for you. Past results are not necessarily indicative of future results. You should not trade with money that you cannot afford to lose. Examples presented in these products are for educational purposes only and it should not be assumed that these are indicative of ordinary trades. These setups are not solicitations of any order to buy or sell. The publisher assume no responsibility for your trading results. There is a high degree of risk in trading.

"Bearish Harami" Breakout In IOC (Indian Oil Corporation)Buy IOC on an dip to 76.5-76.8 Strict sl of 74.5 (Day Closing Basis) Target - 81/83/86

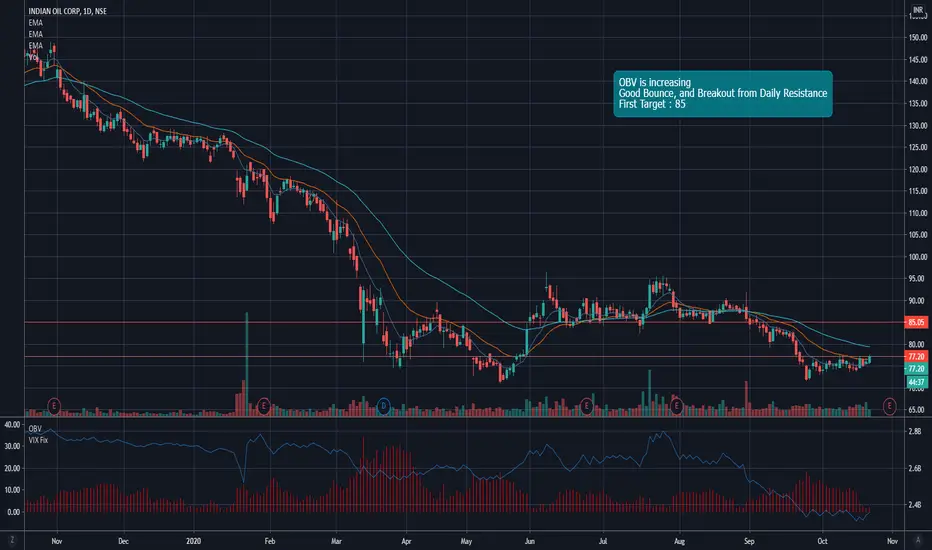
IOC - Positional LongOBV is increasing, and there is a good bounce and now at the verge of Breakout of a good resistance.
Can go Positional Long
First Target - 85

BUY signal IOC , Rectangle pattern , Trading is all about skillwill go LONG on IOC because:
1) The price is forming a Chanel or Rectangle Pattern .
2) The price also broke the trend line .
3) The price is also under Support/Resistance zone.
4) It has touched the support (lower end of rectangle ) and may reach the resistance zone (upper end of rectangle ) .
5) Target would be the Resistance area . Book profit when it reaches the resistance zone .
Entry - 84
First Target - 90
Second target - 95.7
Stop loss - 82


IOC to break below 74Indian Oil Corp. To break before 74. It has a strong support at 74.40 and if it breaks, it would have successfully broken the support after multiple tries.
Sell below 74. Target at 70. Stop loss at 76.
NSE:IOC


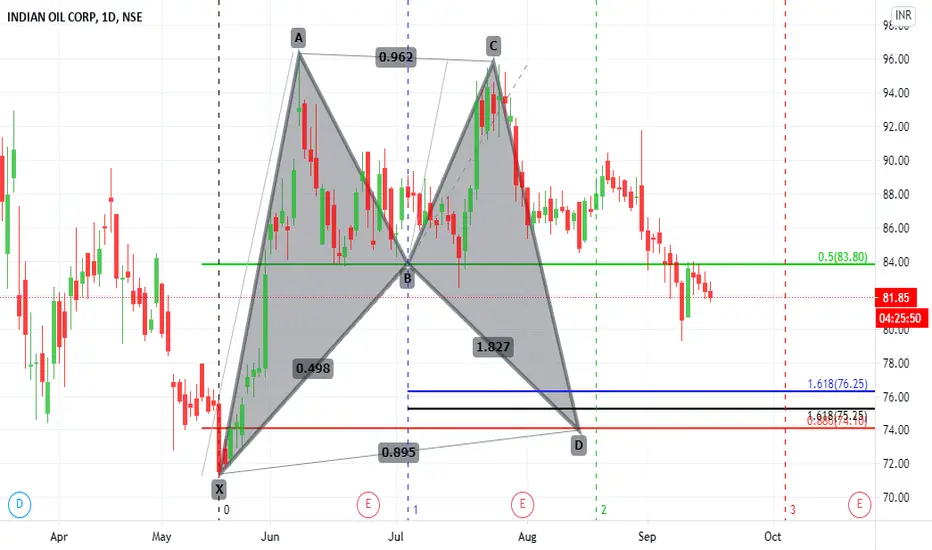
IOC - BULLISH - INVERTED HEAD & SHOULDERS PATTERNPlease use these entries as breakout points. And Do not trade when a gap up or down occures.
Entry : 83.50
Target : Trailing Stop loss
Stop loss : 83
This is not a recommendation. This is for educational purpose only.
Consider all risks possible with stock market.
Thank you
Have a nice day
Happy Trading!!

IOC Swing Trade (2 to 3 Month)IOC Buy above 92 in Hourly Time Frame Close.
Target 102 / 112 / 122
SL - 80


IOC looks bullish in rising pennat pattern so look for buying Looks bullish pattern and looks volume also good . You can pick the trade if you have seen any higher high formations


IOC 15 Mins - Support ZoneIOC can see a bounce from the support zone. Can touch 89-91 levels in short term. This is my point of view and I am sharing it only for educational purpose. Its not a recommendation for anyone to trade as per these levels.


IOC short term setupIOC is looking weak, in terms of price and volume correlation. It was consolidating in a range and then gave a break out of the range on 19th August. The volumes, then, were above the 100 DMA, suggesting some sort of strength from the buyers. After that breakout, price did continue to move higher, and volumes did expand as the price moved higher. But in the last 2-3 sessions, there have been various strong signs of sellers entering IOC, in form of bearish candles on back of volume expansion. This volume expansion has been more than the volume expansion during the bullish phase, suggesting supply is greater than demand. I will personally wait for more confirmation, such as bearish engulfing candle on back of volumes, to initiate any type of short trade. Another confirmation is the break of the upward trendline, marked with the callout box. Another decisive level is 90.5. There have been signs of supply near this level, as price has reversed from the level many times. If this level is broken with strength, then this would be a sign of supply being absorbed by buyers that are stronger than the sellers. If this were to happen before the trendline is broken, then the short trade setup should be cancelled, and the trend will continue to be bullish. Upside target would be 94.85 and downside target is 84.85. Risk should be managed according to your personal risk appetite.
I am not a SEBI registered investment advisor and hence do not follow my analysis blindly.
Be aware of what you are trading and the risk associated with it.
Stock market is risky and you can lose a lot of your capital.
Be wise and trade carefull!
Hope I can help you become a profitable trader!
Grateful!🙏

