IOC


BUY OICBUY IOC AT CMP 153
SL 150
IF IT BREAK IT WILL COME 141
150 BOTTOM LINE AND ALSO LOW VOLUME
TARGET 1: 168
TARGET 2: 180

My PredictiveAlgorithms Intraday call(12-Jun-18)-IOC-ShortBased on my "xRSI-FKS Explosion's" predictive trading methodologies, its going to be a RED candle on 12-Jun-2018 for IOC
Sell Below: 172.7 for targets -
T1: 171.4
T2: 170.6
T3: 169.8
SL: 174.1
Note: These calls are based on my own analysis. It may or may not work well for you.So please carefully consider whether it is suitable for you and please do your own research before attempting any. The profit/loss made by you due to this call, is solely your own responsibility. Thanks, All the best. Happy Trading. :-)

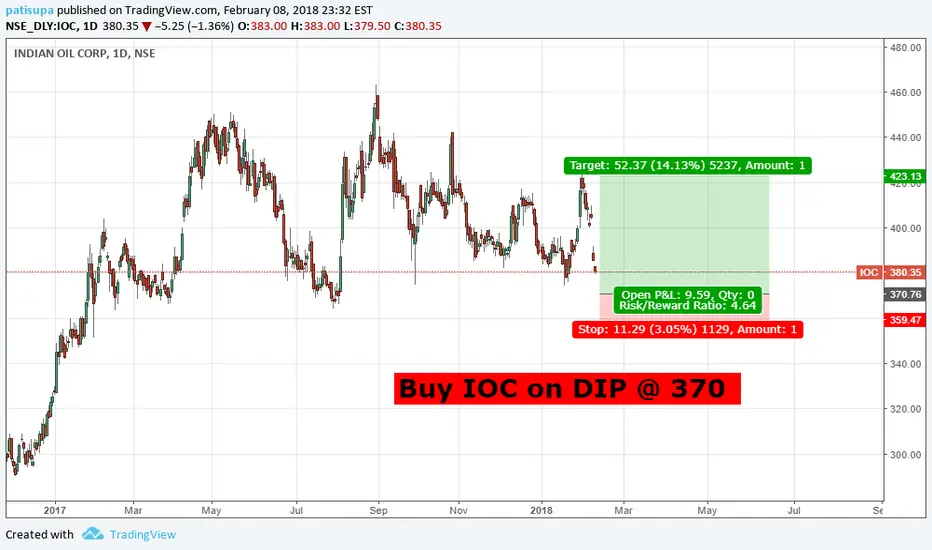
IOC at support levels and EMA supportIOC is at support levels and 150 EMA support.
SL is breakdown of 150 EMA

IOC- believe or Not!!!IOC stock looking for huge downside from current market price almost 30-40% as per there is huge consolation and now finally breakdown that indicate target of 144 and 102 on chart there is selling 180 to 200.

IOC weekly chart studyIOC weekly chart study
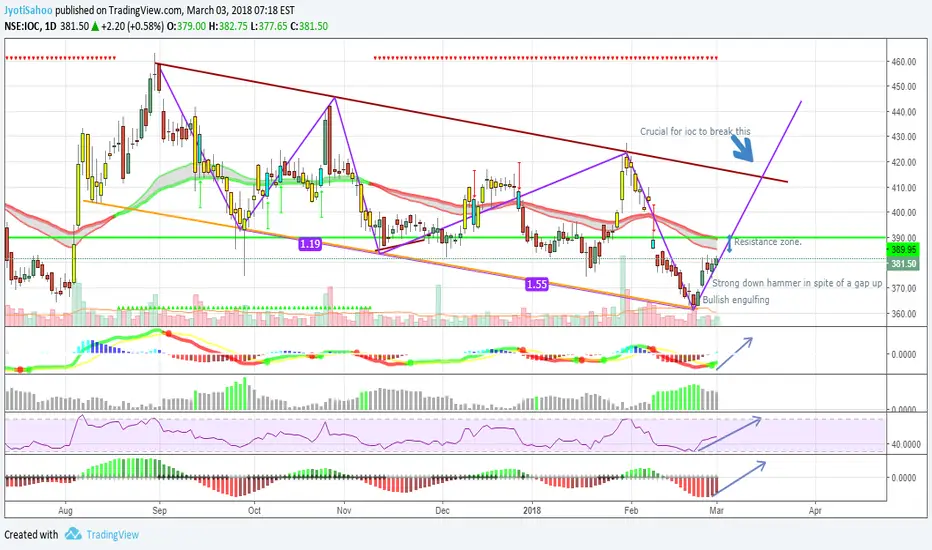
IOC finding strong support between 366-385 zone but finding resistance at 50 wk EMA

Short IOC around 382-385 for trgt 360 stop loss 392NSE:IOC formed a nice bearish pinbar and closed below its 50EMA,200EMA and near term support
my target for IOC is 360 , will look to short tomorrow

Down channel , Expected channel breakoutIOC on a daily chart is following a down channel .lower lows are being formed. and lower highs. this is a false recovery probably upto 414 . oscillators and tech indicators are in favor . this can be cashed in. the last 5 candles are pretty strong. but if we see a channel break out that will be a big bonus.
There is resistance zone around 390. if the stock sees to hold that level and volumes pick up . we can see upmove.

n e w y e a r t r a d e idea will like to go long in BPCL on monday as see it as a low risk but good return kind of stock . corrected enough , possibly i might go 100 % correct

IOC Triangle BreakoutIOC has been moving in a triangle for a while. After a recent consolidation at its base and a duoble bottom, it made a big leg up to it trendline, may reverse frmo there or make a flag before breaking out to the next trendline, or making a leg down to th base again. FIB levels looks good and coincides withthe sup/resistance and Trendlines.


IOC Shall we wait for long ?Hi,
As per daily chart we can see the waves formations and it has completed 1 2 3 4 5 and A wave, for Intraday or a week you can take buy position near support zone to complete B wave as a target, but as per my view, we should avoid long at present stage and wait to complete the C and think that time.

ONGC IOC Enerrgy OversoldONGC specifically has retraced 61.8% of the rally.
Considering the energy sector rallied on Friday in US session, this is likely to bump up on Monday and likely to follow through over next couple of sessions.
165 is the short term target. Leveraged trade for adventurous ones as this is expiry week.
Purely a short term play though. Not buy and hold by any means.

IOC- Let's get Oily Hi All ,
Everything on chart. Minimum Target 435
No Naked Futures / Calls
3 strategy :
Buy April futures , Buy April 420 PUT
Buy April 420 calls , Sell april 440 or 430 calls
Buy April 420 calls 2 lots , Buy april 420 put 1 lot (Put /call combination as per ur chooice).
Note : Consult your financial adviser before investing , This is Risky .
For educational purpose /paper trade only

IOC - Up Flag PatternIOC is showing Up Flag pattern which is a Bullish pattern with a nice breakout with good volume.
Target around 470
Also MACD showing a crossover 4 candles before the breakout
(this is just for study purpose, PROs please advice)

Indian Oil - Double Breakouts It is been observed on the daily chart that the price action firstly breaks out from a big downward or zig zag consolidation and then again consolidated in a small triangle formation and now it breaks out from that too, indicating a strong bullish move ahead.
Target 1: 400
Target 2: 410
Stoploss: 380


