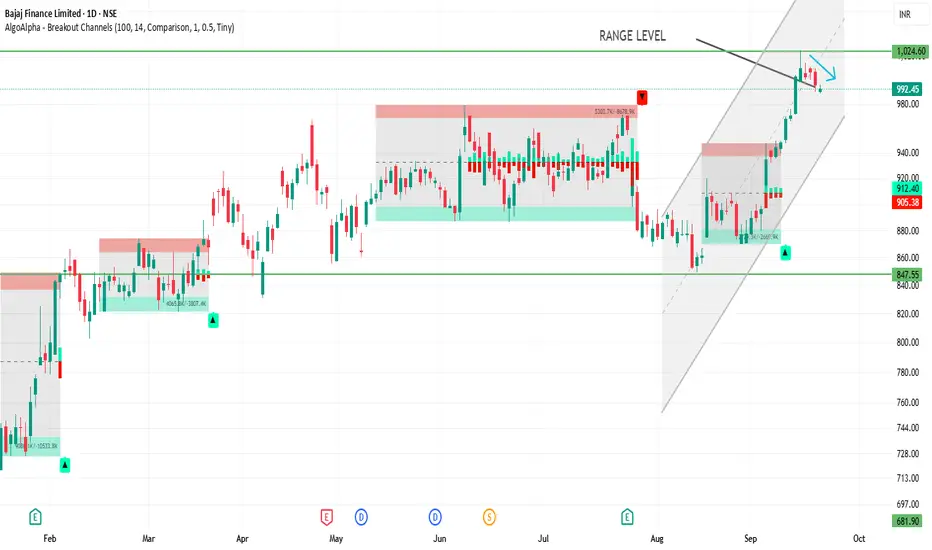
BAJFINANCE 1D Time frame📊 Current Snapshot
Current Price: Around ₹993
52‑Week High: ~ ₹1,025
52‑Week Low: ~ ₹640
Recent Trend: Positive short-term momentum with weekly gain ~2% and monthly gain ~10%
🔍 Support & Resistance
Immediate Support: ₹960 – ₹954
Next Support: ₹946
Immediate Resistance: ₹975 – ₹983
Higher Resistance: ₹989 – ₹990
⚙️ Technical Indicators
RSI (14): ~45–46, neutral stance
MACD: Slightly negative, indicating weak bearish momentum
Moving Averages: Mixed; short-term MAs below price (support), long-term MAs above price (resistance)
🎯 Possible Scenarios
Bullish: Break above ₹983 with volume could push toward ₹990+
Bearish: Fall below ₹960 may lead toward ₹946
⚠️ Key Points
Price is near support/resistance zones; breakout requires strong volume
Trend is positive in the short term, but caution needed near resistance levels
Combine with market sentiment and risk management before trading
IRCTC
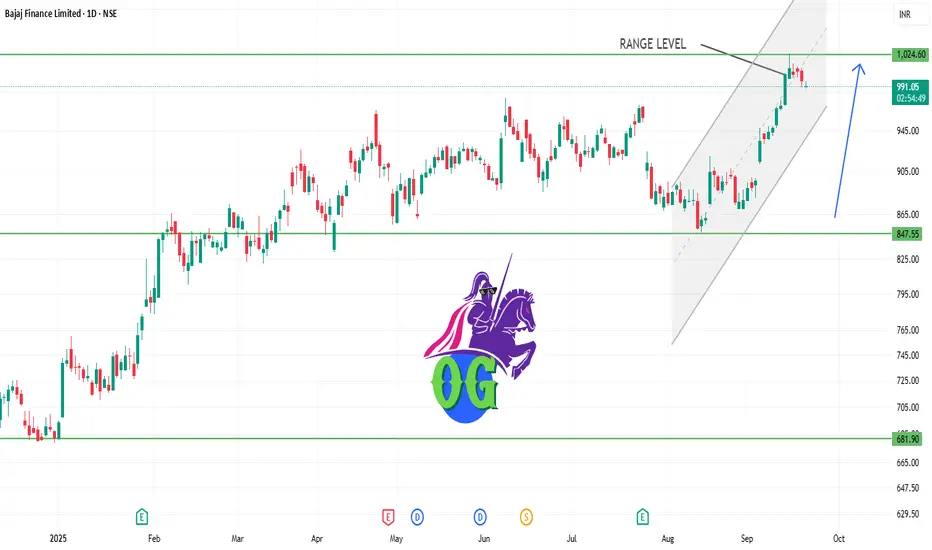
BAJFINANCE 1D Time frame1. Pivot Level
₹992 → key short-term pivot.
Above ₹992 → bullish bias.
Below ₹992 → bearish bias.
2. Bullish Setup (if price holds above ₹992)
Entry: Around ₹995–₹998 (after confirming bounce above pivot).
Target:
First target → ₹1,010–₹1,012
Second target → ₹1,020–₹1,025 (if momentum continues)
Stop Loss: ₹990 (just below pivot)
Risk/Reward: Good, roughly 2–3x potential vs stop.
3. Bearish Setup (if price falls below ₹992)
Entry: Around ₹990–₹988 (if close below pivot confirmed).
Target:
First target → ₹980
Second target → ₹965–₹960
Stop Loss: ₹995 (just above pivot)
Risk/Reward: Decent for short-term pullback trade.
4. Notes / Idea Logic
Why it works: ₹992 is acting as a short-term pivot — price respecting this shows strength; breaking it signals weakness.
Volume confirmation: If buying comes with strong volume → bullish; if selling is strong → bearish.
Time frame: This is mainly for 1–3 day trades on the daily chart.
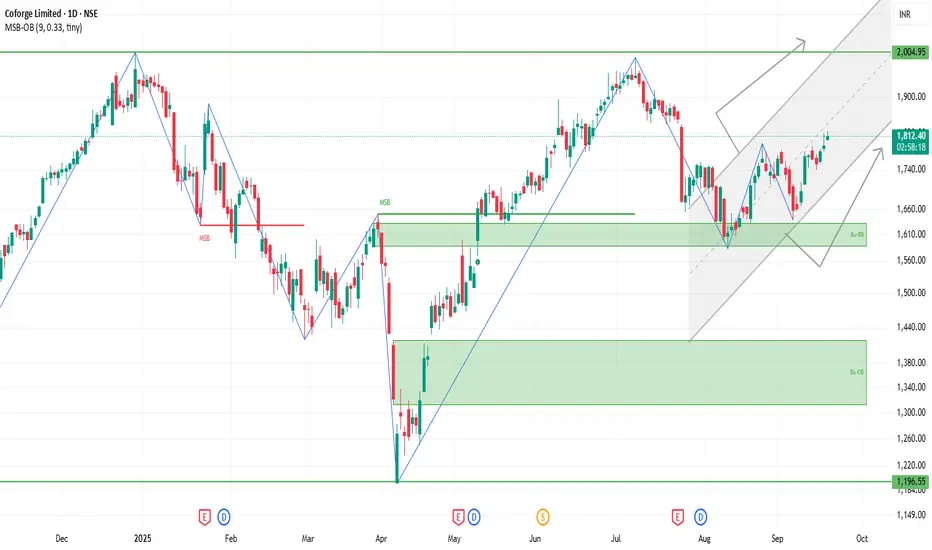
COFORGE 1D Time frameCurrent Snapshot
Price is trading near ₹1,812.
Stock is showing good strength above short-term and long-term moving averages.
Volatility is moderate, so sharp intraday swings are possible.
⚙️ Indicators / Momentum
Moving Averages: All key averages (short, medium, long) are bullish.
MACD / Momentum: Positive, supporting upside.
RSI: Slightly high, showing strength but near overbought zone → chances of small pullback.
📌 Key Levels
Immediate Resistance: ₹1,820 – ₹1,835.
Immediate Support: ₹1,790 – ₹1,800.
Stronger Support: ₹1,750 – ₹1,760 if weakness extends.
ANGELONE 1D Time frameCurrent Price: ₹2,238 – ₹2,240
Day’s Range: ₹2,212.60 – ₹2,274
Previous Close: ₹2,222.30
🔹 Support & Resistance
Support 1: ₹2,220 – ₹2,215
Support 2: ₹2,200 – ₹2,180
Resistance 1: ₹2,250 – ₹2,260
Resistance 2: ₹2,270 – ₹2,280

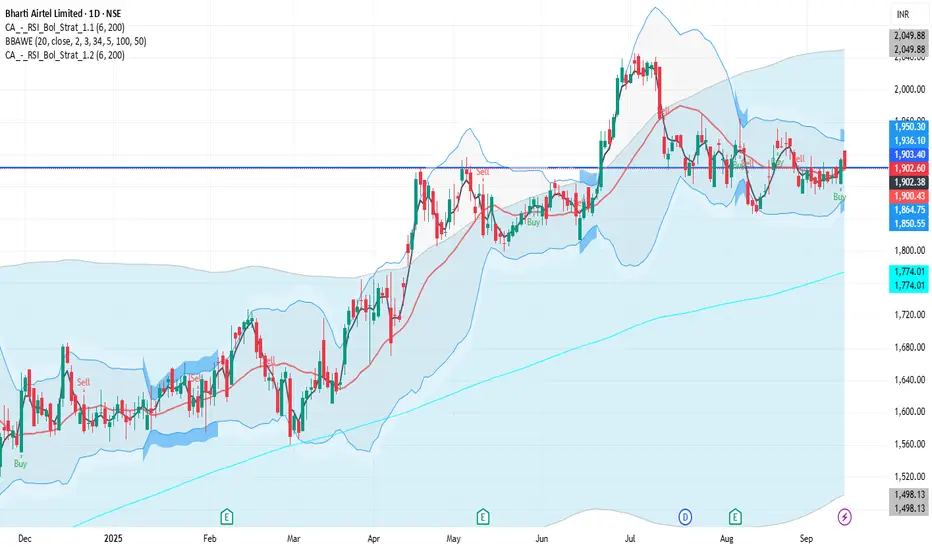
BHARTIARTL 1D Time frame📉 Current Market Snapshot
Previous Close: ₹1,902.00
Day's Range: ₹1,901.60 – ₹1,925.00
52-Week High: ₹2,045.80
52-Week Low: ₹1,511.00
Market Cap: ₹11.03 lakh crore
P/E Ratio: 30.72
Dividend Yield: ~0.81%
ROE: 23.80%
Debt-to-Equity Ratio: 1.88
Beta: 0.94
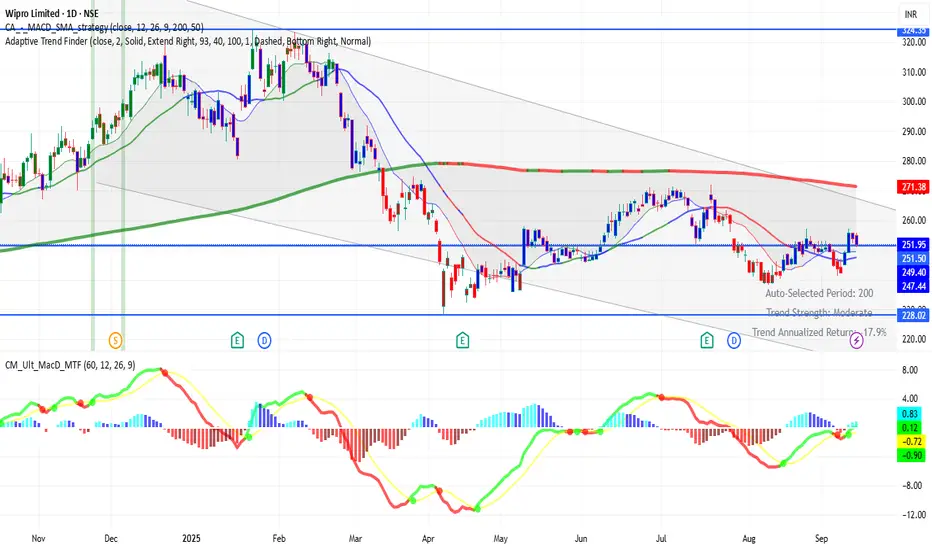
WIPRO 1D Time frame📊 Current Status
Price around ₹252–₹255
Showing recovery from recent support
🔑 Key Levels
Support: ₹242 → ₹240 → ₹230
Resistance: ₹255 → ₹260 → ₹265
✅ Outlook
If WIPRO sustains above ₹255–₹260, more upside is possible. Falling below ₹240 may push price back toward ₹230.
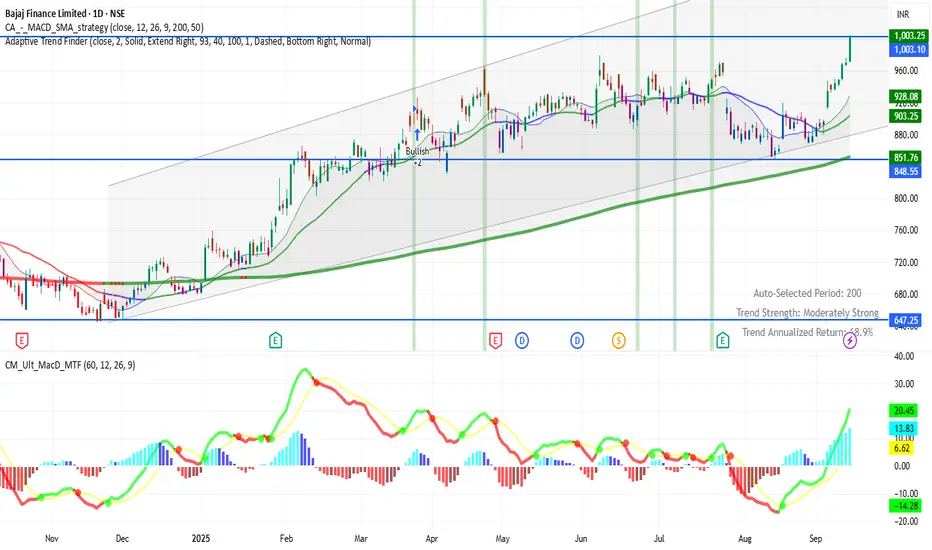
BAJFINANCE 1D Time frameCurrent Market Situation
Bajaj Finance is trading around ₹1003 in the daily chart. This level is very important because the stock has just touched its 52-week high near ₹1005. On the lower side, today’s support level is around ₹970 – ₹975, which is also close to the previous closing price.
The overall trend in the daily chart is strongly bullish, meaning buyers are in control right now.
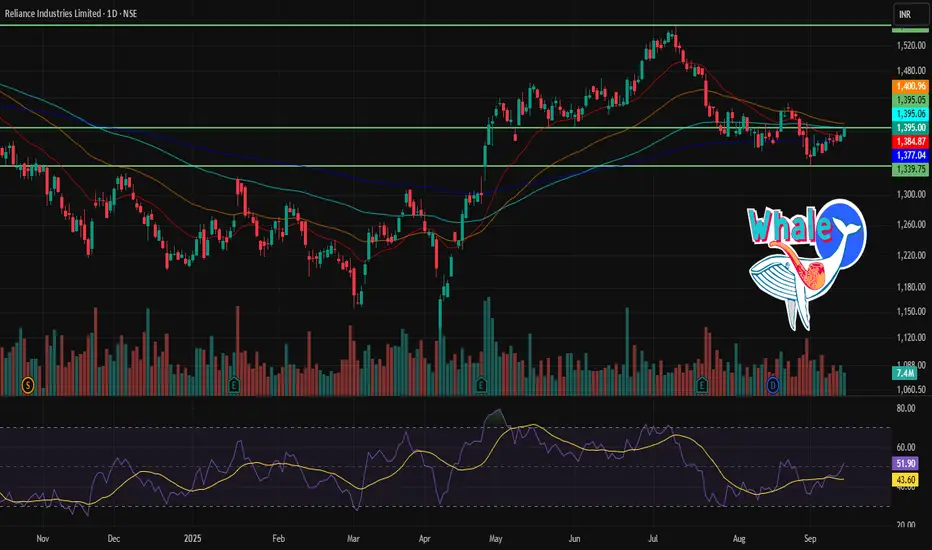
RELIANCE 1D Time frame🔢 Current Level
Trading around ₹1,395
🔑 Key Resistance & Support Levels
Resistance Zones:
~ ₹1,400 – ₹1,410 (near-term resistance)
~ ₹1,420 – ₹1,430 (stronger resistance above)
Support Zones:
~ ₹1,380 – ₹1,370 (first support)
~ ₹1,360 – ₹1,350 (secondary support)
📉 Outlook
Bullish Scenario: Holding above ₹1,400 could push price toward ₹1,420 – ₹1,430.
Bearish Scenario: A fall below ₹1,370 may drag it toward ₹1,350 or lower.
Neutral / Range: Likely to trade between ₹1,370 – ₹1,420 until a breakout or breakdown occurs.
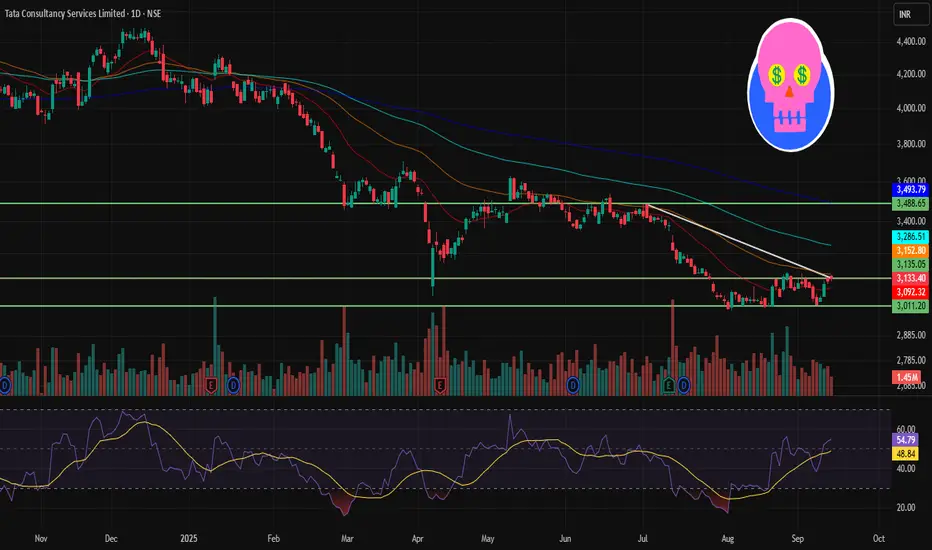
TCS 1D Time frame🔢 Current Level
~ ₹3,131
🔑 Key Resistance & Support Levels
Resistance Zones:
~ ₹3,160 – ₹3,180 (near-term resistance)
~ ₹3,200 – ₹3,220 (stronger resistance above)
Support Zones:
~ ₹3,120 – ₹3,100 (immediate support)
~ ₹3,050 – ₹3,000 (secondary support)
~ ₹2,900 (deeper support if weakness intensifies)
📉 Outlook
Bullish Scenario: If TCS holds above ~ ₹3,120 and manages to break past ~ ₹3,180 – ₹3,200, there is potential to move toward ~ ₹3,220+
Bearish Scenario: A drop below ~ ₹3,100 could lead to a slide toward ~ ₹3,050 or lower
Neutral / Range: Between ~ ₹3,100 – ₹3,180, TCS may consolidate until a clearer breakout or breakdown
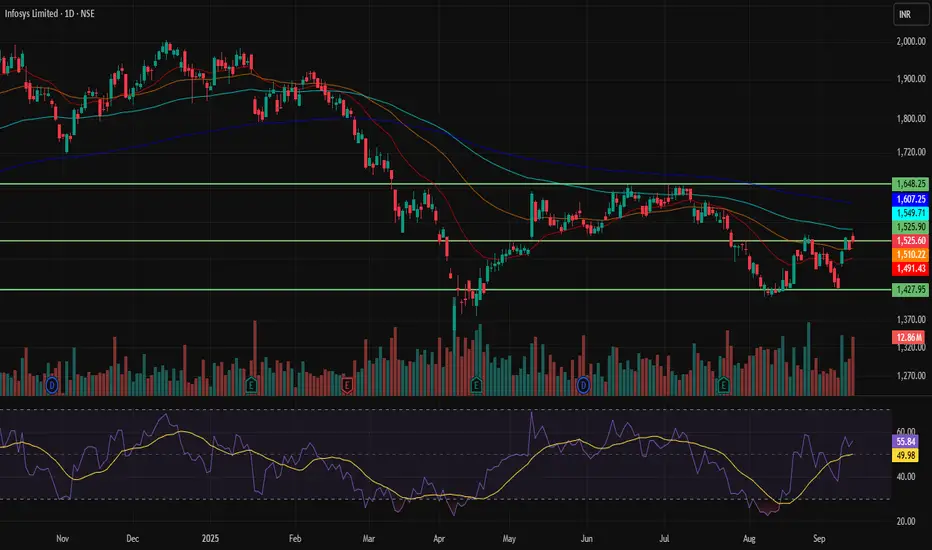
INFY 1D Time frame🔢 Current Level
Trading near ₹1,525.60
🔑 Key Resistance & Support Levels
Resistance Zones:
~ ₹1,539 – ₹1,552 (near-term resistance)
~ ₹1,560 – ₹1,570 (stronger resistance if price moves higher)
Support Zones:
~ ₹1,510 – ₹1,500 (immediate support)
~ ₹1,470 – ₹1,450 (secondary support)
~ ₹1,380 – ₹1,400 (deeper support if selling pressure builds)
📉 Outlook
Bullish Scenario: A close above ₹1,540 could fuel momentum toward ₹1,560+.
Bearish Scenario: If it slips below ₹1,510, risk opens toward ₹1,470 or even ₹1,400.
Neutral / Range: Likely sideways between ₹1,510 – ₹1,552 until a breakout.
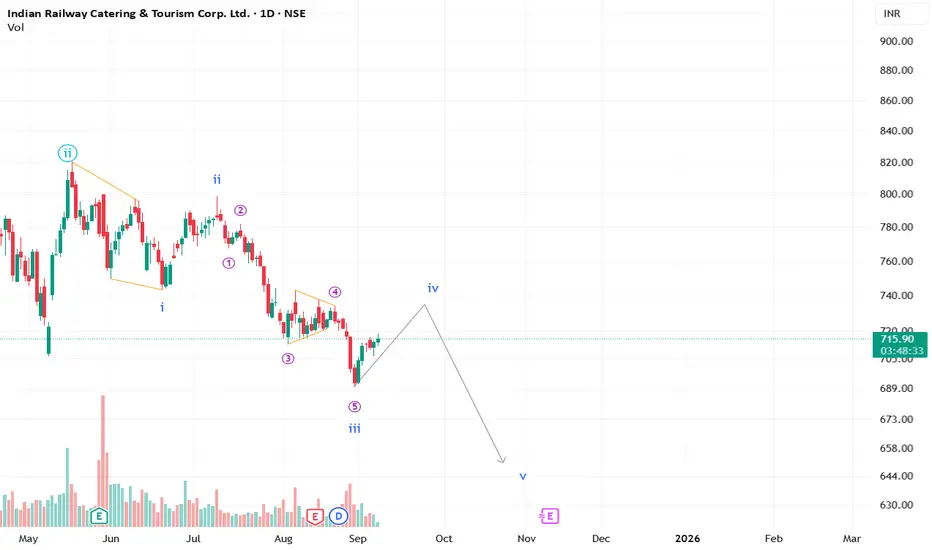
IRCTC rising to fall back again?What appears to be a corrective pullback to complete wave iv, IRCTC may witness a fall in the coming days to complete wave v.
**This is an educational market outlook, not investment advice. Please consult a SEBI-registered advisor before taking any investment decisions.**
IRCTC | Time to ride in Indian RailwaysStock has been consolidating since very long and its on the verge of breakout from triangle pattern. Since volume has been try since very long hence confirm the volume at the time of breakout to identify if it is a false breakout or not.
Entry -: 675 on closing daily closing basis
Target -: 990
SL -: on closing daily closing basis
RRR -: 1:4
Use trailing SL after 1:2 RRR

Lifeline of the nationCmp - 788. Close weekly above 810 can take Train till 1100 or beyond...
Indian Railway Catering & Tourism Corporation Ltd
Incorporated in 1999, IRCTC is a Mini Ratna (Category 1, Central Public Sector Enterprises ) and the only company authorized by the Indian government to provide online railway tickets, catering services, and packaged drinking water
at railway stations and trains in India.
This is just to boost my confidence. No Suggestions for buying. I will keep checking and updating my mistake if last post gone wrong...
Disclosure: I am not SEBI registered. The information provided here is for educational purposes only. I will not be responsible for any of your profit/loss with these suggestions. Consult your financial Adviser before making any decisions.

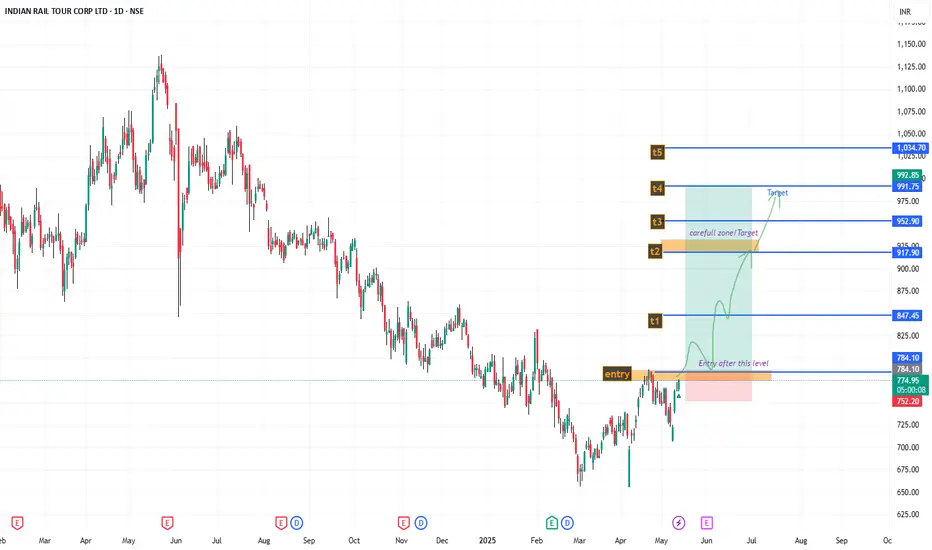
IRCTC , Looking good ; min 25% Roi ; swing For short term investment ;
Leave a " Like If you agree ".👍
.
Wait for small retracement & daily candle to close above - "785".
Trade carefully untill ENTRY level.
.
Entry: 785
Target: 850-917-991
sl: 745
major stoploss/ support: 700.
.
Enter only if market Breaks
"Yellow box" mentioned.
.
.
Don't make complicated trade set-up.📈📉
Keep it " simple, focus on consistency "💹
Refer our old ideas for accuracy rate🧑💻
Follow for daily updates👍
.
Refer old posted idea attached below.
IRCTC - Possible end of Quaterly downtrendPast 3 months post result stock has continued its downtrend
Now approaching its major flip zone which may try to act a support
Area from 710 to 740 can act as a reasonable support
A good buying opportunity can arise there with good risk reward
700 can act as a final downside for SL
900 on upside can the area the stock may try to approach

IRCTC Long Idea......IRCTC looks good for reversal.
It is forming cup and handle pattern. Currently in Handle structure. 2-3 Quaters down the line it may touch ATH.
Targets are given in chart. SL for safe traders is trendline it was taking support on.
Risk management is Priority. Need to consider broader market conditions before taking position as swing.
I am personally going to average at horizontal support if at all it comes.
NOTE : Fundamentals are good. Top line 3Y sales growth CAGR = 77% , Bottom line 3Y Profit growth CAGR = 90%. Good ROE. No peer to compare P/E as Monopoly & P/E,P/B < median
I'm personally buying it whenerver falls 5-10%.

IRCTC - Breakout OpportunityDate : 16-Dec-2024
LTP : Rs. 842.50
Targets: (T1) Rs. 983 --> (T2) Rs. 1,049 --> (T3) Rs. 1138 --> (T4) Rs. 1,279
SL : Rs. 783
Technical View:
• NSE:IRCTC is in primary uptrend and was recently going through it's secondary downtrend within primary uptrend.
• After touching a high of 1,138.90 on 23-May-2024, it has retraced 31% to 783 level.
• NSE:IRCTC has recently breakout from it's secondary downtrend with high volume.
• NSE:IRCTC is trading above 20 DEMA since last few sessions.
• RSI is in buy zone and trading at 54.65. MACD has given bullish crossover and trading at 2.12.
• Both RSI and MACD are showing positive divergence, indicating trend reversal.
• Looking good to start a new swing from here.
Liked the analysis? Boost/Like this idea and follow my ID for more ideas.
Disclaimer: I am not a SEBI registered analyst/consultant and not recommending anyone to take any BUY or SELL position in stock market. Investing in stock market is risky and one should do a self analysis and validation before investing in stock market. My ideas are published for learning purpose only and are available to everyone at no cost/charge.

weekly time frame on IRCTCTrendline Support: The stock has touched a key trendline, indicating potential support.
Green Candle Formation: A bullish green candle has formed, signaling buyer interest.
RSI Oversold Zone: RSI is below 40, suggesting the stock is in an oversold territory.
Buying Opportunity: This combination indicates a potential reversal to the upside.
Volume Confirmation: Look for increased volume to strengthen the bullish signal.
Risk Management: Place a stop-loss just below the trendline to manage risk.
Entry Point: Enter the trade near the trendline once conditions are confirmed.
Target Profit: Set a realistic target based on previous resistance levels.
Monitor RSI: Watch for RSI to rise above 50 to confirm momentum.
Stay Alert: Always review market conditions before making a decision

IRCTC-A monopoly stock available at discount!Technically, IRCTC has been in an uptrend since its listing in 2019.
Stock has taken support multiple times at trendline visible on chart.
If stock breaks this trendline due to bearish broader market, we can see a swift move towards 660 levels which is yet another demand zone.
Levels given on chart.
As most of us know, it is a monopoly PSU stock and has big potential in long term given the expansion of rail networks in India. It is not a recommendation but my personal opinion. I am a NISM Certified research analyst and not SEBI registered.

IRCTC by KRS Charts11 Nov 2024 / 11:11 AM
Why IRCTC ❓❓
1. Fundamentally Good Company. 💪
2. Technically, it was already Entered in Golden Reversal Zone. 🔅
3. Along With that inside that zone now Bulls Counter- Attack is visible ✅ which is formed at the bottom of the Trend for Reversal.
4. At recent Bottom Positive Order Block has formed and showing Bullish Traits from that level.
5. With Bull C. A. green candle RSI is showing Bullish Reversal Divergence.
Targets & SL is in Chart

IRCTC Stock Analysis: Key InsightsDowntrend : IRCTC is following a descending trendline, indicating a bearish phase. A breakout above this trendline could signal a bullish reversal.
Support Levels :
Immediate: ₹805-810
Stronger: ₹760, followed by ₹690 and ₹637
Resistance Levels :
Key: ₹858
Higher: ₹902 and ₹935
Trend Outlook : The stock is consolidating near its lower range, suggesting either an accumulation phase or further downside if ₹760 breaks.
Budget Expectations : The government may announce favorable policies or benefits for IRCTC in the upcoming budget, potentially boosting the stock.
Stop-Loss Strategy : Traders can use the ₹790-800 level as a stop-loss for long positions to manage risks effectively.
Actionable Points:
Traders: Watch for a breakout above the trendline for long positions, with ₹790-800 as a stop-loss, or consider shorts below ₹760.
Investors: The ₹690-760 zone may be an accumulation area for long-term prospects, especially with possible budgetary support.

IRCTC
This chart appears to be a candlestick chart for IRCTC (Indian Railway Catering and Tourism Corporation) stock prices over a period from June to December 2024, with a descending trendline indicating a bearish trend overall. Here are some observations:
Bearish Trend: The descending trendline suggests that the stock has been in a general decline since June 2024. This indicates that the price of IRCTC shares has been decreasing over this period.
Support and Resistance: The trendline might act as a resistance level where the price struggles to break above. The price has touched this trendline multiple times, indicating it's a significant level for traders to watch.
Recent Bounce: Towards the end of the chart, there's a noticeable bounce in the stock price, suggesting some buying interest or a potential reversal. This could be due to various factors like positive news, earnings reports, or market sentiment.
Volume: If volume data were available, it would provide more context. Typically, a bounce with high volume could indicate stronger buying support.
Time Frame: The chart shows daily candlesticks, which means each candlestick represents one day of trading.
Current Price: The last price shown is 843.05 INR, with a slight upward movement at the end of December, indicating some recovery from the previous lows.
Future Outlook: If the price breaks above the descending trendline with significant volume, it could signal a potential trend reversal. Conversely, if it fails to break this resistance, the bearish trend might continue.
For a more detailed analysis or if you're looking for trading advice, consider:
Technical Indicators: Adding indicators like RSI, MACD, or moving averages could provide more insights into momentum and potential reversal points.
Fundamental Analysis: Looking at IRCTC's earnings, news, and market conditions could offer a broader perspective.
Market Sentiment: General market trends and sector performance could also influence IRCTC's stock movement.
If you're considering trading based on this chart, remember to set stop-loss orders and have a clear strategy for both entry and exit points.

IRCTC Descending Channel breakout to watch.Descending Channel:
The price is trending downwards within a well-defined descending channel (yellow lines), with lower high and lower lows indicating a bearish trend.
Key Support and Resistance Levels:
Support:
788.50 appears to be a strong support level, as shown by the blue horizontal line, below that it can move towards 725 represents a more significant lower support level.
Resistance:
850 being the previous high and immediate resistance.
914.75 is resistance levels within the current channel.
A breakout above the 993.65 resistance could indicate further bullish momentum which till for new all time high.
RSI (Relative Strength Index):
The RSI is hovering near 53.64, It indicates a neutral to slightly bullish sentiment.
Recent Price Action:
The price has bounced off the 788.50 support and is attempting to move upward, nearing the channel's upper boundary. A breakout from the channel could signal a trend reversal.
Volume:
Volume appears moderate, which might suggest the need for stronger buying interest to sustain an upward breakout.
Potential Strategies:
Bullish Scenario: If the price breaks above the descending channel and closing above 850 resistance with strong volume, it could indicate a bullish trend reversal till 914.75
Bearish Scenario: A rejection at the channel's upper boundary or resistance levels of 850 may lead to further downside toward 725 or even 670.
Disclaimer -
The information provided herein is for educational purposes only. It does not constitute financial, investment, or trading advice. Consult a qualified financial advisor before making any financial decisions.
We are not liable for any monetary loss, that may arise directly or indirectly from the use of information provided
