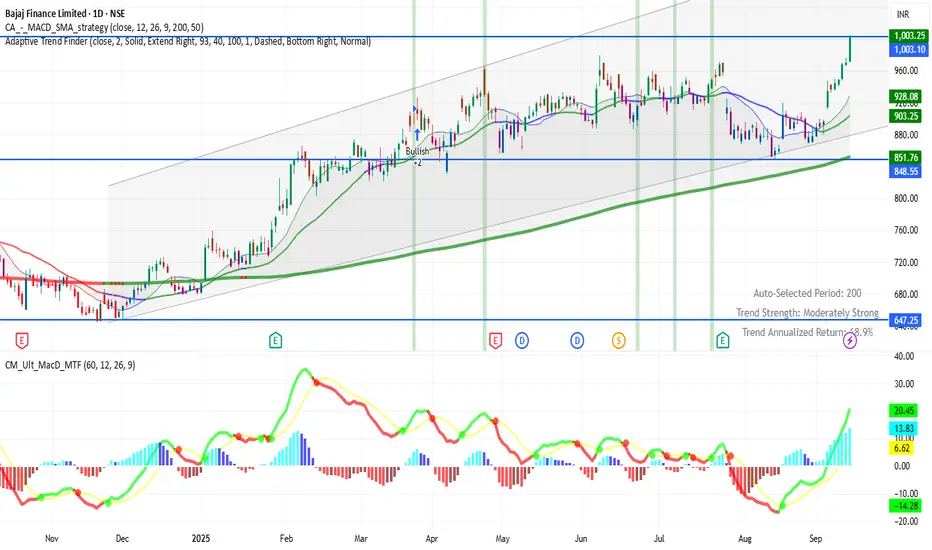
BAJFINANCE 1D Time frameCurrent Market Situation
Bajaj Finance is trading around ₹1003 in the daily chart. This level is very important because the stock has just touched its 52-week high near ₹1005. On the lower side, today’s support level is around ₹970 – ₹975, which is also close to the previous closing price.
The overall trend in the daily chart is strongly bullish, meaning buyers are in control right now.
ITC
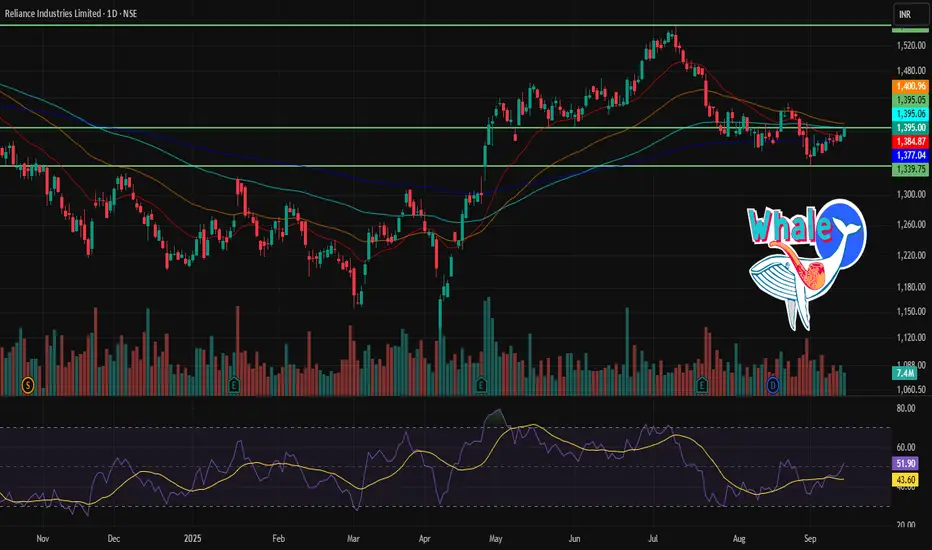
RELIANCE 1D Time frame🔢 Current Level
Trading around ₹1,395
🔑 Key Resistance & Support Levels
Resistance Zones:
~ ₹1,400 – ₹1,410 (near-term resistance)
~ ₹1,420 – ₹1,430 (stronger resistance above)
Support Zones:
~ ₹1,380 – ₹1,370 (first support)
~ ₹1,360 – ₹1,350 (secondary support)
📉 Outlook
Bullish Scenario: Holding above ₹1,400 could push price toward ₹1,420 – ₹1,430.
Bearish Scenario: A fall below ₹1,370 may drag it toward ₹1,350 or lower.
Neutral / Range: Likely to trade between ₹1,370 – ₹1,420 until a breakout or breakdown occurs.
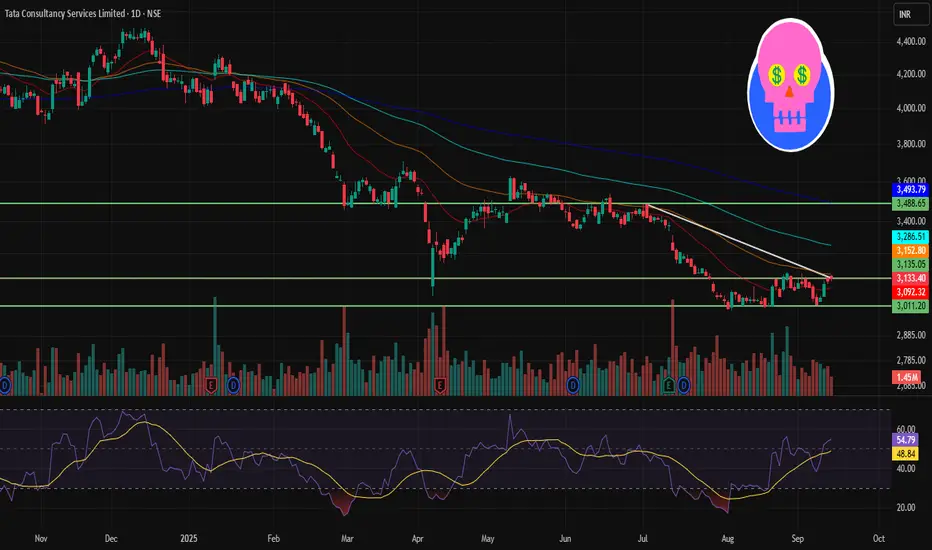
TCS 1D Time frame🔢 Current Level
~ ₹3,131
🔑 Key Resistance & Support Levels
Resistance Zones:
~ ₹3,160 – ₹3,180 (near-term resistance)
~ ₹3,200 – ₹3,220 (stronger resistance above)
Support Zones:
~ ₹3,120 – ₹3,100 (immediate support)
~ ₹3,050 – ₹3,000 (secondary support)
~ ₹2,900 (deeper support if weakness intensifies)
📉 Outlook
Bullish Scenario: If TCS holds above ~ ₹3,120 and manages to break past ~ ₹3,180 – ₹3,200, there is potential to move toward ~ ₹3,220+
Bearish Scenario: A drop below ~ ₹3,100 could lead to a slide toward ~ ₹3,050 or lower
Neutral / Range: Between ~ ₹3,100 – ₹3,180, TCS may consolidate until a clearer breakout or breakdown
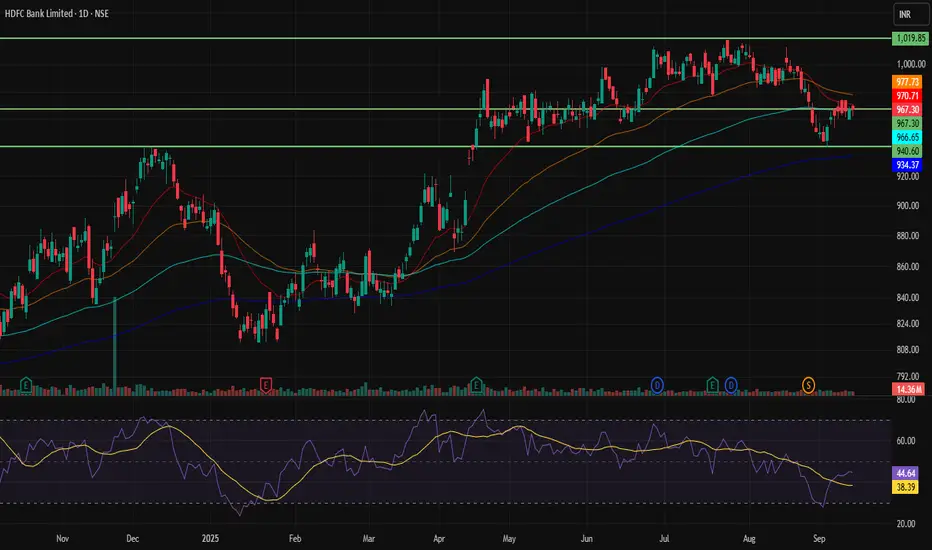
HDFCBANK 1D Time frame🔢 Current Level
Trading around ₹967
🔑 Key Resistance & Support Levels
Resistance Zones:
~ ₹970 – ₹975 (near-term resistance)
~ ₹980 – ₹985 (stronger resistance zone if it moves past the first)
Support Zones:
~ ₹962 – ₹960 (immediate support)
~ ₹955 – ₹950 (short-term support)
~ ₹945 – ₹940 (deeper support if price falls further)
📉 Outlook
Bullish Scenario: If HDFCBANK holds above ₹970 and clears resistance around ₹975, it may aim for ₹980+.
Bearish Scenario: If it drops below ₹960, it could test support in the ₹950-₹940 region.
Neutral / Range: Likely to trade sideways between ₹960-₹975 unless there’s a strong breakout or breakdown.
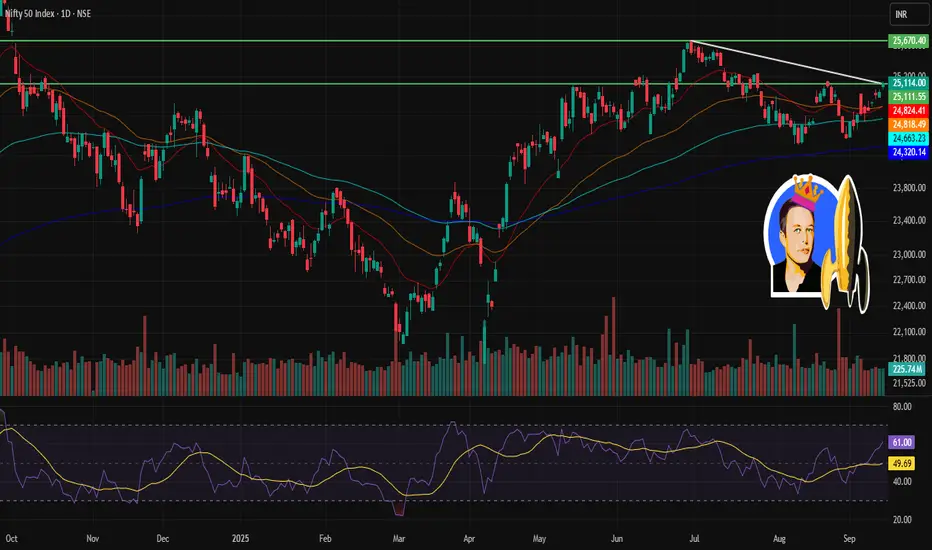
NIFTY 1D Time frame🔢 Current Level
NIFTY ~ 25,114
🔑 Key Resistance & Support Levels
Resistance Zones:
~ 25,200 – 25,250 (near-term resistance)
~ 25,400 – 25,500 (stronger resistance if it breaks above the first zone)
Support Zones:
~ 24,950 – 25,000 (immediate support)
~ 24,800 – 24,900 (short-term support)
~ 24,600 – 24,700 (deeper support, in case of downside move)
📉 Outlook
Bullish Scenario: If NIFTY holds above ~25,000 and clears ~25,250, it may head toward ~25,400-25,500.
Bearish Scenario: If it drops below ~24,950, then weakness may drag it toward ~24,800 or lower supports.
Neutral / Range: Between ~25,000 – 25,250 likely consolidation until a decisive move.
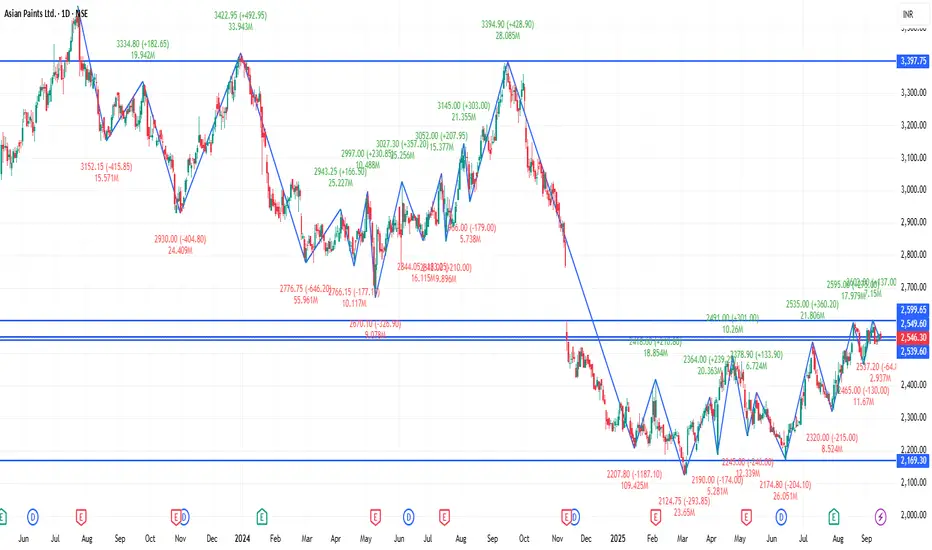
ASIANPAINT 1D Time frame🔢 Current Level
Trading around ₹2,546 – ₹2,560
🔑 Key Resistance & Support Levels
Resistance Zones:
₹2,559 – ₹2,560 (recent highs; breakout above this may lead to further upside)
₹2,580 – ₹2,600 (stronger resistance above)
Support Zones:
₹2,540 – ₹2,545 (immediate support; failure to hold above this may lead to a decline)
₹2,520 – ₹2,530 (short-term support; a break below this could indicate weakness)
₹2,500 – ₹2,510 (deeper support zone if price dips further)
📉 Outlook
Bullish Scenario: If Asian Paints holds above ₹2,545, upward momentum may continue. Break above ₹2,560 can open the way toward ₹2,580+.
Bearish Scenario: If it falls below ₹2,520, risk increases toward ₹2,500 – ₹2,510.
Neutral / Range: Between ₹2,545 – ₹2,560, Asian Paints may consolidate before a directional move.
SBIN 1D Time frame🔢 Current Level
Trading around ₹823.65
🔑 Key Resistance & Support Levels
Resistance Zones:
₹825.00 – ₹830.00 (recent highs; breakout above this may lead to further upside)
₹835.00 – ₹840.00 (stronger resistance above)
Support Zones:
₹815.00 – ₹820.00 (immediate support; failure to hold above this may lead to a decline)
₹810.00 – ₹815.00 (short-term support; a break below this could indicate weakness)
₹800.00 – ₹805.00 (deeper support zone if price dips further)
📉 Outlook
Bullish Scenario: If SBIN holds above ₹820.00, upward momentum may continue. Break above ₹830.00 can open the way toward ₹840.00+.
Bearish Scenario: If it falls below ₹800.00, risk increases toward ₹790.00 – ₹795.00.
Neutral / Range: Between ₹820.00 – ₹830.00, SBIN may consolidate before a directional move.

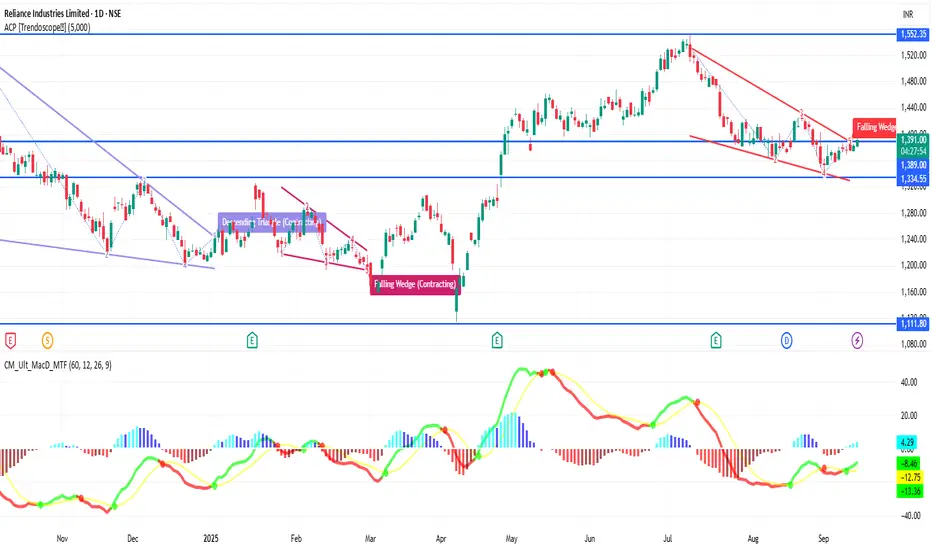
RELIANCE 1D Time frame🔢 Current Level
Trading around ₹1,393 - ₹1,395
🔑 Key Resistance & Support Levels
Resistance Zones:
~ ₹1,400 – ₹1,431 (immediate resistance band)
~ ₹1,440 – ₹1,460 (higher resistance if momentum continues)
Support Zones:
~ ₹1,380 – ₹1,370 (short-term support)
~ ₹1,360 (important support below)
📉 Outlook
Bullish Scenario: Holding above ₹1,400 and breaking past ₹1,431 can open the path toward ₹1,440–₹1,460.
Bearish Scenario: A fall below ₹1,370–₹1,360 increases risk of deeper decline.
Neutral / Range: Between ₹1,360–₹1,431, Reliance may move sideways until a clear breakout happens.
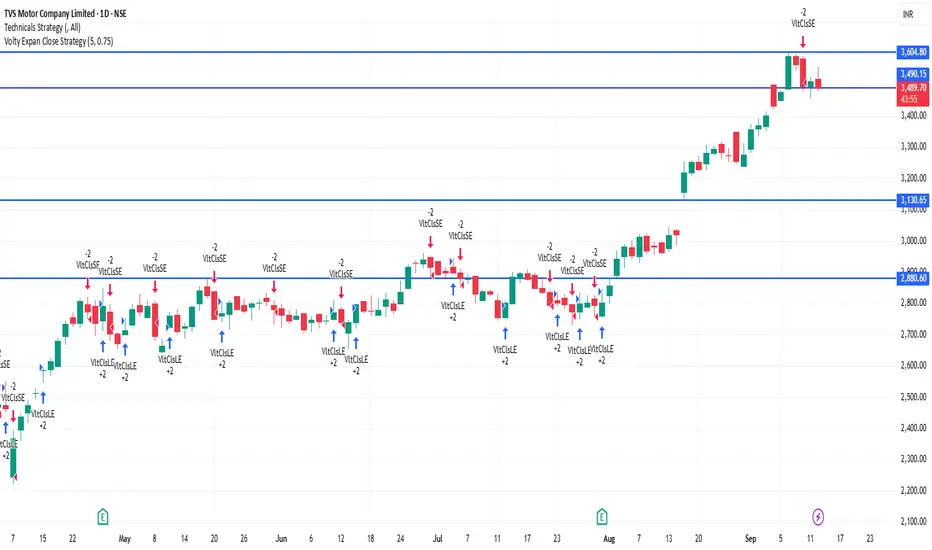
TVSMOTOR 1D Time frame🔢 Current Level
Trading around ₹3,490 – ₹3,526
🔑 Key Resistance & Support Levels
Resistance Zones:
₹3,550 – ₹3,556 (near-term resistance; breakout above this may lead to further upside)
₹3,600 (psychological resistance)
₹3,650 (stronger resistance above)
Support Zones:
₹3,510 – ₹3,520 (immediate support; failure to hold above this may lead to a decline)
₹3,480 – ₹3,490 (short-term support; a break below this could indicate weakness)
₹3,400 – ₹3,450 (deeper support zone if price dips further)
📉 Outlook
Bullish Scenario: If TVS Motor holds above ₹3,520, upward momentum may continue. Break above ₹3,556 can open the way toward ₹3,600+.
Bearish Scenario: If it falls below ₹3,480, risk increases toward ₹3,400 – ₹3,450.
Neutral / Range: Between ₹3,520 – ₹3,556, TVS Motor may consolidate before a directional move.
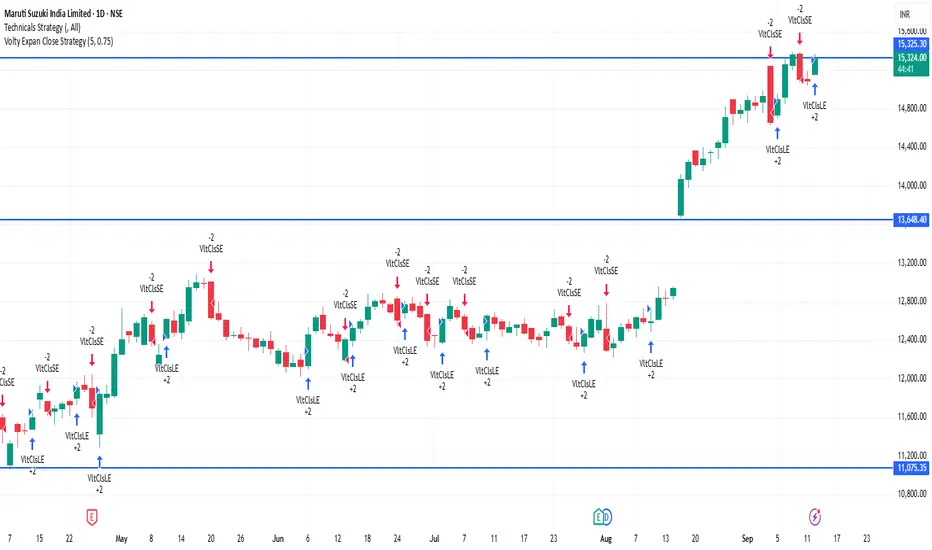
MARUTI 1D Time frame🔢 Current Level
Trading around ₹15,318 – ₹15,325
🔑 Key Resistance & Support Levels
Resistance Zones:
₹15,373 – ₹15,384 (recent highs; breakout above this may lead to further upside)
₹15,400 (psychological resistance)
₹15,500 (stronger resistance above)
Support Zones:
₹15,150 – ₹15,160 (immediate support; failure to hold above this may lead to a decline)
₹15,050 – ₹15,100 (short-term support; a break below this could indicate weakness)
₹14,800 – ₹14,900 (deeper support zone if price dips further)
📉 Outlook
Bullish Scenario: If Maruti Suzuki holds above ₹15,160, upward momentum may continue. Break above ₹15,384 can open the way toward ₹15,500+.
Bearish Scenario: If it falls below ₹15,050, risk increases toward ₹14,800 – ₹14,900.
Neutral / Range: Between ₹15,160 – ₹15,384, Maruti Suzuki may consolidate before a directional move.
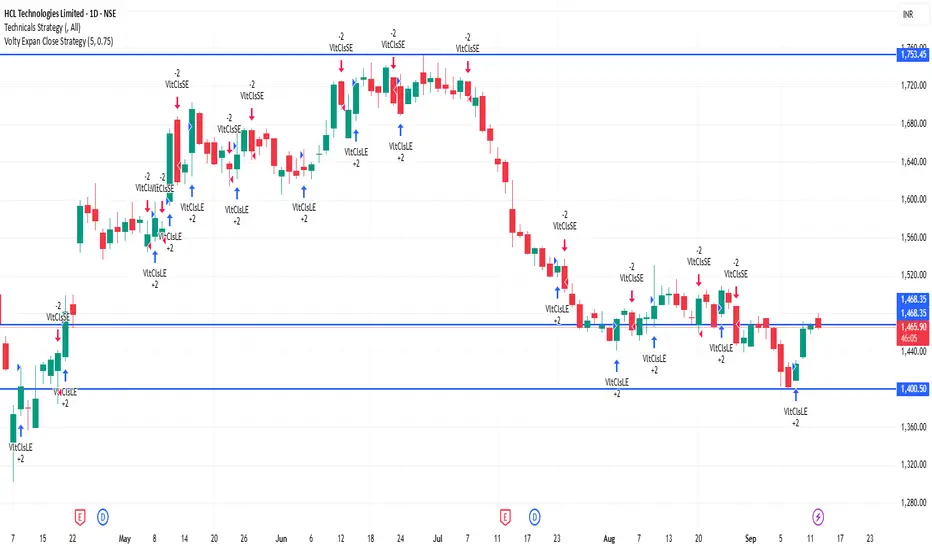
HCLTECH 1D Time frame🔢 Current Level
Trading around ₹1,465.80 - ₹1,467.80
🔑 Key Resistance & Support Levels
Resistance Zones:
₹1,472 – ₹1,475 (recent highs; breakout above this may lead to further upside)
₹1,485 – ₹1,490 (stronger resistance above)
Support Zones:
₹1,460 – ₹1,463 (immediate support; failure to hold above this may lead to a decline)
₹1,450 – ₹1,453 (short-term support; a break below this could indicate weakness)
₹1,440 – ₹1,445 (deeper support zone if price dips further)
📉 Outlook
Bullish Scenario: If HCL Technologies holds above ₹1,463, upward momentum may continue. Break above ₹1,475 can open the way toward ₹1,485+.
Bearish Scenario: If it falls below ₹1,440, risk increases toward ₹1,430 – ₹1,445.
Neutral / Range: Between ₹1,463 – ₹1,475, HCL Technologies may consolidate before a directional move.
SBIN 1D Time frame🔢 Current Level
Trading around ₹823.65 - ₹825.00
🔑 Key Resistance & Support Levels
Resistance Zones:
₹824 – ₹826 (recent highs; breakout above this may lead to further upside)
₹830 (psychological resistance)
₹840 – ₹850 (stronger resistance above)
Support Zones:
₹820 – ₹822 (immediate support; failure to hold above this may lead to a decline)
₹810 (short-term support; a break below this could indicate weakness)
₹800 – ₹805 (deeper support zone if price dips further)
📉 Outlook
Bullish Scenario: If SBIN holds above ₹822, upward momentum may continue. Break above ₹826 can open the way toward ₹830+.
Bearish Scenario: If it falls below ₹810, risk increases toward ₹800 – ₹805.
Neutral / Range: Between ₹822 – ₹826, SBIN may consolidate before a directional move.

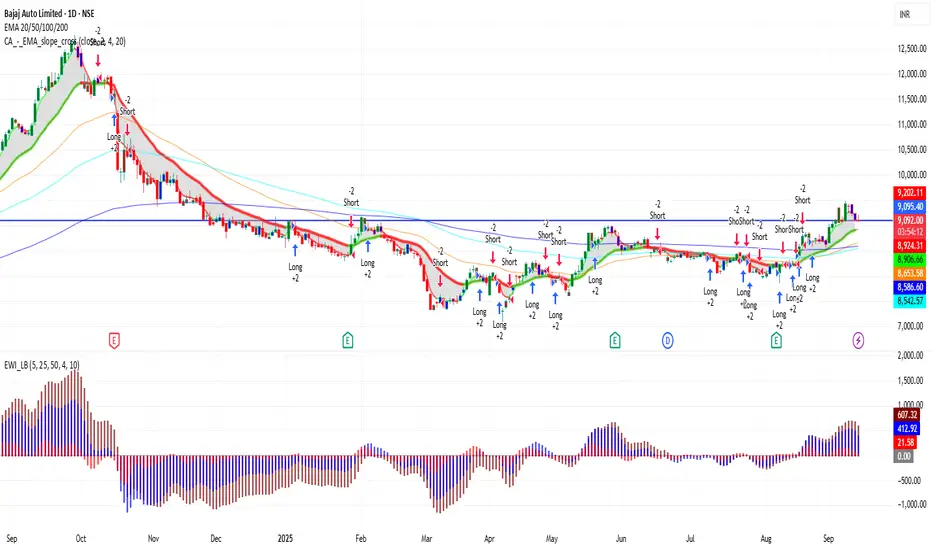
BAJAJ_AUTO 1D Time frame🔢 Current Level
Trading around ₹9,092 – ₹9,110
🔑 Key Resistance & Support Levels
Resistance Zones:
₹9,150 – ₹9,200 (near-term resistance; breakout above this may lead to further upside)
₹9,300 (stronger resistance above)
Support Zones:
₹9,070 – ₹9,090 (immediate support)
₹8,900 (stronger support if price dips further)
₹8,800 (deeper support zone)
📉 Outlook
Bullish Scenario: If Bajaj Auto holds above ₹9,090, upward momentum may continue. Break above ₹9,200 can open the way toward ₹9,300+.
Bearish Scenario: If it falls below ₹8,900, risk increases toward ₹8,800.
Neutral / Range: Between ₹9,090 – ₹9,200, Bajaj Auto may consolidate before a directional move.
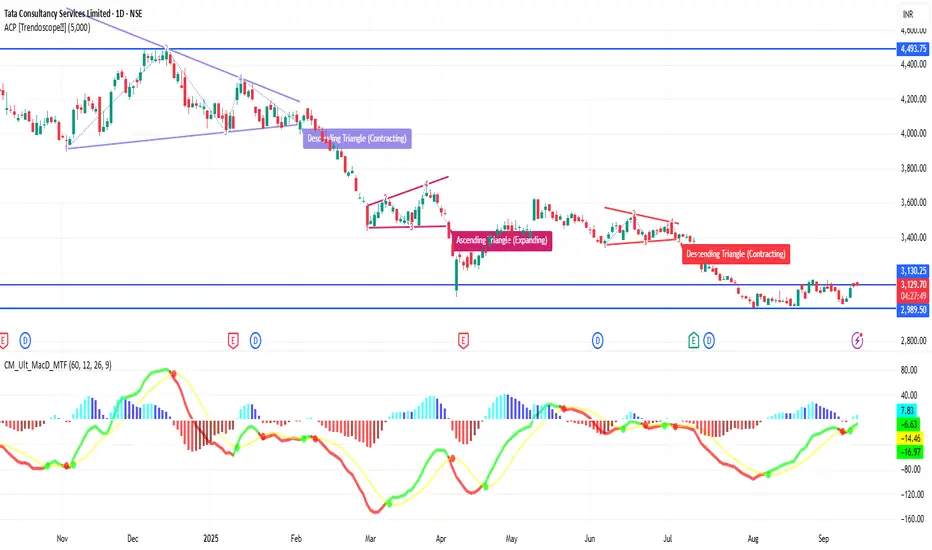
TCS 1D Time frame🔢 Current Level
Trading around ₹3,125 – ₹3,135
🔑 Key Resistance & Support Levels
Resistance Zones:
₹3,138 – ₹3,153 (near-term resistance; breakout above this may lead to further upside)
₹3,167 (stronger resistance above)
Support Zones:
₹3,095 – ₹3,110 (immediate support)
₹3,080 (stronger support if price dips further)
₹3,050 – ₹3,060 (deeper support zone)
📉 Outlook
Bullish Scenario: If TCS holds above ₹3,110, upward momentum may continue. Break above ₹3,153 can open the way toward ₹3,167+.
Bearish Scenario: If it falls below ₹3,080, risk increases toward ₹3,050.
Neutral / Range: Between ₹3,110 – ₹3,153, TCS may consolidate before a directional move.
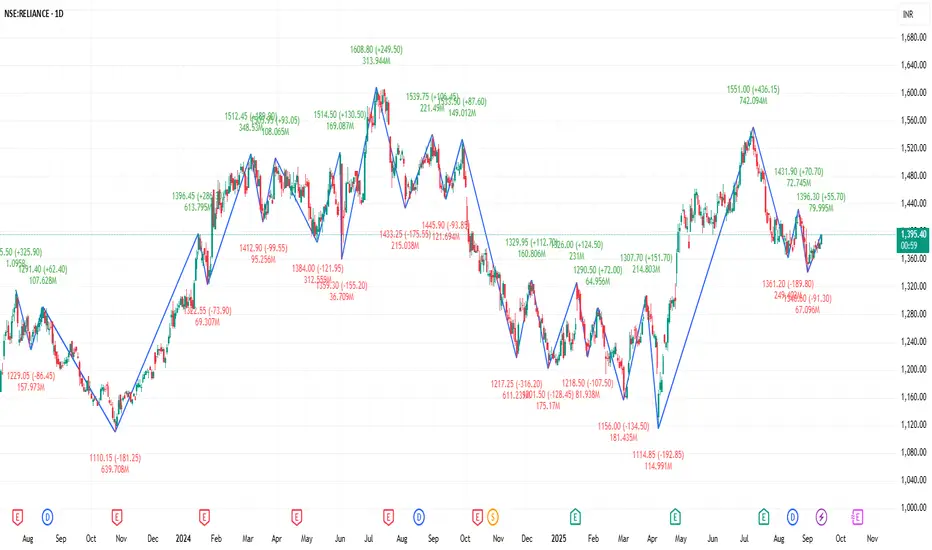
RELIANCE 1D Time frame🔢 Current Level
RELIANCE is trading around ₹1,391 – ₹1,392
🔑 Key Resistance & Support Levels
Resistance Zones:
₹1,392 – ₹1,396 (near-term resistance; breakout above this may lead to further upside)
₹1,400 (psychological resistance)
₹1,427 (stronger resistance above)
Support Zones:
₹1,380 – ₹1,385 (immediate support)
₹1,370 (short-term support; break below may indicate weakness)
₹1,350 (deeper support zone if selling pressure continues)
📉 Outlook
Bullish Scenario: If RELIANCE holds above ₹1,385, upward momentum may continue. Break above ₹1,396 can open the way toward ₹1,400+.
Bearish Scenario: If it falls below ₹1,370, risk increases toward ₹1,350.
Neutral / Range: Between ₹1,385 – ₹1,396, RELIANCE may consolidate before a directional move.
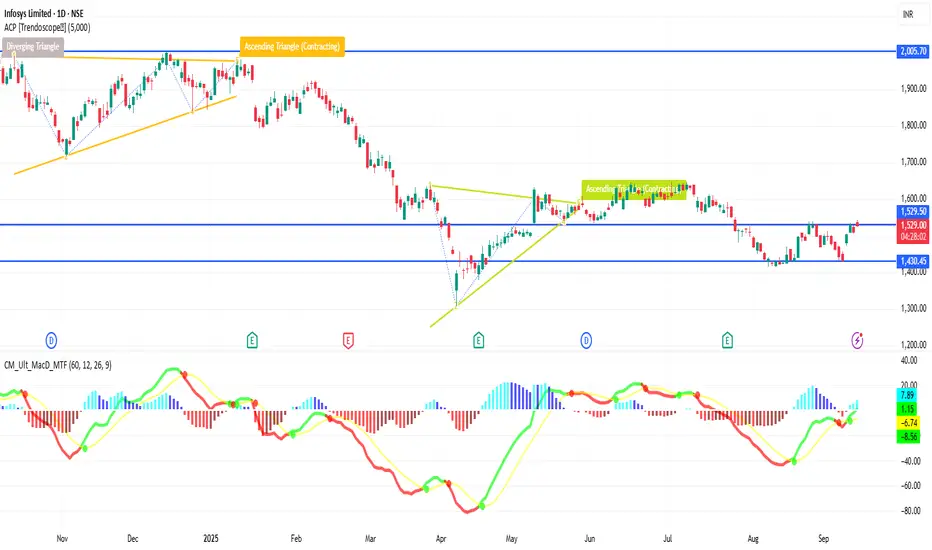
INFY 1D Time frame🔢 Current Level
INFY is trading around ₹1,510 – ₹1,529
🔑 Key Resistance & Support Levels
Resistance Zones:
₹1,518 – ₹1,520 (near-term resistance; breakout above this may lead to further upside)
₹1,530 (stronger resistance above)
Support Zones:
₹1,484 – ₹1,485 (immediate support)
₹1,481 (stronger support if price dips further)
₹1,470 – ₹1,472 (deeper support zone)
📉 Outlook
Bullish Scenario: If INFY holds above ₹1,485, upward momentum may continue.
Breakout Scenario: A move above ₹1,520 can open the way toward ₹1,530+.
Bearish Scenario: If it falls below ₹1,481, risk increases toward ₹1,470 – ₹1,472.
SENSEX 1D Time frame🔢 Current Level
Sensex is around ₹81,800 – ₹81,818
🔑 Key Resistance & Support Levels
Resistance Zones
~ ₹81,900 – ₹82,200 (recent highs / selling pressure zone)
~ ₹82,500 (stronger resistance above)
Support Zones
~ ₹81,300 – ₹81,400 (immediate support)
~ ₹81,100 (stronger support if price dips further)
~ ₹80,800 – ₹80,900 (deeper support zone)
📉 Outlook
If Sensex holds above ~ ₹81,400, bullish scenario remains alive.
Break above ~ ₹82,200 can open upside toward ~ ₹82,500+.
If it loses ~ ₹81,300, then downward risk increases, possibly toward ~ ₹81,100 or lower.

BANKNIFTY 1D Time frame📊 Current Snapshot
Current level: around 54,680 - 54,690
Today’s range: approx. 54,580 – 54,850
🔑 Key Daily Levels
Resistance Zones
54,960 (near-term resistance)
55,172 (major resistance; breakout above this could extend rally)
55,000 (psychological resistance)
Support Zones
54,462 (immediate support)
54,400 – 54,500 (important support band)
54,107 (deeper support if selling pressure continues)
📉 Outlook
Bullish Case: If Bank Nifty sustains above 54,960 – 55,172, it can move higher towards 55,300 – 55,500.
Bearish Case: If it breaks below 54,400, the index may slip toward 54,100 or even lower.
Neutral / Range: Between 54,400 – 54,960, sideways movement is likely until a breakout occurs.

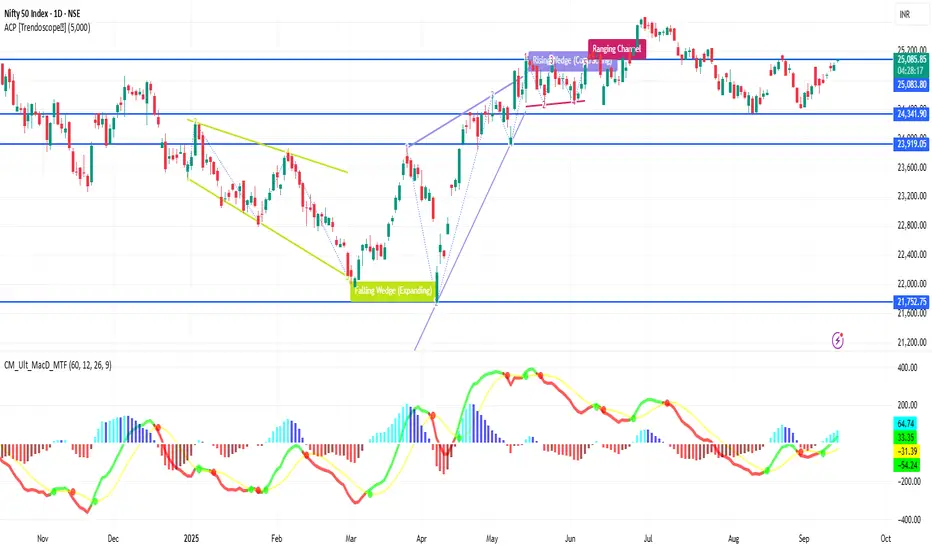
NIFTY 1D Time frame📊 Current Data
Current trading level: around 25,076 – 25,091
Today’s range: approx. 25,038 – 25,095
52-week range: 21,743 – 26,277
🔑 Key Daily Levels
Resistance Zones
25,090 (near-term resistance just above current trading)
25,153 (recent swing high, major resistance level)
Support Zones
24,994 – 24,950 (immediate support range)
24,800 (strong support zone; crucial for trend continuation)
📉 Trend View
Bullish Case: If NIFTY sustains above 25,090 and breaks 25,153, it could push higher towards 25,200+.
Bearish Case: If it fails to hold 24,950–24,994 and slips below 24,800, downside momentum could strengthen.
Neutral Zone: Between 25,000 – 25,050, NIFTY may consolidate before deciding direction.
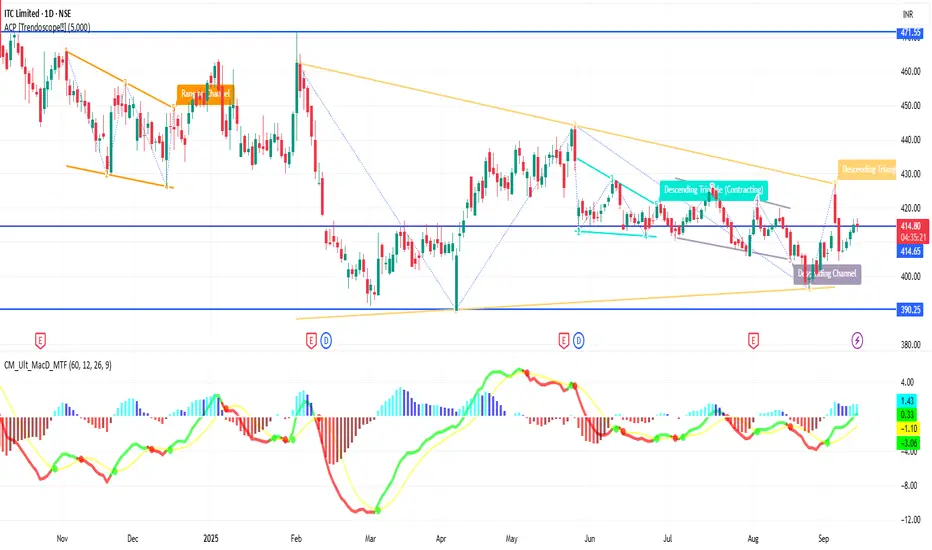
ITC 1D Time frame🔢 Current Level
Trading around ₹414 – ₹432
🔑 Key Resistance & Support Levels
Resistance Zones:
₹435 – ₹438 (near-term resistance; breakout above this may lead to further upside)
₹442 (stronger resistance above)
Support Zones:
₹425 – ₹428 (immediate support)
₹420 (stronger support if price dips further)
₹415 – ₹417 (deeper support zone)
📉 Outlook
Bullish Scenario: If ITC holds above ₹428, upward momentum may continue. Break above ₹438 can open the way toward ₹442+.
Bearish Scenario: If it falls below ₹420, risk increases toward ₹415 – ₹417.
Neutral / Range: Between ₹428 – ₹438, ITC may consolidate before a directional move.
HDFCBANK 1D Time frame🔢 Current Level
Trading around ₹964.55 - ₹967.80
🔑 Key Resistance & Support Levels
Resistance Zones:
₹970 – ₹975 (near-term resistance; breakout above this may lead to further upside)
₹980 (psychological resistance)
₹1,000 (stronger resistance above)
Support Zones:
₹960 – ₹965 (immediate support)
₹950 (stronger support if price dips further)
₹940 – ₹945 (deeper support zone)
📉 Outlook
Bullish Scenario: If HDFCBANK holds above ₹965, upward momentum may continue. Break above ₹975 can open the way toward ₹980+.
Bearish Scenario: If it falls below ₹950, risk increases toward ₹940 – ₹945.
Neutral / Range: Between ₹965 – ₹975, HDFCBANK may consolidate before a directional move.

HDFCBANK 1D Time frame📍 Current Price Action
Current Price: ~₹968
Day Range: ₹960 – ₹975
Trend: Neutral to mildly bullish
⚙ Technical Indicators
RSI (14): ~53 → neutral momentum
MACD: Slightly positive → mild upside bias
ADX (14): ~32 → moderate trend strength
MFI (Money Flow Index): Mid-range → balanced buying/selling pressure
📊 Moving Averages
Short-term (5, 10, 20-day): Price trading above → bullish signals
Medium to Long-term (100, 200-day): Mixed to weak → acting as resistance
📉 Support & Resistance
Immediate Support: ₹960 – ₹965
Next Support Zone: ₹940 – ₹950
Immediate Resistance: ₹970 – ₹975
Next Resistance: ₹985 – ₹990
🧠 Summary
HDFC Bank is in a neutral to mildly bullish zone on the daily chart. Price is holding above short-term averages, but longer-term averages are acting as resistance. If the stock sustains above ₹975, it may move toward ₹985–₹990. Failure to hold ₹960 could drag it toward ₹940–₹950.

TATACONSUM 1D Time frame📍 Current Price Action
Current Price: ~₹1,105
Day Change: +0.3% approx
52-Week Range: ₹882 – ₹1,234
⚙ Technical Indicators
RSI (14): ~62-65 → bullish momentum
MACD: Positive → upside bias intact
ADX (14): Above 50 → strong trend strength
Stochastic / Williams %R: In overbought zone → short-term pullback risk
📊 Moving Averages
Short-term (5, 10-day): Bullish, price trading above
Medium-term (20, 50-day): Bullish, trend supportive
Long-term (100, 200-day): Bullish, strong structure
📉 Support & Resistance
Immediate Support: ₹1,080 – ₹1,090
Next Support Zone: ₹1,060 – ₹1,030
Immediate Resistance: ₹1,115 – ₹1,125
Major Resistance (52-week high): ₹1,230+
🧠 Summary
Tata Consumer is bullish on the daily chart. Indicators and moving averages show strong momentum, though overbought signals suggest chances of consolidation or mild pullback. Holding above ₹1,080 keeps the uptrend intact. A breakout above ₹1,125 can open the way toward ₹1,230+.
