ITC Limited - EW AnalysisITC Limited Complete analysis in EW theory now in correction phase of super cycle degree expected correction minimum fib retrace of wave1 38.2 % (Super cycle degree) already 30% over so expected reversal possible at 320-280 price level good opportunity for long term Investors and traders
Itclimited

ITC – Sell on Rise | Major Support Zone Ahead📉 ITC – Sell on Rise | Major Support Zone Ahead
Stock: ITC Ltd
Timeframe: Daily
Trend: Bearish (Short-term)
🔍 Technical Analysis
ITC has decisively broken all major support levels, indicating a clear shift in market structure from sideways to bearish. The recent breakdown is accompanied by weak price action, suggesting sellers are in control on rallies.
Post breakdown, the stock is now below key moving averages and struggling to reclaim lost support zones, confirming a sell-on-rise structure.
🔻 Trend Structure
Breakdown of multiple supports
Lower highs formation on daily timeframe
Pullbacks likely to face selling pressure
🔻 Volume Behavior
Breakdown occurred with expanding volumes
Indicates distribution, not panic selling
Any bounce without volume likely to fail
🟢 Strong Buy Support Zone (High Probability Demand Area)
📍 ₹280 – ₹295 zone
This zone is technically important due to:
Fibonacci 0.50 retracement level
Anchored VWAP support
Prior price acceptance area
This zone is expected to act as a strong demand zone where buyers may attempt a reversal or consolidation.
🧠 Trading Plan
🔹 Sell on Rise
Look for rejection signals near broken supports
Avoid fresh longs above resistance until structure improves
🔹 Buy Only at Support
Aggressive longs only if strong price reaction is seen in ₹280–₹295 zone
Look for:
Bullish reversal candle
Volume expansion on bounce
Failure of price to sustain below VWAP
⚠️ Risk Management
Avoid positional longs until price reclaims key resistances
Keep strict stop loss below support zone if attempting counter-trend longs
This is a zone-based trade, not blind buying
📌 Conclusion
ITC remains bearish in the short term and is best approached with a sell-on-rise strategy. A meaningful buying opportunity may emerge only near the ₹280–₹295 strong support zone, supported by Fibonacci 0.50 and Anchored VWAP confluence.
📉 Trade the trend. Respect levels. Manage risk.

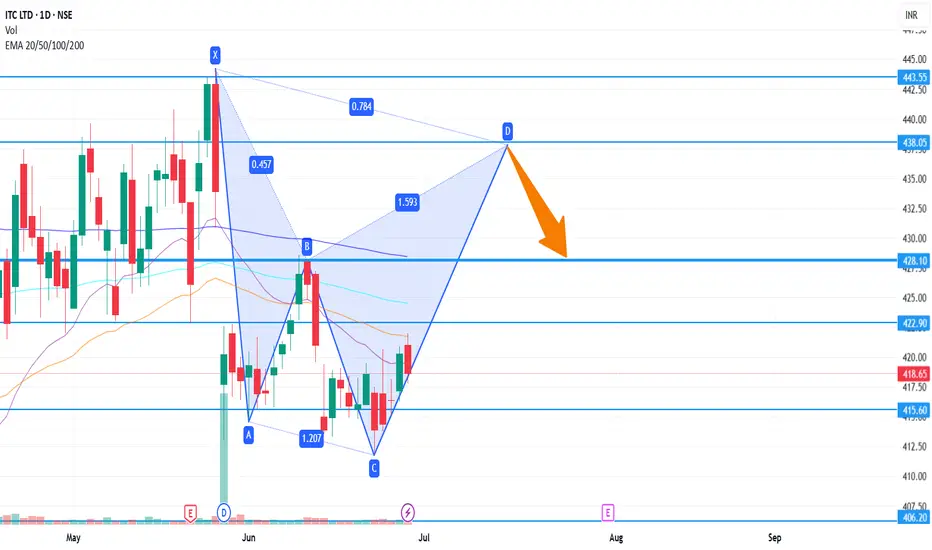
ITC Short Term 438ITC on daily chart is forming a bearish harmonic pattern.
If it follows the pattern formation then next targets at 428 and 438
Stop Loss is 413
Heads Up! ITC Looks Ready to FlyAfter a steady decline from its highs, ITC has made a strong comeback, bouncing perfectly off its trendline support. And now—it’s broken past its trendline resistance!
📈 This breakout could be the start of a new bullish wave, with momentum likely to carry the stock higher in the sessions ahead.
💰 Dividend Alert: ITC has announced a final dividend of ₹7.85 per share, with the ex-date on 28th May. This is the highest dividend declared by ITC in the last 5 years. That could bring some serious action in the next couple of trading days.
🎯 All eyes on ITC—this might just be the breakout we’ve been waiting for!

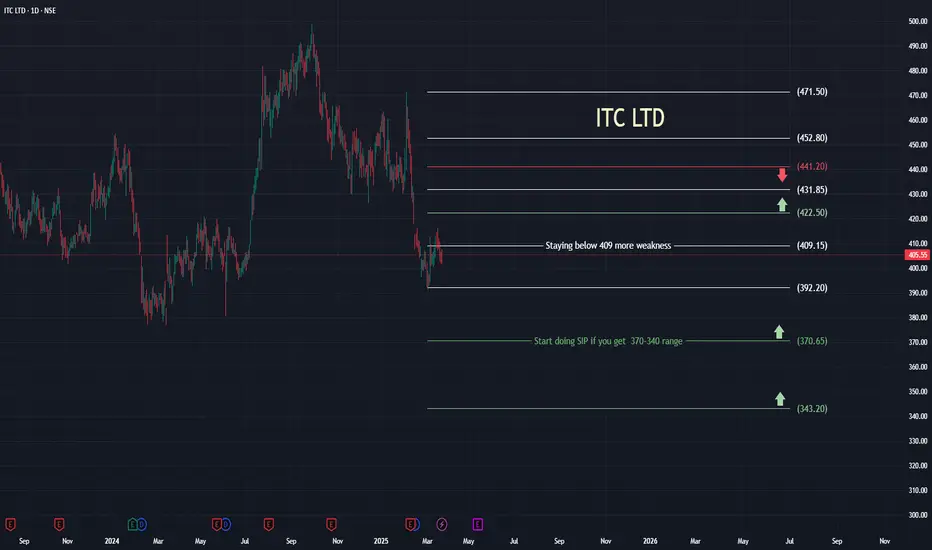
ITC LTDITC LTD
One of the most sought after stock in recent years
corrected around 20% from high of 499
trying to find ground but still has to cross and sustain above 409 on EOD basis...
those who missed out can start SIP from 340-371 levels...
Other levels marked for using as churning profits from level to level.
Like.. Share... Comment
Angel One Weekly - Already correcting for a longer down targetAngel One Weekly - Already correcting for a longer down target
Angel one has been correcting from Jan 24 till today, correcting nearly 1850 .
During last 58 weeks, it has corrected nearly 1850 points, i.e. 32 points per week. So around 1 percent of maximum stock value per week correction.
The recent correction from 3400ish , is expected to move till 1500ish value. There is a range of target which is marked on chart. It is around 1.27 extension as marked on chart.
On a weekly basis, on a short term, market may look positive as we see a rare complex correction which looks like a triangle. So the positive movement should be less, which are marked on chart. (We can analyze it on lower time frame as another post. )

ITC is already in Correction mode - MonthlyITC Looks already in Correction mode - Monthly
ITC stock , did large correction lasttime during, started correction July 17 from 265 to 100.76 on mar 20. Then the motive wave started from 100 to 491 till sep 24 i.e. 4 year 6 months or 4.5 years. So ITC had grown 87 points per year during those time.
From sep24, stock has been correcting. While applying Elliot wave, we find the motive wave cycle had ended on sep 24.
So we are expecting a correction . Currently the movement seems rapid downward movement , i.e. 491 to 400 value recently. Movement of - 91 during last 5-6 months. i.e. 18 points per months or 216 points downard per year rate. which is much faster compared to last 87 points up movement speed.
As per theory, it is evident that the correction is there to continue for some time. Current month, we can expect it to do correction till next month march 25, when there is chance of little changes while forming the corrective abc.
Key dates to watch out for the corrective wave are marked on chart. Happy trading.

ITC - 2 PossiblitiesRight now stock is holding its strong support zone of 478
If successful stock may make a journey upto 500 without halt
If not it may fall and take the more stronger support of 468
In both cases idea voids below 465

Itc - Sideways to Bullish in coming daysStock seems to be near the end of bearishness
Multiple strong conjunctive supports arriving
494 - 496 strongest support for the stock
View negates below 492
Possible targets 515/530

ITC - BullishITC taking support at the strongest flip zone 503-503
Bouncing back from here may possible take stock to chart new Ath territory
Any break below 500 will take it back near 575-80
Trade accordingly

Short (OI) Buildup in ITCHello Traders,
As we can see the whole Trading session ITC failed to Sustain above 510.65 levels which is the strong resistance in ITC now.
& the data says very big short positions has been created in ITC.
Be aleart It can reverse at any given point of Time.
Thank You
Prince

ITC A Money MachineHello Traders,
Sabka Pyaara Sabka Chahita Apne ITC se nazar mat hatana,
Keep an eye on the Mini bull, Sector is performing well & the Leader is Just near Breakout zone 510.
Monthly RSI > 60
WEEKLY RSI > 60
& Daily is Taking rest at 60 zone.
Can Give the Big Targets in coming Months.
Education Purpose Only
Thank You
Prince

ITC Ltd - Breakout OpportunityDate : 18-Jul-2024
LTP : Rs. 470.25
Targets: (1) Rs. 481 --> (2) Rs. 499 --> (3) Rs. 532
SL : Rs. 433 on daily close basis
Technical View:
• NSE:ITC was going through primary downtrend since Jul-2023.
• After touching the high of 481.45 on 4-Jan-2024, it has retraced 17% to 399.4 level and it has retraced 20% since Jul-2023.
• On 15-Jul-2024, NSE:ITC has broke out from its primary down trend with higher volume.
• NSE:ITC is trading above 20 DMA, 50 DMA and 21 DEMA.
• RSI is trading at 78.79 and MACD is trading at 9.64. Indicating bullish momentum.
• Looking strong to start an uptrend.
Disclaimer : I am not a SEBI registered analyst/consultant and not recommending anyone to take any BUY or SELL position in stock market. Investing in stock market is risky and one should do a self analysis and validation before investing in stock market. My ideas are published for learning purpose only and are available to everyone at no cost/charge.

Buy ITC Short Term Trading Advice by Goodluck Capital
Buy ITC
Buy Range- 457 - 462
Target- 485 - 490
StopLoss- below 450
Potential Return- 6-7%
Approx trade duration 14 - 15 days

ITC UpmomentumItc potential momentum.
This is just an observation not a recommendation. Its only if the degree of momentum continuous the targets can be achieved.

ITC looks BULLISH, Good for long term.In this video, I have provided my view on ITC for swing trading as well as long term investing.
Watch the video for more details.

Stock of the year at important junctionNSE:ITC after having a splendid run throughout the year is now at a very important junction. It is a fairly visible H&S (Head & Shoulder) in making but breakdown looks like snowball's chance in hell. Hence that means NSE:ITC can be a good reversal candidate but only after strong close above 456 level. That should lead NSE:ITC towards 500 and then further for new highs. Breakout above 456 may look for a inverted H&S or double bottom breakout. Things are difficult for equity market but the course of this war shall be decided in upcoming days when we will know the participating countries and fronts. One can add NSE:ITC at current levels if they have missed the rally throughout as it is holding on its levels, 432-430 shall act as stop loss. A closing below these levels shall trigger the breakdown of the above-mentioned H&S. We have 2 inside bars in last 4 candles which also indicate accumulation at current levels. It will be very exciting to see which way these positions move. If a breakdown takes place then NSE:ITC will move towards 415-420 levels otherwise this trending stock should remain the contender for more upside this year and further.

ITC Analysis Stock is trading in higher high pattern since many days, today broken 4% due to separation of ITC hotel business. Keep track.

ITC to DIVE TILL 350 below 384 closingNSE:ITC ITC has been sideways at the highs of life time and is showing negative signs of sharp down fall set up if it comes down and breaks the range support of 378/369,
below 369we can seen a sharp fall to 350 step by step with only 1 pause/support zone n middle at 363/361.
IF ITC BREAKS RANGE HIGHS/RESISTANCE OF 394 and gives closing and opens new candle above it, then and then only it can carry on the uptrend.

Short ITCPersonal Reference -
Current Scenario distribution have started in the stock and has limited upside potential.
Support level marked on the chart


ITC LongITC near ATH
Reversal can be seen following bounce-back along with some possibility of sideways for few weeks as well.
Long is for sure though.
Fundamentals: Good
Technical: Channel rising
Dividend: Good
Target: 367/412
Resistance: 323/308
Time Frame: 6-12 months or more (Upside)

ITC Ltd_Bullish?ITC Ltd seems Cup with handle pattern on the daily chart. If the price sustains above 350, It will move higher.
